Introduction
COVID-19, caused by the SARS-CoV-2 virus, has had a significant impact on global health and economies since its emergence in late 2019 [1]. In response to the pandemic, governments worldwide have implemented various policies to mitigate its spread and reduce morbidity and mortality rates. These policies include vaccination programs, testing strategies, and government interventions aimed at controlling the pandemic [2]. Vaccination coverage has been a key tool in controlling the spread of COVID-19 [3]. Immunization programs can help achieve herd immunity by protecting large segments of the population, reducing viral transmission, and protecting vulnerable individuals. The efficacy of the COVID-19 vaccine has already been supported through clinical studies [4]. Owing to its urgency, a vaccine against COVID-19 was developed and introduced in an unprecedentedly rapid process [5]. However, the effectiveness and capacity of vaccination programs can vary depending on factors such as vaccine availability, distribution strategies, and vaccine hesitancy among the population [6]. Therefore, the efficacy in clinical trials does not necessarily guarantee the effectiveness in the population; thus, another evaluation is required when introduced into a public program [7]. Testing has also played a crucial role in identifying and isolating cases, tracking the spread of the virus, and informing public health responses [8]. Access to COVID-19 testing has been expanded through various laws, regulations, and guidance implemented by federal policymakers [9]. In addition to vaccination and testing, government policies have played a critical role in shaping the response to the COVID-19 pandemic [10]. These policies could include measures such as lockdowns, travel restrictions, mandated mask wearing, and social distancing guidelines. Lockdown was a comprehensive policy that prevented people from gathering and banned contact. It was implemented in many countries as the number of confirmed cases increased during the pandemic, and it was effective in preventing the spread of COVID-19 [11]. However, the effectiveness of lockdowns is controversial, and one meta-analysis study concluded that the lockdown in each country at the beginning of the pandemic was ineffective [12].
Even a small preventive effect could be overestimated depending on the country and geographical location [13]. The implementation and effectiveness of these policies can vary across countries, and their impact on COVID-19 could depend on factors such as compliance levels, public health infrastructure, and socioeconomic factors. Analyzing health outcomes by Global Burden of Disease (GBD) region provides a more comprehensive and nuanced understanding of global health challenges and priorities. GBD regions are categorized based on two criteria: similarity in terms of epidemiology and proximity in terms of geography [14]. Standardizing the classification of countries by region makes it easier to compare the prevalence and incidence of various diseases, injuries, and risk factors across populations. The GBD regions also help identify and prioritize health interventions that are most needed and effective in a particular region [15]. A comprehensive understanding of these factors and their impact on COVID-19 outcomes is crucial in shaping public health strategies and policies to effectively mitigate the spread of infectious diseases and reduce morbidity and mortality rates globally [16, 17].
At a time when the world was returning to normal after the COVID-19 pandemic, in May 2023, the World Health Organization (WHO) declared the end to COVID-19 as a global health emergency. At this point, further research is needed to scientifically evaluate policies against COVID-19. Current evidence is still insufficient, with few evaluations of the GBD regions. This study examined the impact of vaccination coverage, testing, and government policies on COVID-19 mortality and incidence using a publicly generated database.
Material and methods
Variables
The incidence and mortality indices were selected as dependent variables. Daily cases refer to newly confirmed cases of COVID-19 (7-day smoothed) per million people. The counts could include probable cases, if reported. Daily deaths refer to newly confirmed deaths from COVID-19 (7-day smoothed) per million people. These counts could include probable deaths if reported.
The key independent variable in this study was vaccination. “People vaccinated per hundred” refers to the number of individuals who received at least one vaccine dose per 100 people in the total population. This figure indicates the proportion of the entire population that has received at least one dose of the vaccine. When an individual receives the first dose of a two-dose vaccine, this metric increases by one. However, when they receive the second dose, the metric remains unchanged. “People fully vaccinated per hundred” is the number of individuals who have received the complete set of doses as per the initial vaccination protocol, expressed as a rate of per 100 people in the total population. If a person receives the first dose of a two-dose vaccine, this metric remains the same. If they receive the second dose, the metric increases by one. “Daily tests” refers to the number of new COVID-19 tests per 1,000 people. The “stringency index” in COVID-19 is a metric that measures the strictness of a government’s response to the pandemic. This captures the level of government intervention in the form of policies and regulations implemented to control the spread of the virus. This index is typically calculated using indicators such as school and workplace closures, restrictions on gatherings, travel bans, testing policies, and mask mandates. It ranges from 0 to 100, with 100 indicating the strictest response.
Data and study population
This study used data from Our World in Data. This data source is a representative site that provides various data by country. COVID-19 and related data were also evaluated as reliable [18]. Data were collected from January 3, 2020 to March 29, 2023. As of the date of data extraction, COVID-19 incidence and mortality data were available for 218 countries.
Regarding GBD regions, although there were 21 regions in total, seven super-regions (CEEECA: Central Europe, Eastern Europe, and Central Asia; HI: high income; LAC: Latin America and Caribbean; NAME: North Africa & Middle East; SA: South Asia; SEAEAO: South-East Asia, East Asia, and Oceania; SSA: Sub-Saharan Africa) were used because subgroup analysis, which was too subdivided [19], was difficult owing to the lack of observations caused by data limitations.
Statistical analysis
All variables in the analysis were in panel data format, with the time variable measured in units of “days”. Descriptive statistics for each variable and a fixed-effects model were used to perform longitudinal analyses of the associations between vaccines, tests, government restriction policies, and COVID-19 incidence and mortality. The fixed-effects model was chosen because it is advantageous for assessing pure relationships between variables by controlling for invariant characteristics across units. If unique characteristics of an entity (such as a country’s political system, culture, etc.) can influence the relationship between variables, a fixed-effects model can be used to remove the influence of these time-invariant characteristics [20, 21]. The formula for the fixed effects model is as follows: The model comprises n entity-specific intercepts denoted by αi (with i ranging from 1 to n), which are unknown constants for each entity. It also consists of coefficients β1 to βn for the independent variables. The dependent variable is represented by Yit, where i refers to the entity (country), and t refers to time (days). The term “it” denotes the time interval effect, and the term Eit represents the error term.
Daily cases per million (Y1it) = αi + β1·ln People vaccinated per hundred it + β2·ln People fully vaccinated per hundred it + β3·ln Daily tests per thousand it + β4·ln Stringency index it + Eit
Daily deaths per million (Y2it) = αi + β1·ln People vaccinated per hundred it + β2·ln People fully vaccinated per hundred it + β3·ln Daily tests per thousand it + β4·ln Stringency index it + Eit
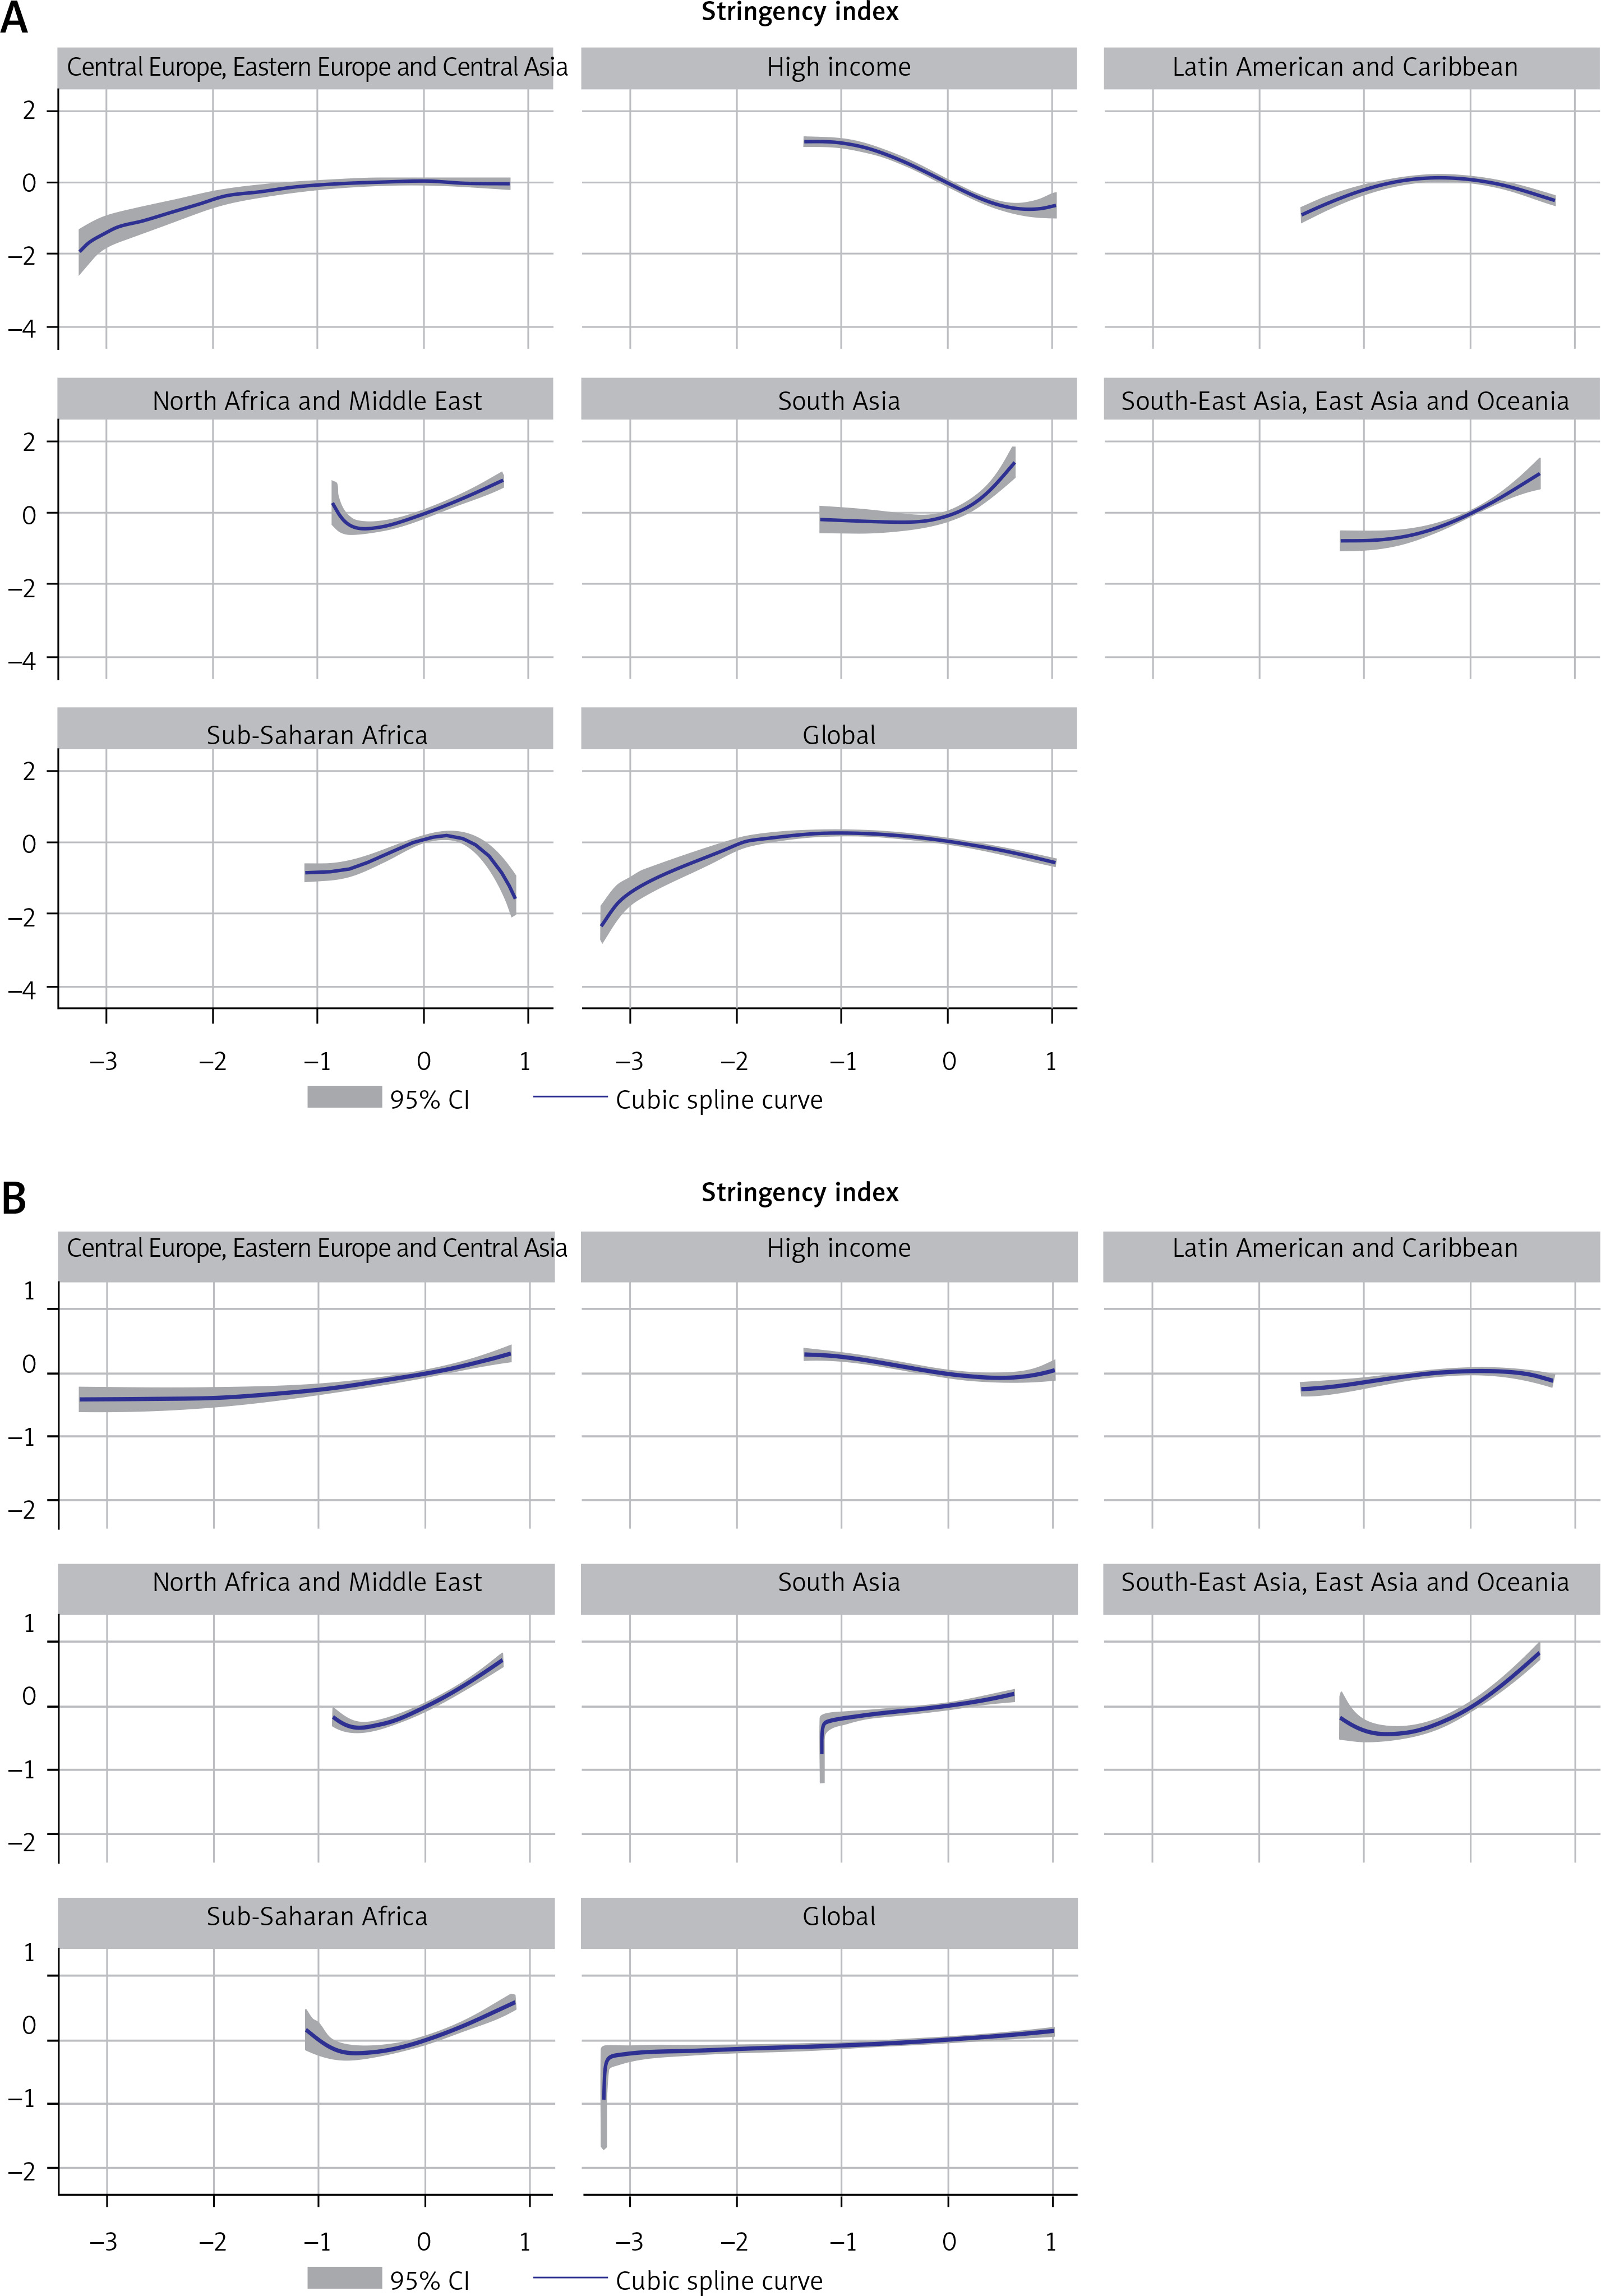
Violin plots were used to obtain an overview of the distribution of each variable within the GBD regions. As the regression line may not always be straight, cubic spline curves were used to examine the relationship between the stringency index and COVID-19 incidence and mortality rates. All analyses, except descriptive statistics, were conducted using a natural logarithm transformation. Subgroup analyses were performed based on the GBD regions.
Results
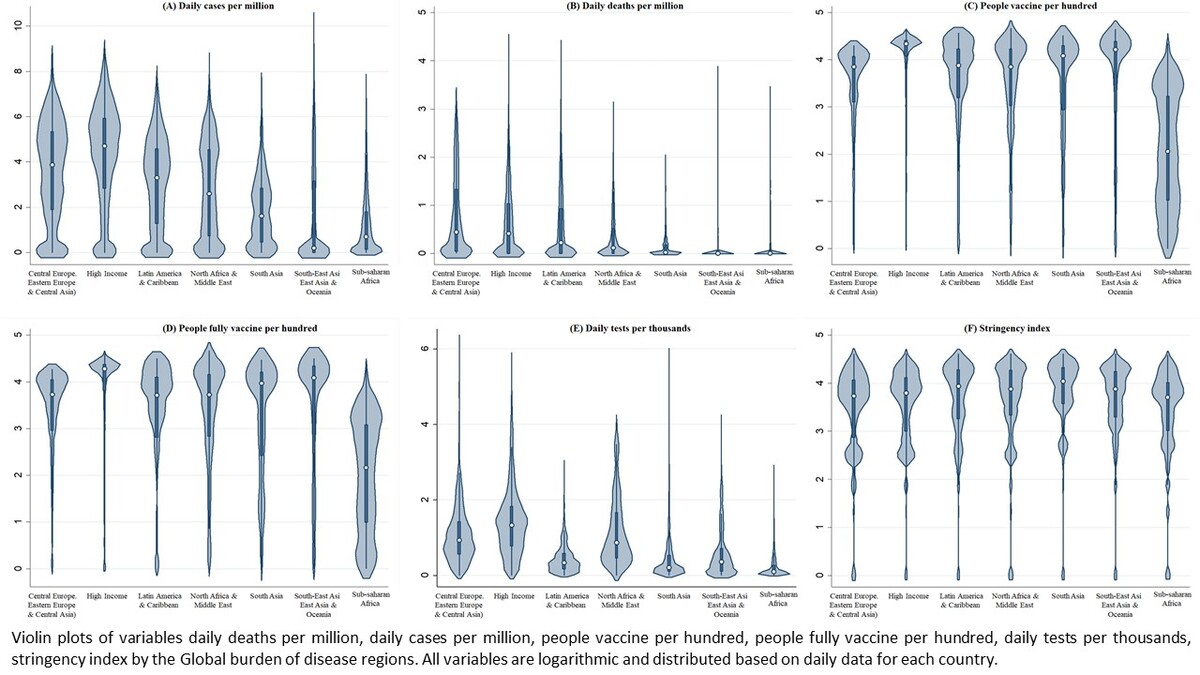
Analyzing variable characteristics and distribution patterns with violin plots
Daily cases per million were the highest in the HI region at 371.1, and the lowest in SSA at 12.5. The distribution of daily cases was generally high in the HI region during the observational period, and SSA was low (Table I, Figure 1). In contrast, SEAEAO was relatively high at 122.3, but the upper tail was long and the distribution was mostly low. Daily deaths per million were highest in CEEECA (2.4), and lowest in SA and SSA (0.2). The distribution of daily deaths was generally high in the CEEECA, but the upper tail was longer in HI and LAC regions. People vaccinated per hundred was highest in the HI region at 64.6, and lowest in SSA at 13.9; and people fully vaccinated per hundred was highest in the HI region at 58.4, and lowest in SSA at 12.6. Overall, vaccination rates were higher in the HI region. Daily tests per thousand were highest in the HI region at 6.1 and lowest in SSA at 0.3; the distribution of tests was generally high in the HI region. The stringency index was highest in SA at 53.3 and lowest in SSA at 39.2, and was distributed at a similarly high level in all regions.
Table I
Descriptive statistics for each variable after the emergence of COVID-19 by GBD region (mean and standard deviation)
Figure 1
Violin plots of variables daily deaths per million (A), daily cases per million (B), people vaccinated per hundred (C), people fully vaccinated per hundred (D), daily tests per thousand (E), stringency index (F) by Global Burden of Disease region. All variables are logarithmic and distributed based on daily data for each country
Fixed-effect analysis: association of vaccines, testing, and government restrictions with incidence and mortality rate
The research subjects analyzed in this model are 119 countries for which fixed effects can be analyzed through independent variables. Globally, vaccination per hundred was negatively associated with daily cases (Table II). Depending on the GBD regions, the trend of the association between each variable differed slightly. In regions other than CEEECA and HI, there was either a positive association or no statistical significance. In the case of people fully vaccinated per hundred, the association was positive globally, but negative or non-significant in regions other than CEEECA and HI. In the case of the daily test, there was a positive correlation with the daily cases globally and the subgroup analysis by GBD regions. The stringency index was negatively correlated with the number of daily cases. Depending on the GBD regions, there was a negative correlation only in the HI region and a positive correlation in the other regions. Globally, vaccination per hundred was positively associated with daily deaths (Table III). Depending on the GBD regions, the tendency of the association of each variable differed slightly. CEEECA and HI regions had negative associations, whereas the rest of the regions had positive associations. For people fully vaccinated per hundred, it was non-significant only in CEEECA and was negatively associated with the global and other regions. In the case of daily tests, there was a positive association with daily deaths in the global and other GBD regions, except for SEAEAO. The stringency index was negatively associated with daily death in the HI region, but positively associated globally and in other GBD regions.
Table II
Fixed-effects model for the association between daily cases and vaccines, testing, and government control: subgroup analysis by GBD region
Table III
Fixed-effects model for the association between daily deaths and vaccines, testing, and government control: subgroup analysis by GBD region
Curve fitting analysis of government restriction policies on incidence and mortality rates
This study confirmed the regression line of the incidence and mortality of COVID-19 according to the government’s restrictive policy using a cubic spline curve (Figure 2). At the global level, the stringency index increased as the number of daily cases increased and then slowly decreased. In the GBD regions, the stringency index increased more rapidly in NAME, SA, and SEAEAO as the number of daily cases increased above a certain level. In the case of the HI region, the two factors had a negative relationship, and the level of daily cases (y-axis) was highest at the beginning of the stringency index (x-axis). The stringency index started to increase at a higher level when the daily cases were above a certain level. In the case of daily deaths, the stringency index rose rapidly as deaths began to occur globally and in SA and then gradually increased. The GBD regions confirmed that stringency increased more rapidly in NAME, SA, and SEAEAO, as daily deaths increased above a certain level. In the HI region, there was a gently negative regression line, and the level of daily deaths (y-axis) was highest at the beginning of the stringency index (x-axis).
Regional differences in COVID-19 mortality and incidence
CEEECA and HI regions had the highest mortality and incidence rates. Although CEEECA had fewer daily cases and tests than the HI region, it showed the highest mortality rate among the regions, indicating that the health crisis caused by COVID-19 was greater in CEEECA. As the incidence rate increases, the mortality rate also increases. Insufficient medical resources, such as beds and doctors, can increase mortality rates because COVID-19 cannot be treated in time [22]. In particular, the explosion of confirmed cases during the pandemic resulted in patients not being able to use medical care and hospital beds in time, resulting in an increase in mortality [23]. In the same context, daily cases were four times higher in the HI than the LAC region, but the mortality rate was similar. HI countries possess more resources, significantly higher healthcare expenditures, and superior healthcare systems compared to CEEECA and LAC regions. Despite representing only 16% of the world’s population, HI countries account for 78% of global healthcare spending [20]. The response and surveillance systems for diseases, including infectious diseases, are likely to function better in HI regions. These countries benefit from highly developed hospital facilities, more healthcare personnel, and the latest medical technologies, which favor disease surveillance and response [24, 25]. HI countries operate comprehensive and systematic disease surveillance systems, enabling rapid responses through real-time data monitoring and feedback [26]. In the CEEECA region, daily cases were approximately half those of the HI region, but the mortality rate was 1.6 times higher. It is inferred that this is because the medical system’s response to COVID-19 was successful in the HI region. Since the HI region had relatively abundant medical resources and well-established systems, it is inferred that treatment and care for COVID-19 patients would have been more appropriate. However, in the distribution of daily deaths per million using violin plots, the upper tail was long in HI and LAC, indicating that there was a point in time when the number of deaths exploded in this region. Additionally, the lower incidence and mortality rates in the SSA region, known to be the most vulnerable in terms of health status, might be due to actual difficulties in movement and lower population density (less urbanized environments). However, it is also highly likely that these rates were underreported [27, 28] due to weak disease surveillance systems and poor data completeness and consistency, resulting in inadequate data management and communication systems [29].
Global impact of vaccination and testing
The number of vaccinations and tests was the highest for the HI region. This could be because the HI region had economic resources to secure vaccines and testers and has a well-equipped medical system. In contrast, the distribution of vaccination rates increased in all regions. This implies that more than one dose of the vaccine is distributed across countries in all regions. However, even in the HI region, the tail was formed in a long downward direction. At the beginning of the pandemic, the supply of vaccines was absolutely insufficient, and there was a time when it was difficult to secure vaccines even in some HI countries owing to vaccine nationalism [30]. This is not just a problem in the HI region. Initially, concerns were raised about unequal access to vaccines between developed and developing countries during the early stages of the pandemic [31]. Moreover, there were instances where even developed countries faced insufficient vaccine availability, resulting in incomplete vaccination coverage. In some developed countries, vaccines were discarded owing to oversupply [32]. Subsequently, developing countries received vaccine supplies through the COVAX program facilitated by the WHO, UNICEF, and Gavi [33]. Consequently, this has led to an overall increase in global vaccination coverage.
Based on descriptive statistics and distribution graphs, SSA remained the laggard in vaccine distribution against COVID-19. The health system in the SSA region faces significant challenges and has historically been characterized by low levels of development and inadequate resources [34]. The Incidence and mortality from COVID-19 are among the lowest in the SSA region, but they are likely underestimated and underreported in this region [28]. However, since the number of deaths in these data is the case fatality ratio, there could be other reasons for the low mortality rate in SSA and SA regions. SSA and SA have significantly younger populations compared to regions such as Europe and North America. The median age in SSA is around 18.8 years, while it is higher in SA but still lower than in HI countries. Since COVID-19 tends to cause more severe illness and higher mortality in older individuals, the younger demographics in these regions may contribute to lower death rates [35, 36]. In Uganda, for example, less than 0.2% of the population is over 80 years old, compared to 4.4% in Canada [36]. Additional research is needed to clarify this.
Vaccination per hundred was negatively associated with daily cases, whereas full vaccination was positively associated. However, the direction of the association varies according to the GBD regions. Population-based studies in the United States have reported lower incidence and mortality rates in areas with high vaccination coverage [37, 38], but the effectiveness of vaccines is limited or altered owing to different cultures, medical systems, vaccination rates, and inadequate vaccine systems in developing countries [39]. In a previous study using a fixed-effects model, data up to November 2021, prior to the emergence of the Omicron variant, were analyzed for 111 countries with a subgroup analysis of HI and non-HI countries. The study found that vaccination and full vaccination coverage had a negative association with both incidence and mortality rates [40]. Therefore, the results could vary depending on the population and period covered by the study. In previous studies targeting some countries, it was reported that vaccines have a greater effect on reducing mortality than on reducing the number of confirmed cases [41]. However, in this study, vaccination per hundred people did not show a consistent trend in reducing mortality according to GBD regions. In the case of full vaccination, it was non-significant only in CEEECA, but showed a negative association with death in all regions. Speculation on this is beyond the scope of this study, but one possible inference is that CEEECA had the highest incidence and mortality rates, followed by HI countries. In contrast, the vaccination and full vaccination coverage are the lowest, except for SSA. The efficacy of vaccines in preventing and overcoming COVID-19 has already been verified [4]. Hesitancy to get vaccinated due to side effects, the emergence of variants, the duration of immunity provided by the vaccine, the number of doses required, booster shots, and the proportion of the population that needs to be vaccinated can all impact herd immunity and reduce the effectiveness of policy measures [42]. Therefore, achieving herd immunity through appropriate programs is crucial for community and population effectiveness, and continued evidence-based academic research is necessary to develop effective vaccination program strategies. This suggests that among the regions, except for SSA and CEEECA, it is possible that the population is the least equipped to achieve herd immunity. Consequently, it is difficult to assess whether vaccine deployment during the pandemic has reduced the spread of COVID-19 from a global perspective. However, this suggests that full vaccination is effective in reducing deaths worldwide from COVID-19.
Antibody persistence decreased over time after vaccination [43]. It is difficult to achieve sufficient effects with only one vaccination; thus, continuous (or fully vaccinated) vaccination is required to maintain antibodies against SARS-CoV2 [44]. Additionally, booster shots are effective in prevention and severity [3], and booster shot programs have been implemented in several countries during the pandemic [45]. In this study, when booster shots were added as a variable, there were many missing values, making it impossible to analyze during the pandemic at the global level. Therefore, additional studies regarding the global effectiveness of booster shots are required.
The number of tests performed is positively associated with the number of confirmed cases and deaths. This is because the possibility of finding more confirmed cases increases when more tests are conducted, which is also consistent with previous studies [46]. However, an increase in the number of tests does not necessarily lead to an increase in the number of confirmed cases or mortality. Strengthening testing policies was not associated with mortality [47]. However, in a study, testing coverage (tests per confirmed case) rather than population testing number (tests per million people) has been suggested as a better index, and the former was an effective indicator of adequate testing and correlated with a reduced case fatality rate [48].
Public restriction policy
Are increased government restrictions such as lockdowns related to COVID-19 incidence and mortality? In this study, only the HI region showed a negative association with the government’s response to COVID-19 and incidence and mortality rates. These findings suggest that the government’s control policies for COVID-19 might only have been effective in the HI region. Here, the focus is on the characteristics of HI policy responses to COVID-19. According to the violin plots, there were no significant differences in the density distribution of the stringency indices. However, according to the cubic curve, in the HI region stringency was controlled at a high level from the beginning, when confirmed cases were above a certain level. For example, it is not a gradual restriction when the number of confirmed cases first occurs but a high-intensity policy, such as a lockdown, as soon as the number of confirmed cases exceeds a certain level. Consequently, at the time of living with COVID-19 for a long period, these findings suggest that rather than gradually strengthening the restriction policy according to the spread of the epidemic, high-intensity restrictions at some points were more effective in preventing the spread of COVID-19. Spiliopoulos et al. reported that there is an effect of preventing the spread of COVID-19 when the government’s restriction is implemented above a certain level of spread, supporting the current claims [11]. Therefore, in the future, when a new infectious disease first emerges and progresses to a pandemic, it will be more effective to respond strongly at a certain point, rather than gradually increasing control policies according to the spread.
Limitations
This study had some limitations. First, the correlations between variables could change depending on the duration of the study. For example, the results could differ for the early and late stages of the pandemic or before and after the emergence of new virus variants. Delta and omicron variant emerged in October 2020 and November 2021, respectively. These mutants evolved to be more transmissible and prone to immune escape, resulting in impacts on the effectiveness of the COVID-19 vaccine and protection against re-infection [49]. Second, some variables that could have affected the dependent variable were not considered. There were many missing values for booster shots and number of intensive care beds. Additionally, smoking rates [50] and population density [51] could influence the outcomes. However, considering the results of previous studies and the T, B, and p-values of this study, it is highly likely that the direction of the overall results will be maintained. Our panel analysis study focused on using ‘day’ as the unit of analysis, which led to the exclusion of these variables from our model since the variables were constructed on a yearly basis. If smoking rates and population density are the main areas of interest, alternative models should be explored. Nevertheless, if there is additional research on the missing variables, it could serve as valuable evidence for establishing prevention strategies in response to the emergence of future infectious diseases. Finally, while longitudinal studies are more powerful than cross-sectional studies in detecting changes over time, they cannot clearly explain causality due to potential confounding variables and changes in external conditions. Despite these limitations, this study is valuable and significant, as it is one of the first to evaluate vaccines and government policy responses during the pandemic in GBD regions worldwide. Future research should address these limitations by incorporating a broader range of variables and considering the temporal dynamics of the pandemic.
In conclusion, in the HI region, daily cases were four times higher than those in the LAC region, but the mortality rates were similar. In the CEEECA region, daily cases were approximately half of those in the HI region, but the mortality rate was 1.6 times higher. The number of people vaccinated per hundred did not consistently reduce mortality across all GBD regions. However, full vaccination was associated with decreased mortality in all regions except CEEECA. This suggests that the policy of fully vaccinating people effectively reduced deaths from COVID-19 worldwide. Considering the results of this study and previous research, it is emphasized that a critical task in preventing and overcoming infectious diseases is to ensure sufficient vaccination coverage to maintain herd immunity. This involves addressing vaccine hesitancy, overcoming the fear of side effects, and minimizing the number of people reluctant to get vaccinated, especially in the face of vaccine variants.
Additionally, only the HI region showed a negative association between the government’s response to COVID-19 and incidence and mortality rates. This suggests that the government’s control policies for COVID-19 were effective only in the HI region. Therefore, if a pandemic crisis arises again in the future, international cooperation to overcome infectious diseases must be further strengthened. We learned a lesson from the COVID-19 pandemic that a health problem is not a national or regionally restricted issue, and it can be overcome with multidimensional and global efforts. Our study results revealed differences of GBD regions in the response to the COVID-19 crisis and its effectiveness, thus making it possible to broaden our sense of a global perspective in public health.