Introduction
Coronary artery calcification (CAC) is widely recognized as a crucial biomarker for diagnosing coronary artery disease (CAD) [1]. Cardiovascular diseases (CVD), associated with a range of modifiable and non-modifiable risk factors, are the leading cause of morbidity and mortality worldwide, exerting a significant impact on society and generating high economic costs [2].
CAC involves the deposition of calcium in coronary arteries during atherosclerotic plaque formation, leading to narrowing and reduced vessel elasticity. The presence and extent of CAC are closely associated with the predicted incidence of cardiovascular events such as myocardial infarction and strokes [3, 4]. Furthermore, CAC = 0 (the so-called ‘power of zero’) is also associated with a reduced risk of chronic diseases other than CVD, such as cancer, chronic obstructive pulmonary disease, and chronic kidney disease [1, 5, 6]. CAC likely serves as a risk integrator, indicating lifelong exposure to common risk factors for both CVD and non-CVD conditions [6]. CAC can be assessed using computed tomography (CT), with results typically reported using the Agatston score [5]. This value accounts for the volume and density of CAC [7]. Clinically, CAC assessment is easy to perform and interpret, widely accessible, and safe for patients, primarily because it does not require contrast administration [4].
Risk factors associated with CAC are largely consistent with those for atherosclerotic CVD (ASCVD), including both modifiable and non-modifiable factors. The most important modifiable factors include smoking, hypertension (HTN), hypercholesterolemia (including lipoprotein(a)), diabetes, and obesity [8–11]. Non-modifiable factors include age, sex, and genetic predisposition. Men, regardless of age, have higher average CAC scores compared to women. Higher CAC scores are also observed in older individuals [11, 12]. Moreover, studies indicate significant racial differences in the prevalence of arterial calcification, with higher CAC scores in Caucasians compared to African Americans and Asians [11].
Telomeres, located at the ends of chromosomes, play a crucial role in protecting genetic material from damage. With age, telomeres gradually shorten, serving as a marker of cellular biological aging. Telomere shortening is associated with numerous risk factors and chronic diseases, including CVD [13, 14]. Research suggests that telomere length (TL) may serve as a biomarker for CVD risk [15–17].
Epigenetic mechanisms, such as DNA methylation and histone modification, regulate gene expression without altering DNA sequence. These modifications are dynamic and have emerged as sensitive biomarkers of biological aging. In particular, epigenetic clocks based on methylation patterns at CpG sites have demonstrated high accuracy in estimating biological age [18].
Clinical and genetic epidemiological research continues to explore the link between biological aging and both oral and systemic health. Individuals with periodontitis often exhibit signs of accelerated aging, as measured by composite indices such as phenotypic age (PhenoAge) and Klemera-Doubal method-based biological age (KDM-Age). This accelerated aging appears to mediate a substantial portion of the increased cardiovascular risk observed in individuals with poor dental health [19, 20].
This study aims to assess whether TL, epigenetic aging markers, and dental deterioration traits are causally related to the presence of CAC and, consequently, to determine whether CAC can be used as a marker of biological aging rather than merely a marker of atherosclerotic processes.
Material and methods
Study design
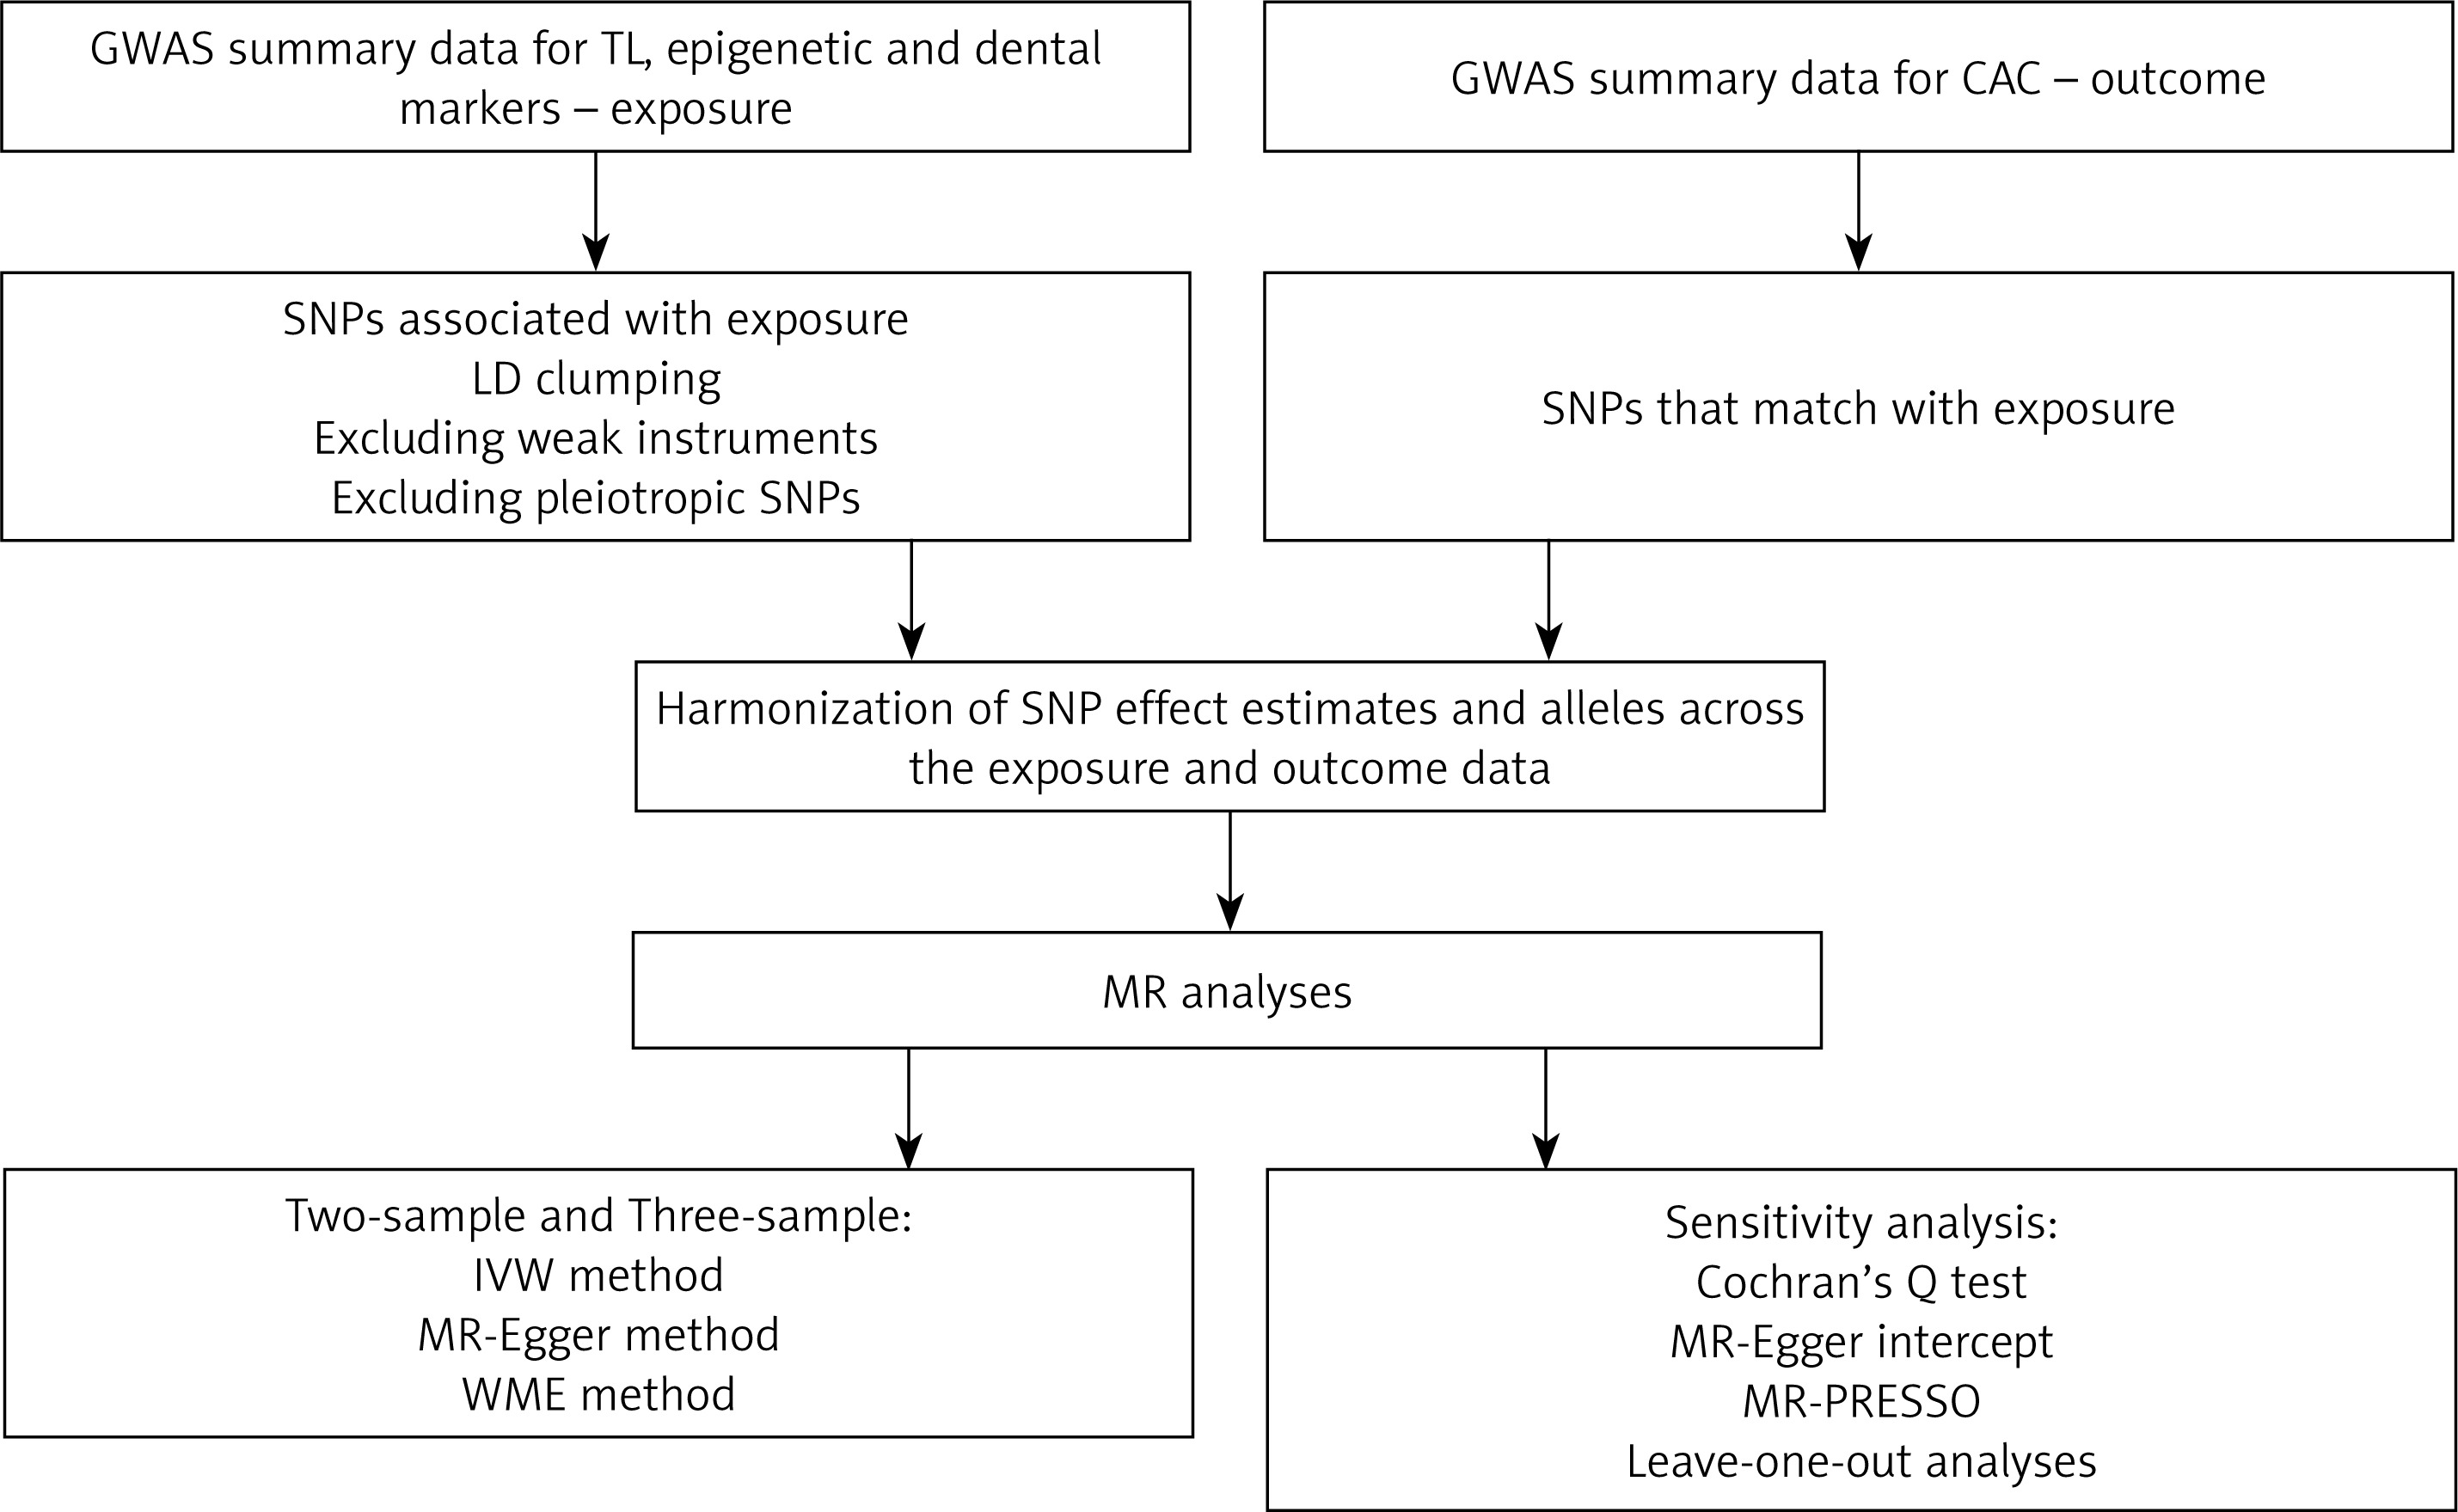
In this study, we used Mendelian randomization (MR) to assess the impact of TL and other aging-related traits (exposures) on CAC (outcome). The study’s flowchart is presented in Figure 1.
Figure 1
Study workflow
CAC – coronary artery calcification, GWAS – genome-wide association study, IVW – inverse-variance weighted, LD – linkage disequilibrium, MR – Mendelian randomization, MR-PRESSO – Mendelian Randomization Pleiotropy RESidual Sum and Outlier, SNPs – single-nucleotide polymorphisms, TL – telomere length, WME – weighted median estimator.
Publicly available data were used, so no ethical approval or informed consent was required for this study [21]. This study adhered to the Strengthening the Reporting of Observational Studies in Epidemiology (STROBE) guidelines, which were primarily designed for MR studies (STROBE-MR) [22].
Exposure data
Telomere length
Data on the genetic determinants of TL were obtained from the UK Biobank analysis by Codd et al. [23]. Access to the Genome-Wide Association Study (GWAS) summary statistics was obtained through the OpenGWAS project developed at the MRC Integrative Epidemiology Unit (IEU) under accession code “ieu-b-4879” [24]. These data were obtained from a sample of 472,174 patients of European ancestry. Another set of single-nucleotide polymorphisms (SNPs) correlated with TL was obtained from a GWAS meta-analysis encompassing 78,592 patients of European ancestry, published by Li et al., and used for three-sample MR [25].
Epigenetic markers
Summary statistics for correlations between SNPs and two epigenetic markers of aging – intrinsic epigenetic age acceleration (IEAA) and PhenoAge – were obtained from GWAS published by McCartney et al. and were obtained through the OpenGWAS project under accession codes “ebi-a-GCST90014290” and “ebi-a-GCST90014292” [24, 26]. These data were obtained from multiple cohorts totaling 34,710 participants of European ancestry.
Both IEAA and PhenoAge represent specific methylation patterns that change over the course of a lifetime. IEAA was constructed by studying publicly available data of various tissue samples and developed to predict the biological age of a given tissue sample [27]. PhenoAge is a composite marker of DNA methylation consisting of individual methylation patterns associated with albumin levels, creatinine, C-reactive protein, lymphocyte percent, mean cell volume, red cell distribution width, alkaline phosphatase, white blood cell count, and age. Importantly, the weights for each pattern were set using Cox regression to accurately reflect the risk of death [28].
Dental markers
As dental markers of teeth loss and periodontal disease, we used: bleeding gums, denture use, and the presence of loose teeth. Summary statistics computed by Neale et al. were obtained from the UK Biobank and accessed through the OpenGWAS project under accession codes “ukb-a-430”, “ukb-a-433”, and “ukb-a-431” [24, 29]. These data were derived from 336,138 individuals of European ancestry.
Outcome data
Data on the outcome, CAC, were obtained from a meta-analysis by Kavousi et al. [30, 31]. We have utilized summary statistics from 28,655 individuals of European ancestry across 14 studies.
Selection of instrumental variables
Valid instrumental variables (IVs) in MR must satisfy three core assumptions: relevance, independence/exchangeability, and exclusion restriction [32]. We have only used SNPs with a genome-wide significance (p < 5 × 10⁻⁸) unless otherwise specified. SNPs in linkage disequilibrium (LD; r2 < 0.001) within a clumping distance of 10,000 kb were excluded. For each instrumental variable (IV), the proportion of variance explained (R2) was computed using the formula: R2 = 2 × β2 × EAF × (1 – EAF), where EAF represents the effect allele frequency, and β denotes the estimated effect size. The F-statistic was calculated as F = (β/SE)2, where β is the SNP’s association with the exposure, and SE is its standard error [32]. SNPs with F-statistics less than 10 were classified as weak instruments and were excluded from further analysis [33]. SNPs correlated with metabolic, anthropometric, pulmonary, cardiac, and immunological parameters were excluded to avoid potential pleiotropy. SNPs associated with hematologic and oncological outcomes were not excluded because blood morphological parameters are inherently linked with aging, and neoplasms are characterized by altered cell aging and telomerase activity [27, 28, 34]. Correlations were searched through the NHGRI-EBI GWAS Catalog [35].
Statistical analysis
A standard two-sample MR approach was utilized in this study with minor exceptions. Variants were harmonized between the exposure and outcome datasets. If the selected SNPs were unavailable in the outcome dataset, they were replaced with proxy SNPs with an LD of r2 > 0.8 or excluded from further MR analysis. The analysis utilized three commonly used MR methods: the inverse-variance weighted (IVW) approach with random effects, MR-Egger regression, and the weighted median estimator (WME). Sensitivity analyses were performed using the following methods. The MR Pleiotropy RESidual Sum and Outlier (MR-PRESSO) method was used to identify and correct for outlier variants that may be driving pleiotropy. The presence of horizontal pleiotropy was detected using the MR-Egger intercept test. The Cochran’s Q statistic was used to measure heterogeneity between variant-specific causal estimates. Finally, leave-one-out analyses were performed to determine the possible effect of individual SNPs on the causal estimates [32].
As an additional analysis, we used a three-sample method to estimate the effect of TL on CAC. We selected genome-wide significant (p < 5 × 10⁻⁸) non-pleiotropic variants with clear functions in TL maintenance from the set reported by Li et al. [25]. The ‘β’ and ‘SE’ for the associations between these SNPs and TL were obtained from Codd et al. analysis of data in the UK Biobank [23].
Statistical analyses were performed with R software (version 4.1.1) using “TwoSampleMR” (version 0.5.6) and the “MR-PRESSO” package (version 1.0) [36–38].
Results
The impact of TL on CAC
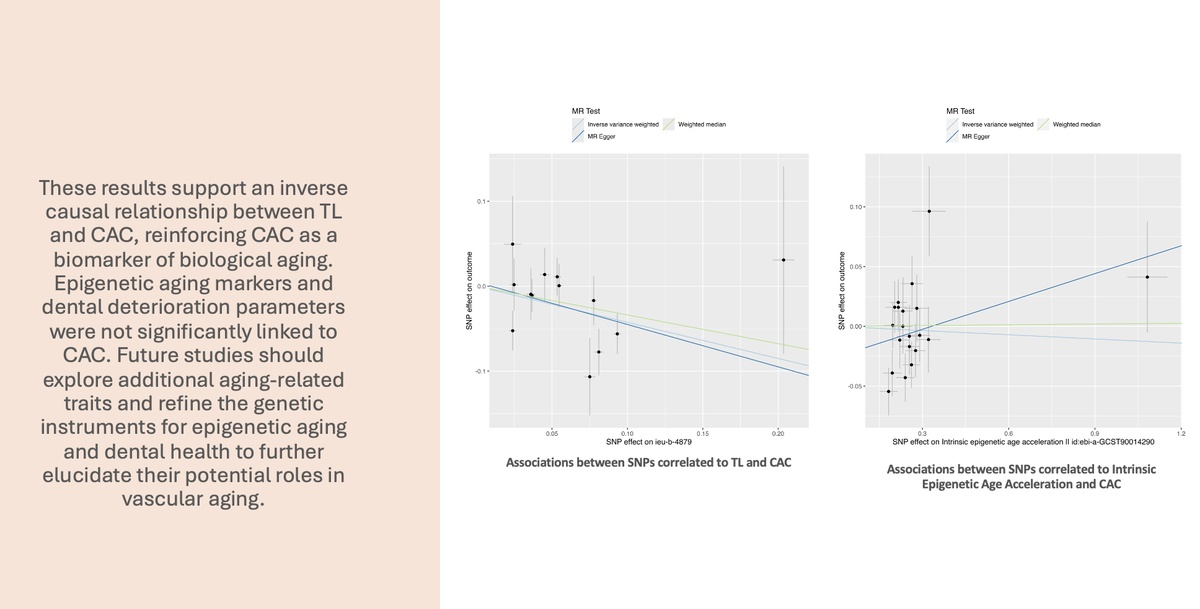
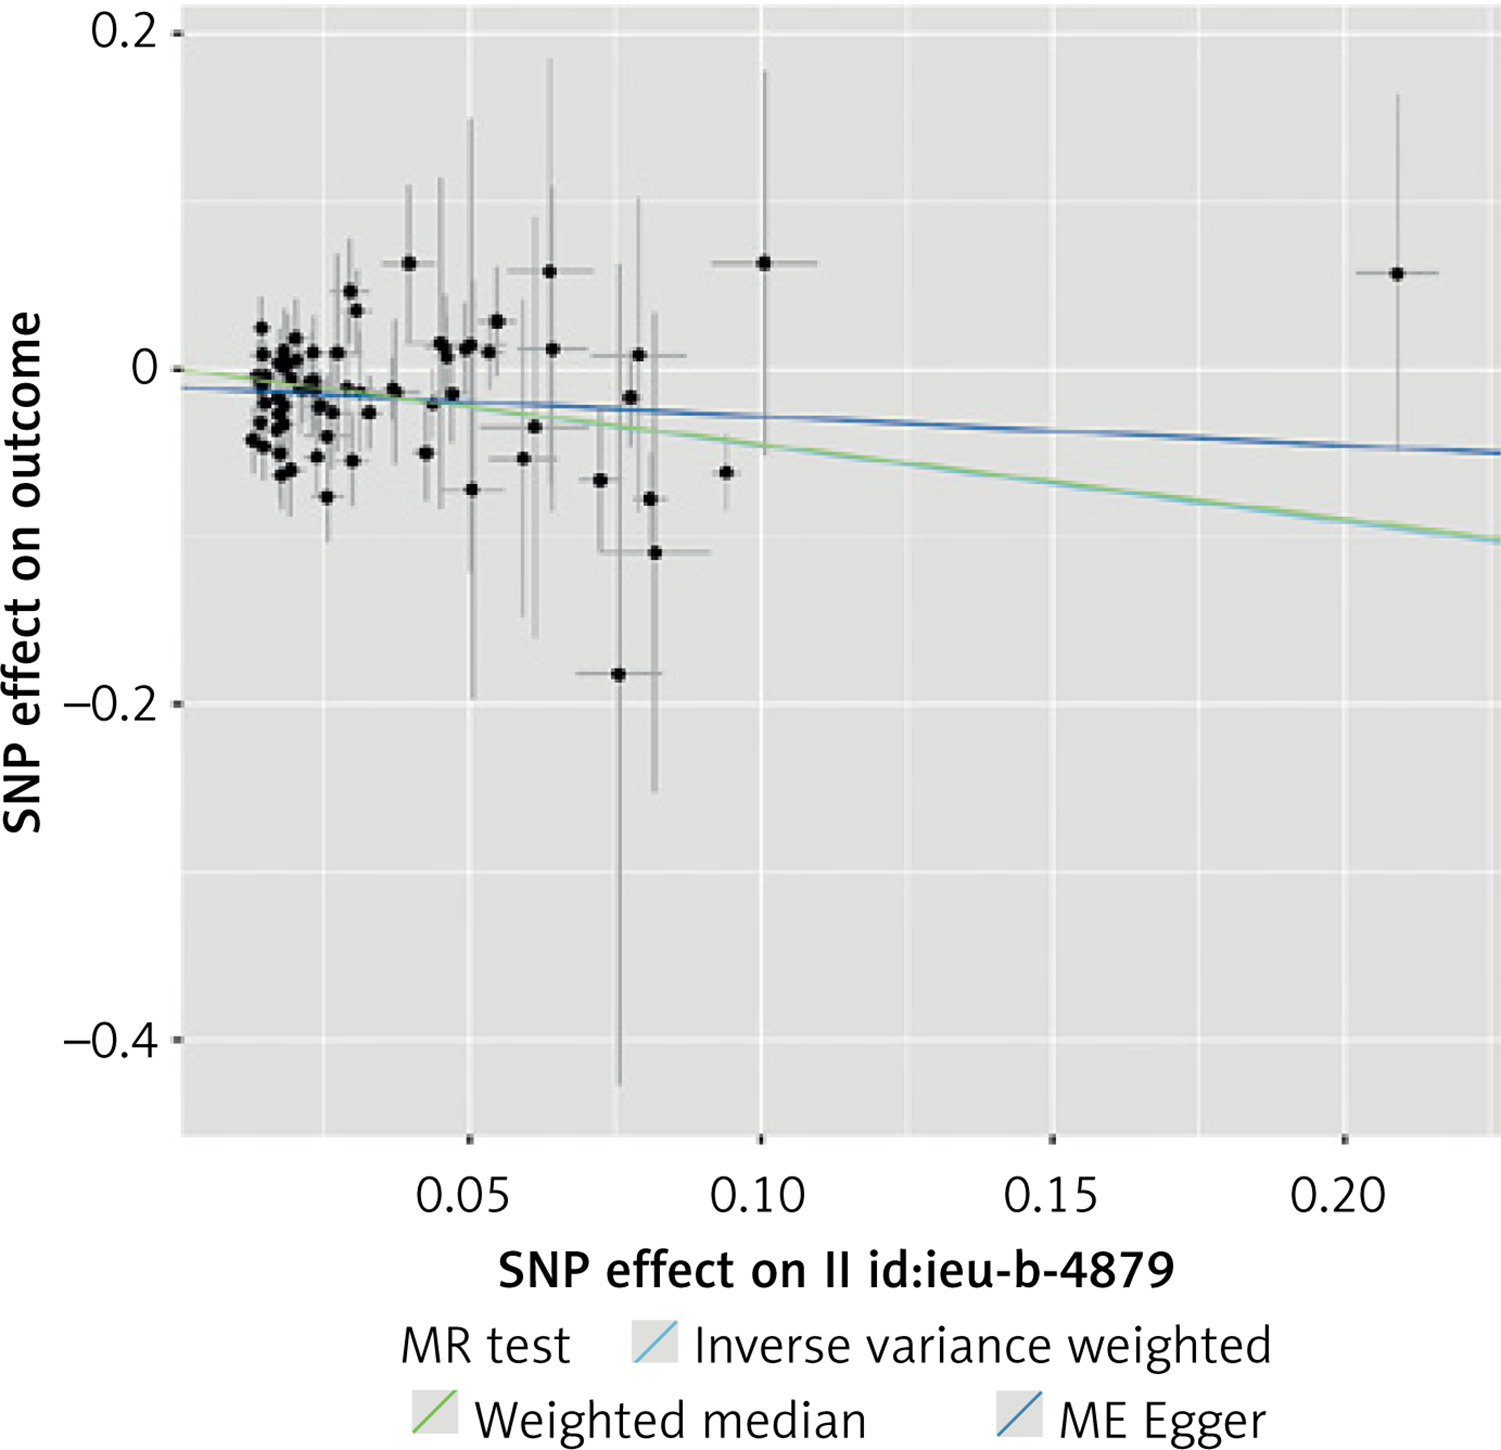
A total of 101 SNPs initially matched the inclusion criteria and were included in the initial analysis as IVs. A total of 52 SNPs were not included in the analysis: 25 were excluded due to associations with known or suspected confounders of CAC, 25 were unavailable in the outcome dataset, and 2 were excluded because they were palindromic. We have found that a genetically determined increase in TL is associated with a decrease in CAC. Despite statistically significant results in this analysis (IVW, WME p < 0.001), a significant degree of horizontal pleiotropy was detected with the MR-Egger intercept test (p = 0.01). As a result, the analysis was repeated with a genome-wide significance threshold of p < 5 × 10⁻¹⁰. The results of this initial analysis are presented in Supplementary Tables SI–SIII and Supplementary Figures S1, S2.
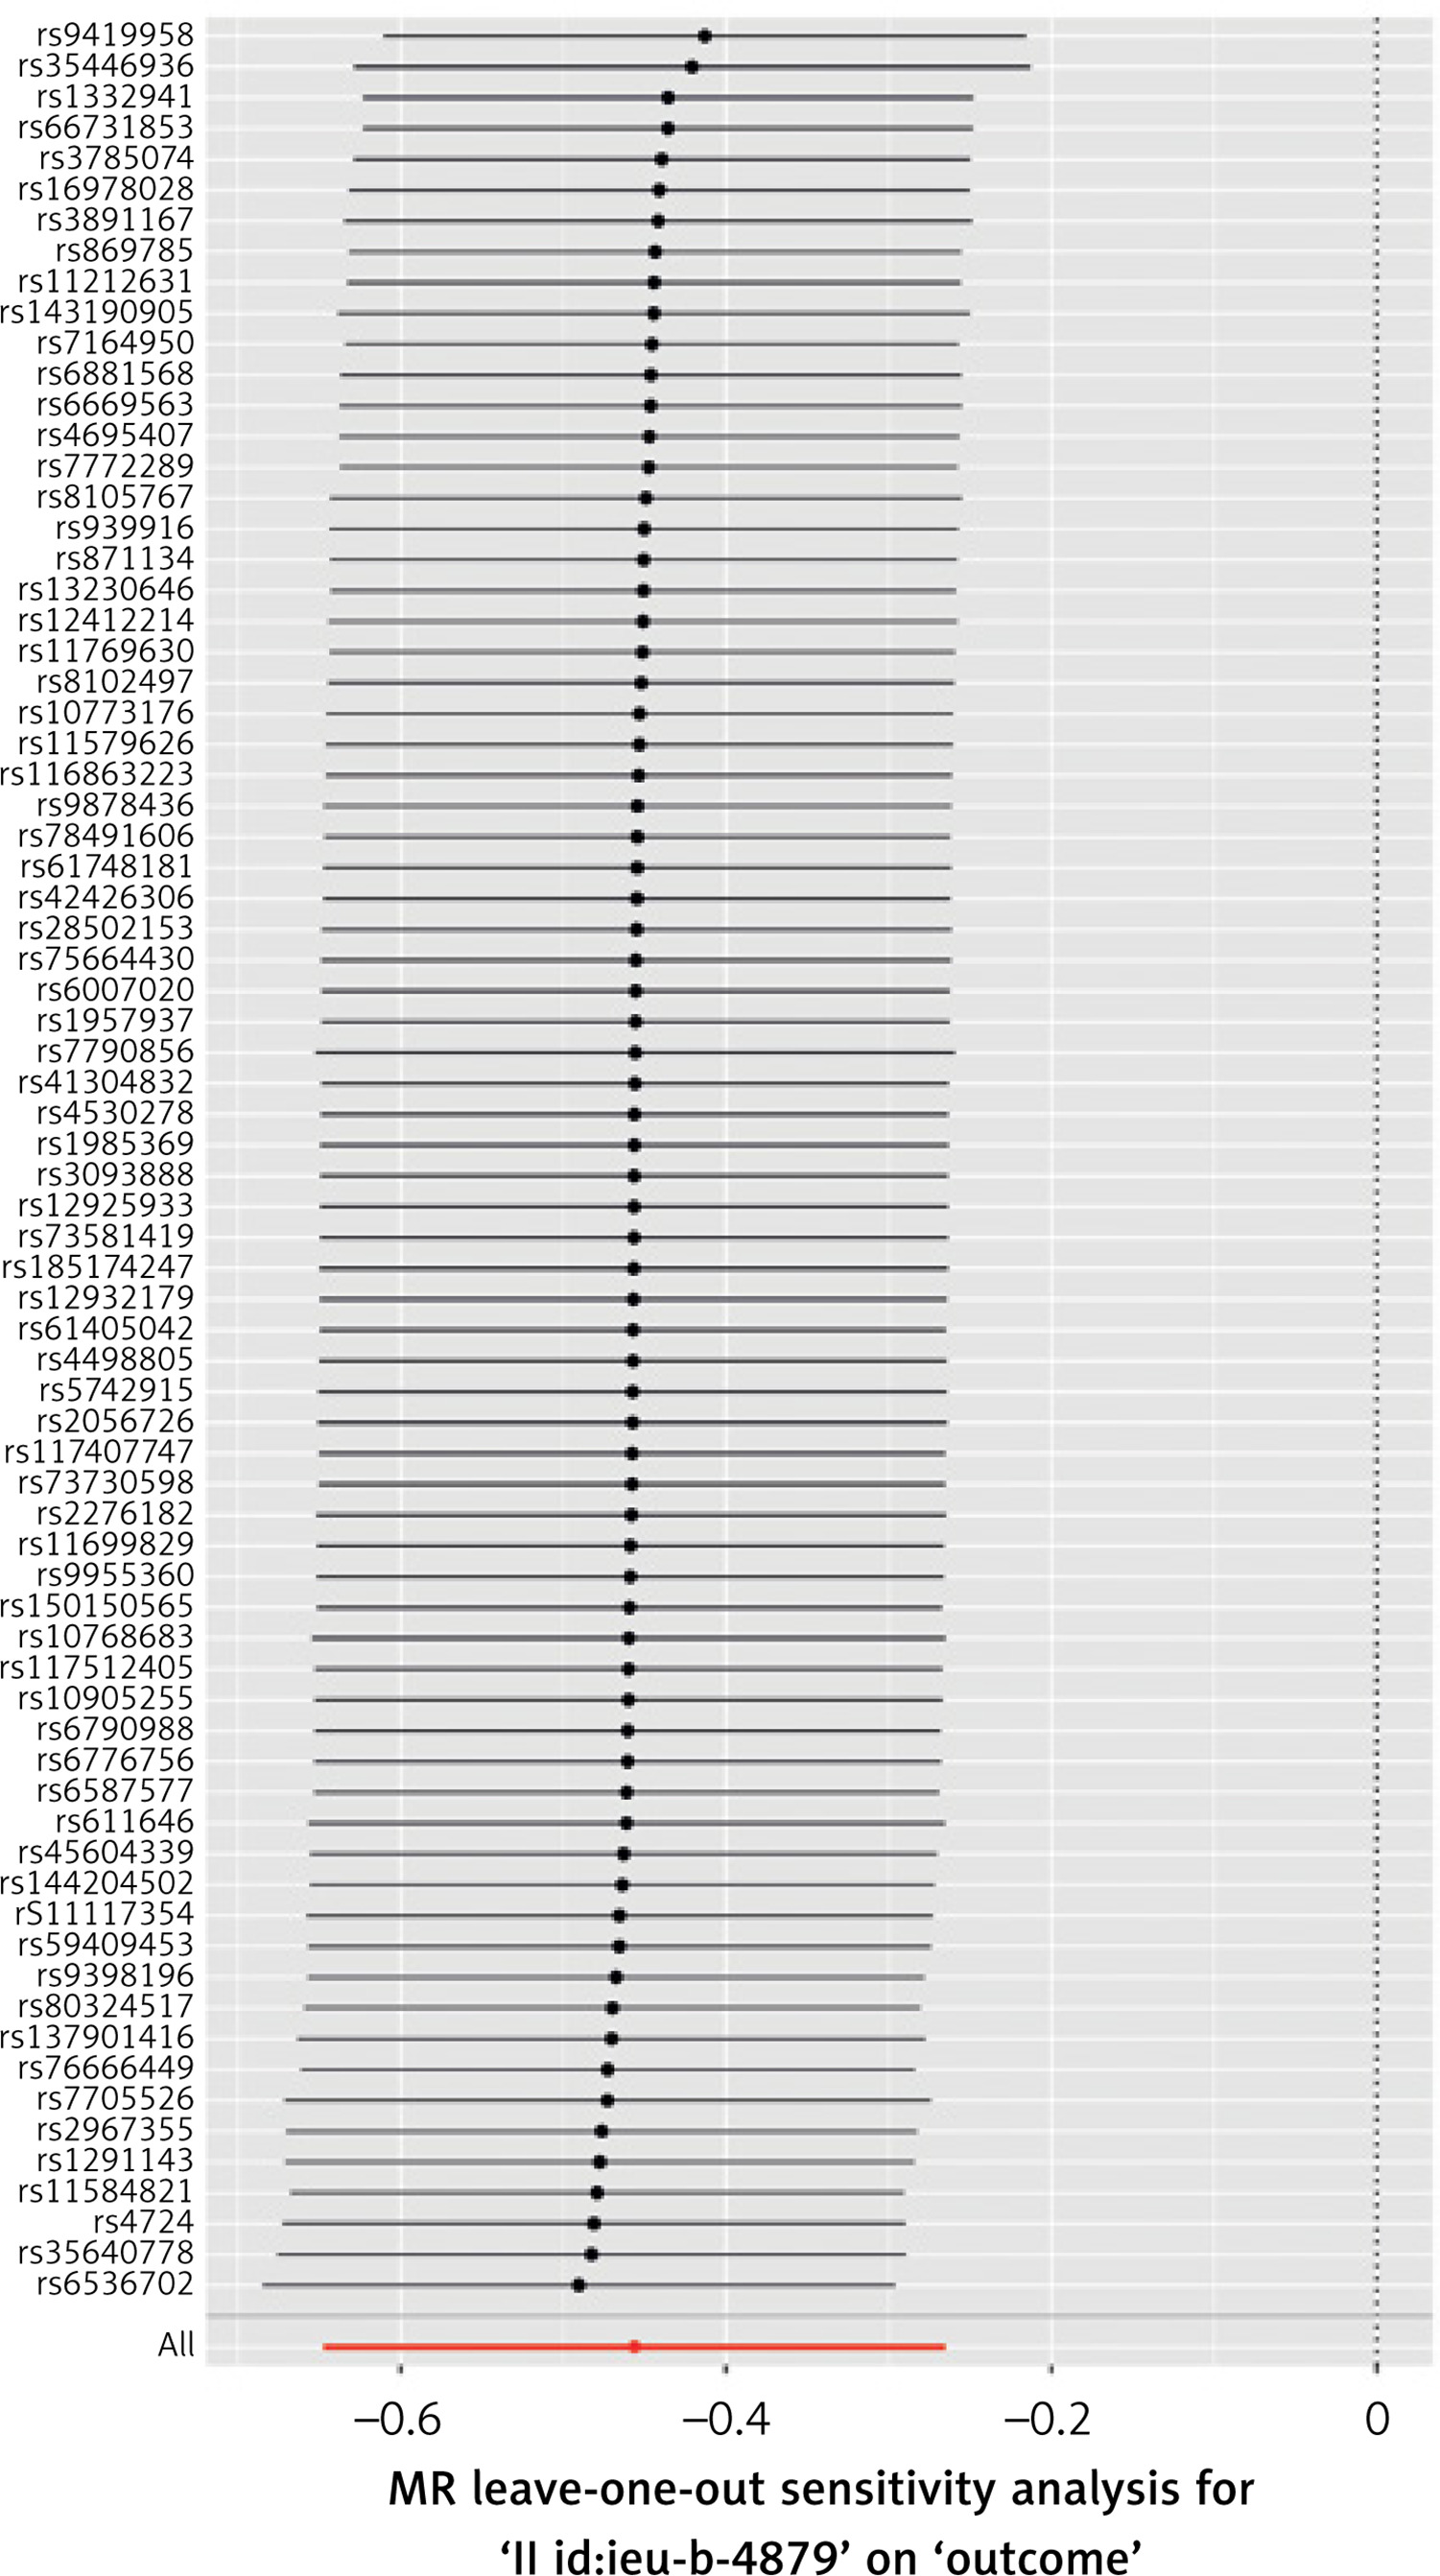
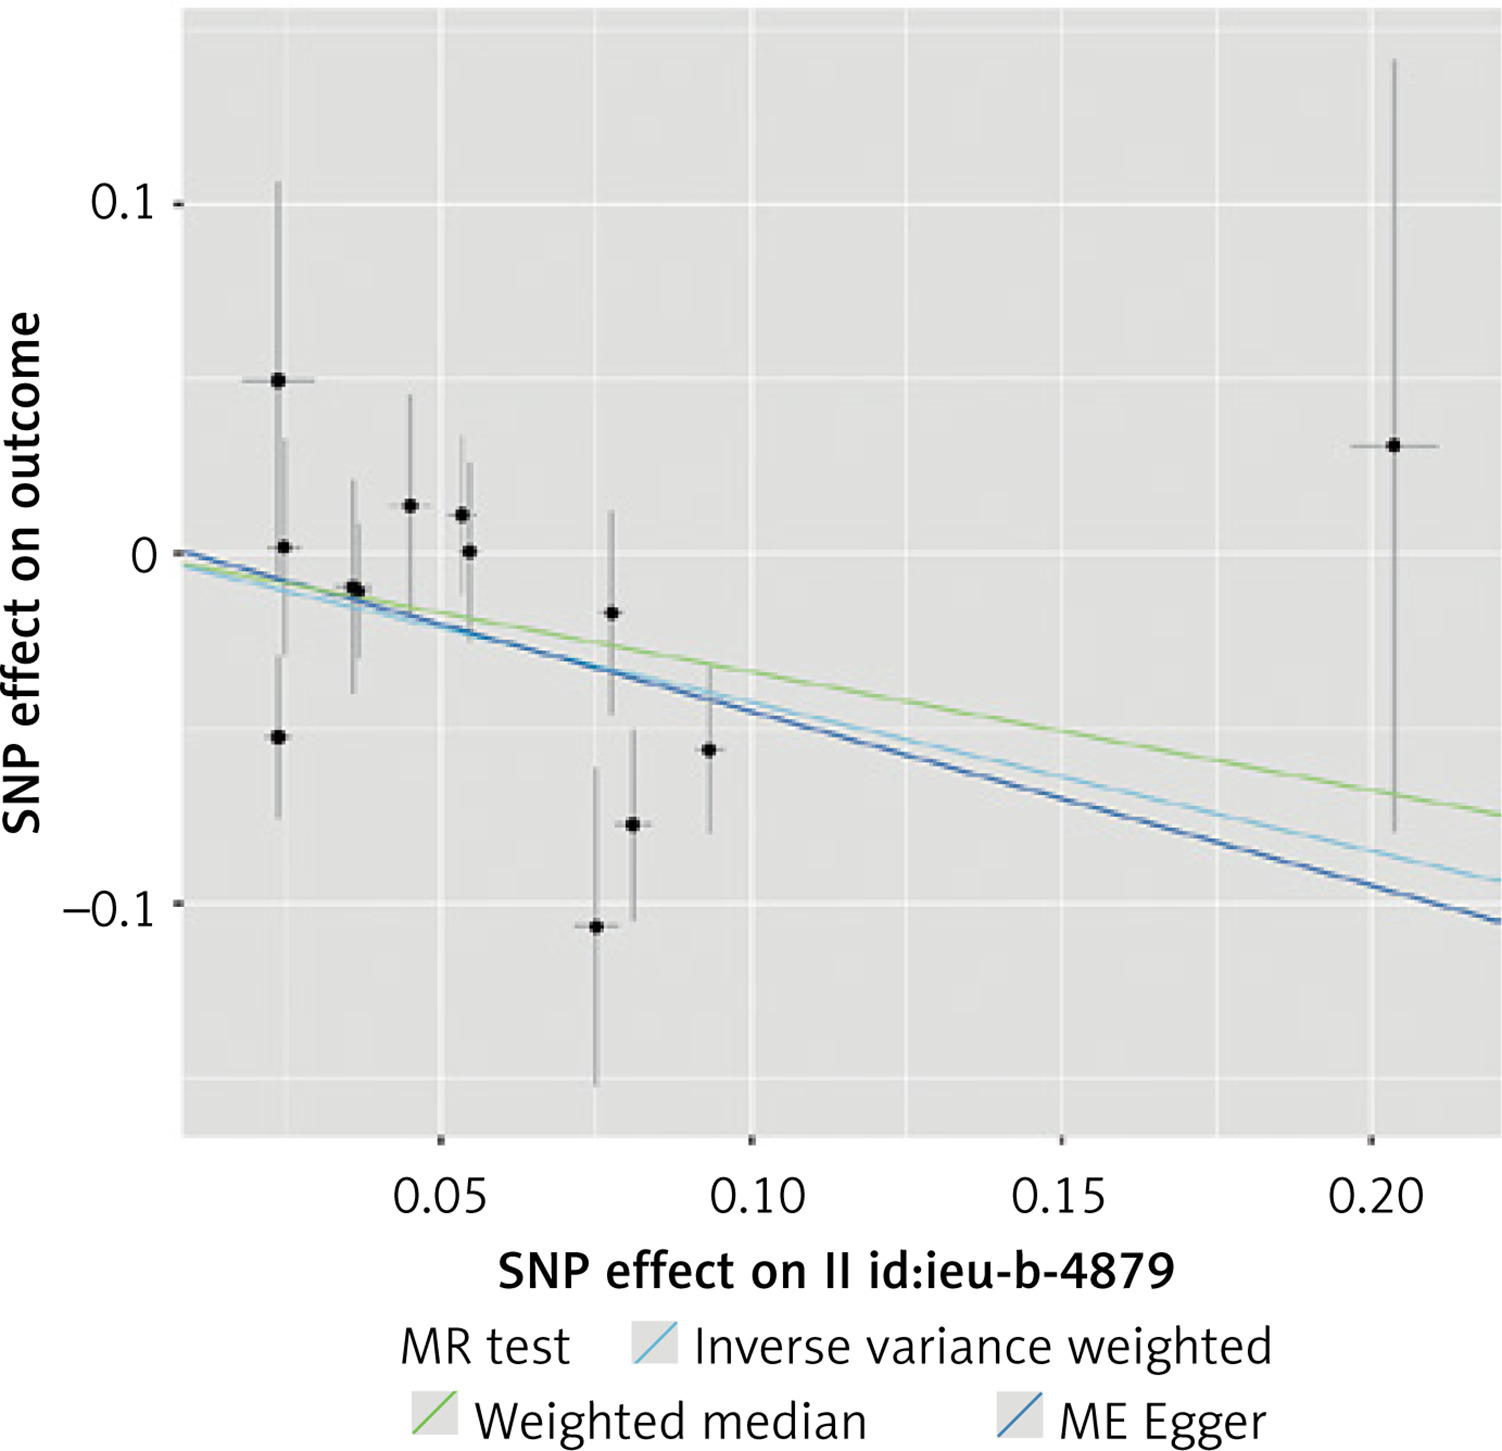
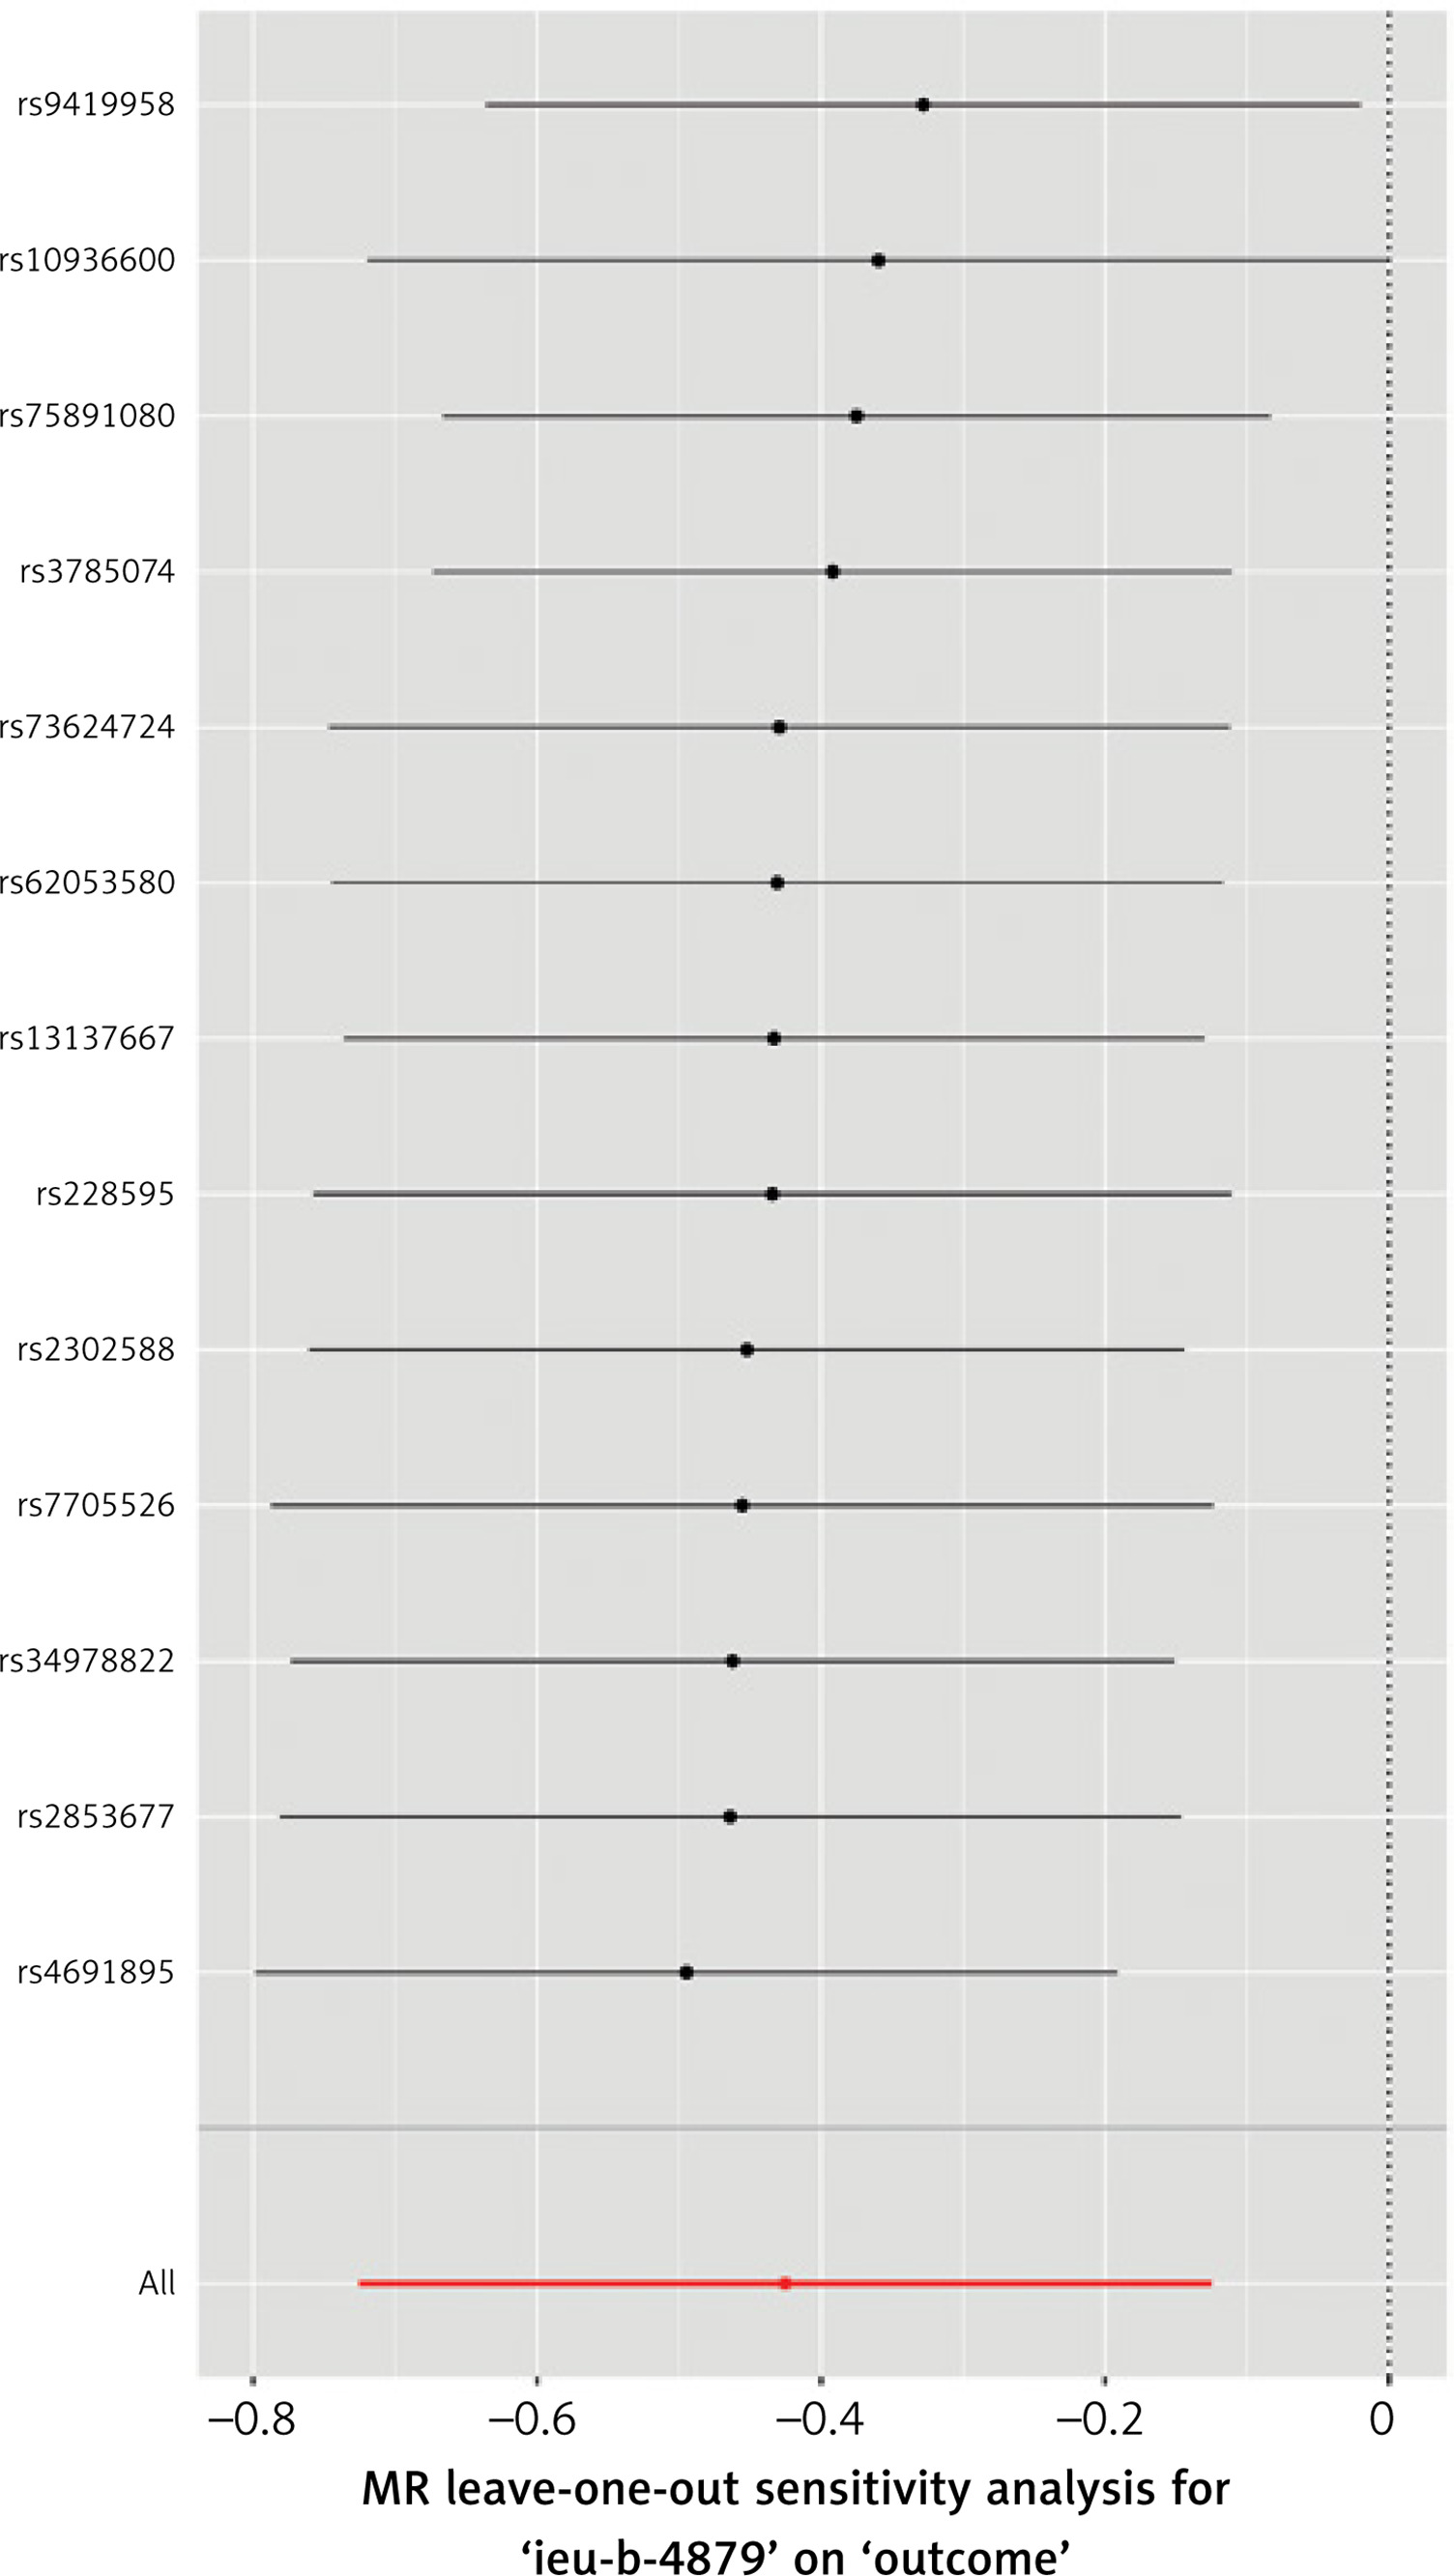
Using this stricter inclusion criterion, 74 SNPs were included in a stringent analysis. The analysis showed that the association between TL and CAC remained statistically significant and that the increased TL indeed appeared to protect against calcium deposition in coronary arteries (IVW p < 0.001, MR-Egger p = 0.03, WME p = 0.004). No statistically significant horizontal pleiotropy and no heterogeneity (MR-Egger intercept test, Cochran’s Q test p > 0.05) was detected. No single variant influenced the result appreciably, as demonstrated by leave-one-out analysis. The results of this analysis are presented in Tables I, II and Figures 2, 3.
Table I
Mendelian randomization between TL and CAC (stringent analysis)
| Exposure | Method | nSNP | β | SE | P-value |
|---|---|---|---|---|---|
| TL | IVW | 74 | –0.46 | 0.01 | < 0.001 |
| MR-Egger | 74 | –0.17 | 0.17 | 0.03 | |
| WME | 74 | –0.45 | 0.15 | 0.004 |
Table II
Sensitivity analyses of the Mendelian randomization on TL and CAC (stringent analysis)
| Exposure | Cochran’s Q IVW | Cochran’s Q MR Egger | MR Egger | MR-PRESSO | ||||
|---|---|---|---|---|---|---|---|---|
| Value | P-value | Value | P-value | intercept | P-value | outliers | Global P test | |
| TL | 76.41 | 0.37 | 72.54 | 0.46 | –0.011 | 0.054 | – | 0.36 |
A three-sample MR analysis was also carried out. The most significant SNPs associated with TL were identified by Li et al. [25]. A total of 13 SNPs were included in the analysis (Supplementary Table SIV). Using the new IVs set, we also found that TL was causally associated with CAC. IVW yielded a statistically significant result (p < 0.01), while MR-Egger (p = 0.21) and WME (p = 0.07) produced consistent but non-significant estimates. In the sensitivity analyses, no statistically significant heterogeneity was detected (Cochran’s Q test p > 0.05), and we did not detect significant horizontal pleiotropy. The results of the three-sample MR analyses are presented in Tables III, IV and Figures 4, 5.
Table III
Mendelian randomization between TL and CAC (three-sample)
| Exposure | Method | nSNP | β | SE | P-value |
|---|---|---|---|---|---|
| TL | IVW | 13 | –0.43 | 0.15 | 0.006 |
| MR-Egger | 13 | –0.50 | 0.37 | 0.21 | |
| WME | 13 | –0.34 | 0.19 | 0.07 |
Table IV
Sensitivity analyses of Mendelian randomization on TL and CAC (three-sample)
| Exposure | Cochran’s Q IVW | Cochran’s QMR Egger | MR Egger | MR-PRESSO | ||||
|---|---|---|---|---|---|---|---|---|
| Value | P-value | Value | P-value | Intercept | P-value | Outliers | Global P test | |
| TL | 15.91 | 0.20 | 15.84 | 0.15 | 0.005 | 0.83 | – | 0.22 |
The impact of epigenetic proxies of aging on CAC
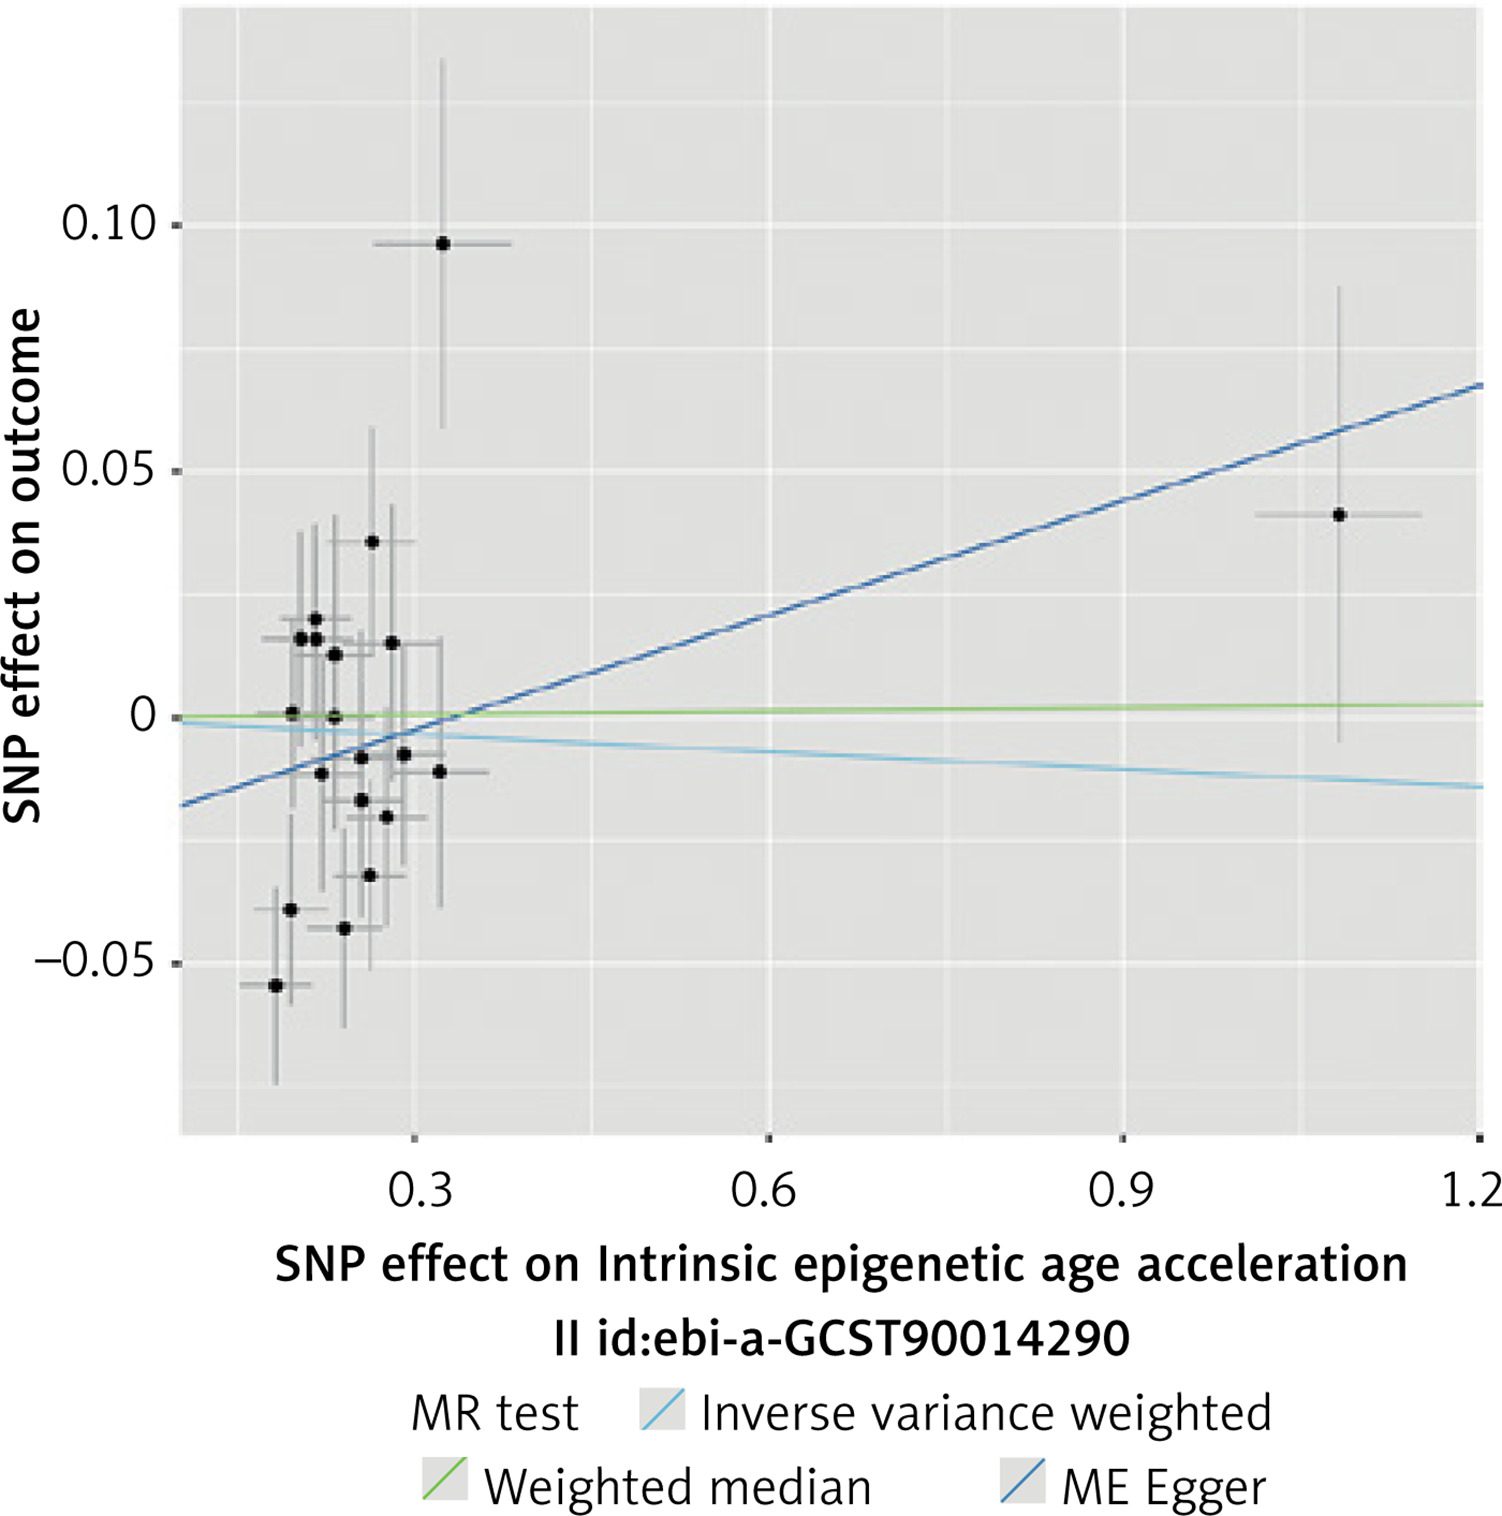
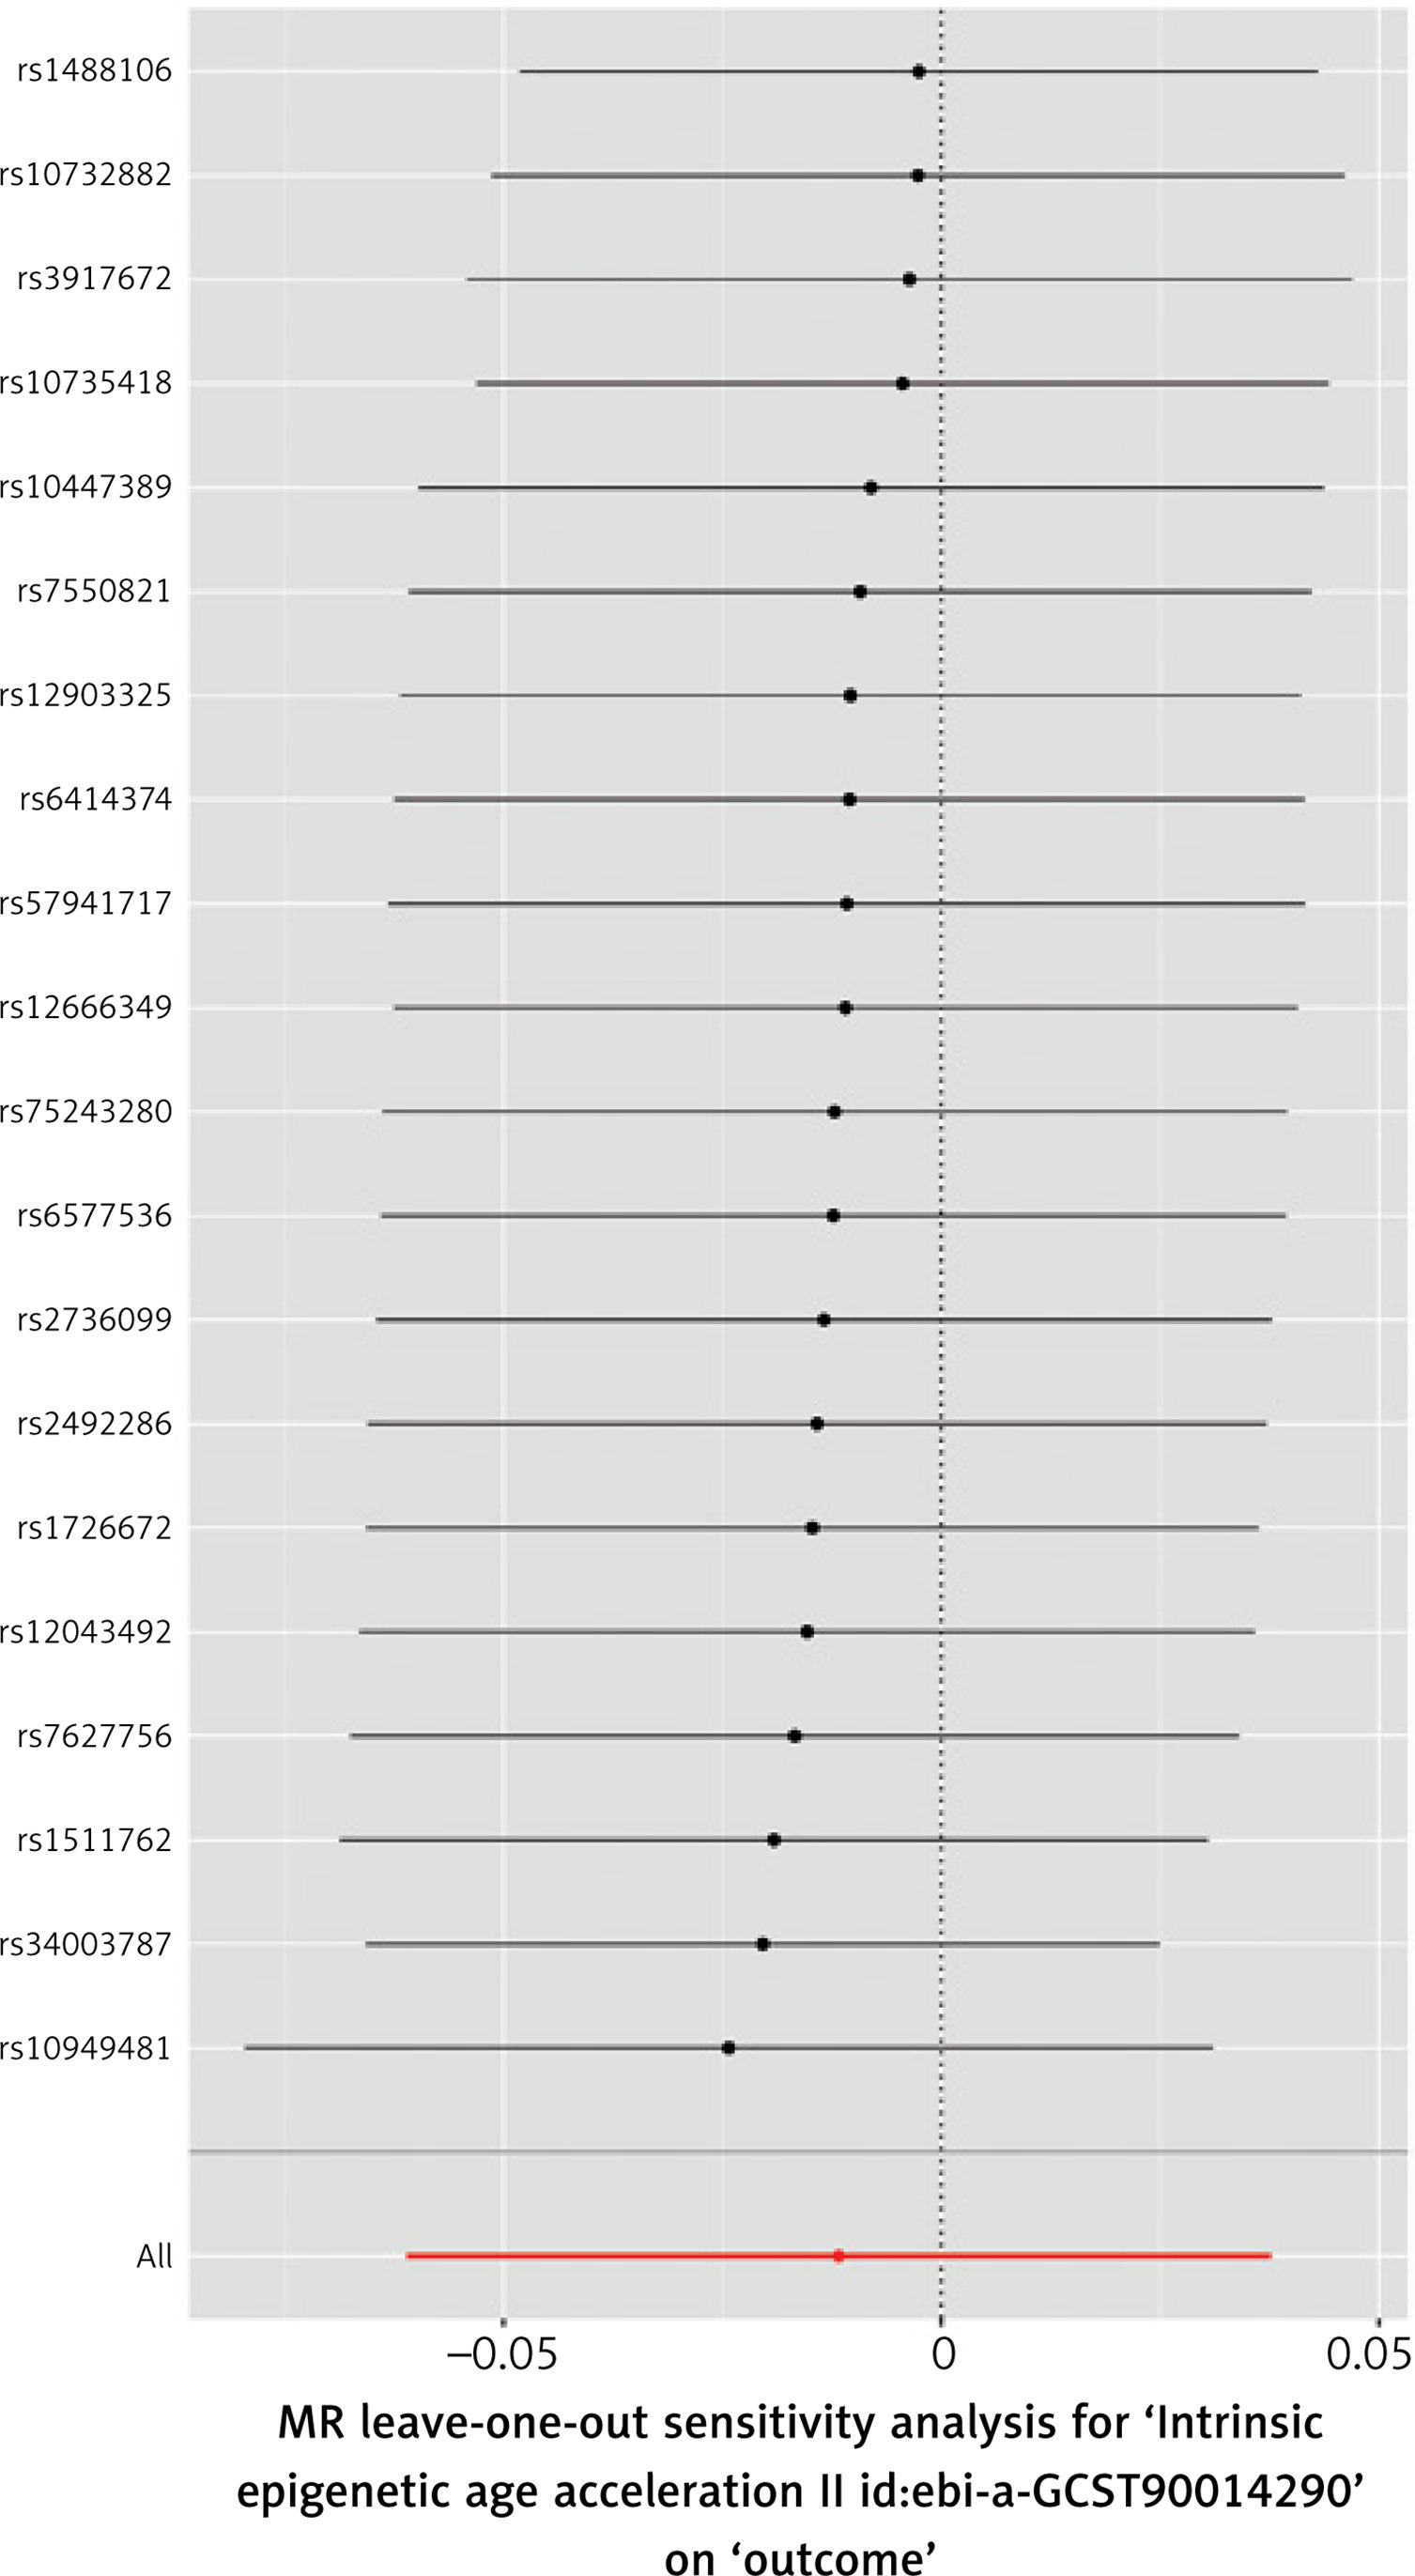
A total of 20 SNPs were selected as IVs based on the inclusion criteria for IEAA (Supplementary Table SV). We found no genetic liability to IEAA that was causally associated with CAC. The results of analyses were not significant (IVW, MR-Egger, WME p > 0.05). A significant degree of heterogeneity was detected between the IVs (Cochran’s Q test p < 0.05), and there was evidence of horizontal pleiotropy (MR-PRESSO p = 0.02). The results of this analysis are presented in Tables V, VI and Figures 6, 7.
Table V
Mendelian randomization between IEAA, PhenoAge, and CAC
| Exposure | Method | nSNP | β | SE | P-value |
|---|---|---|---|---|---|
| IEAA | IVW | 20 | –0.01 | 0.03 | 0.64 |
| MR-Egger | 20 | 0.08 | 0.07 | 0.25 | |
| WME | 20 | 0.002 | 0.03 | 0.94 | |
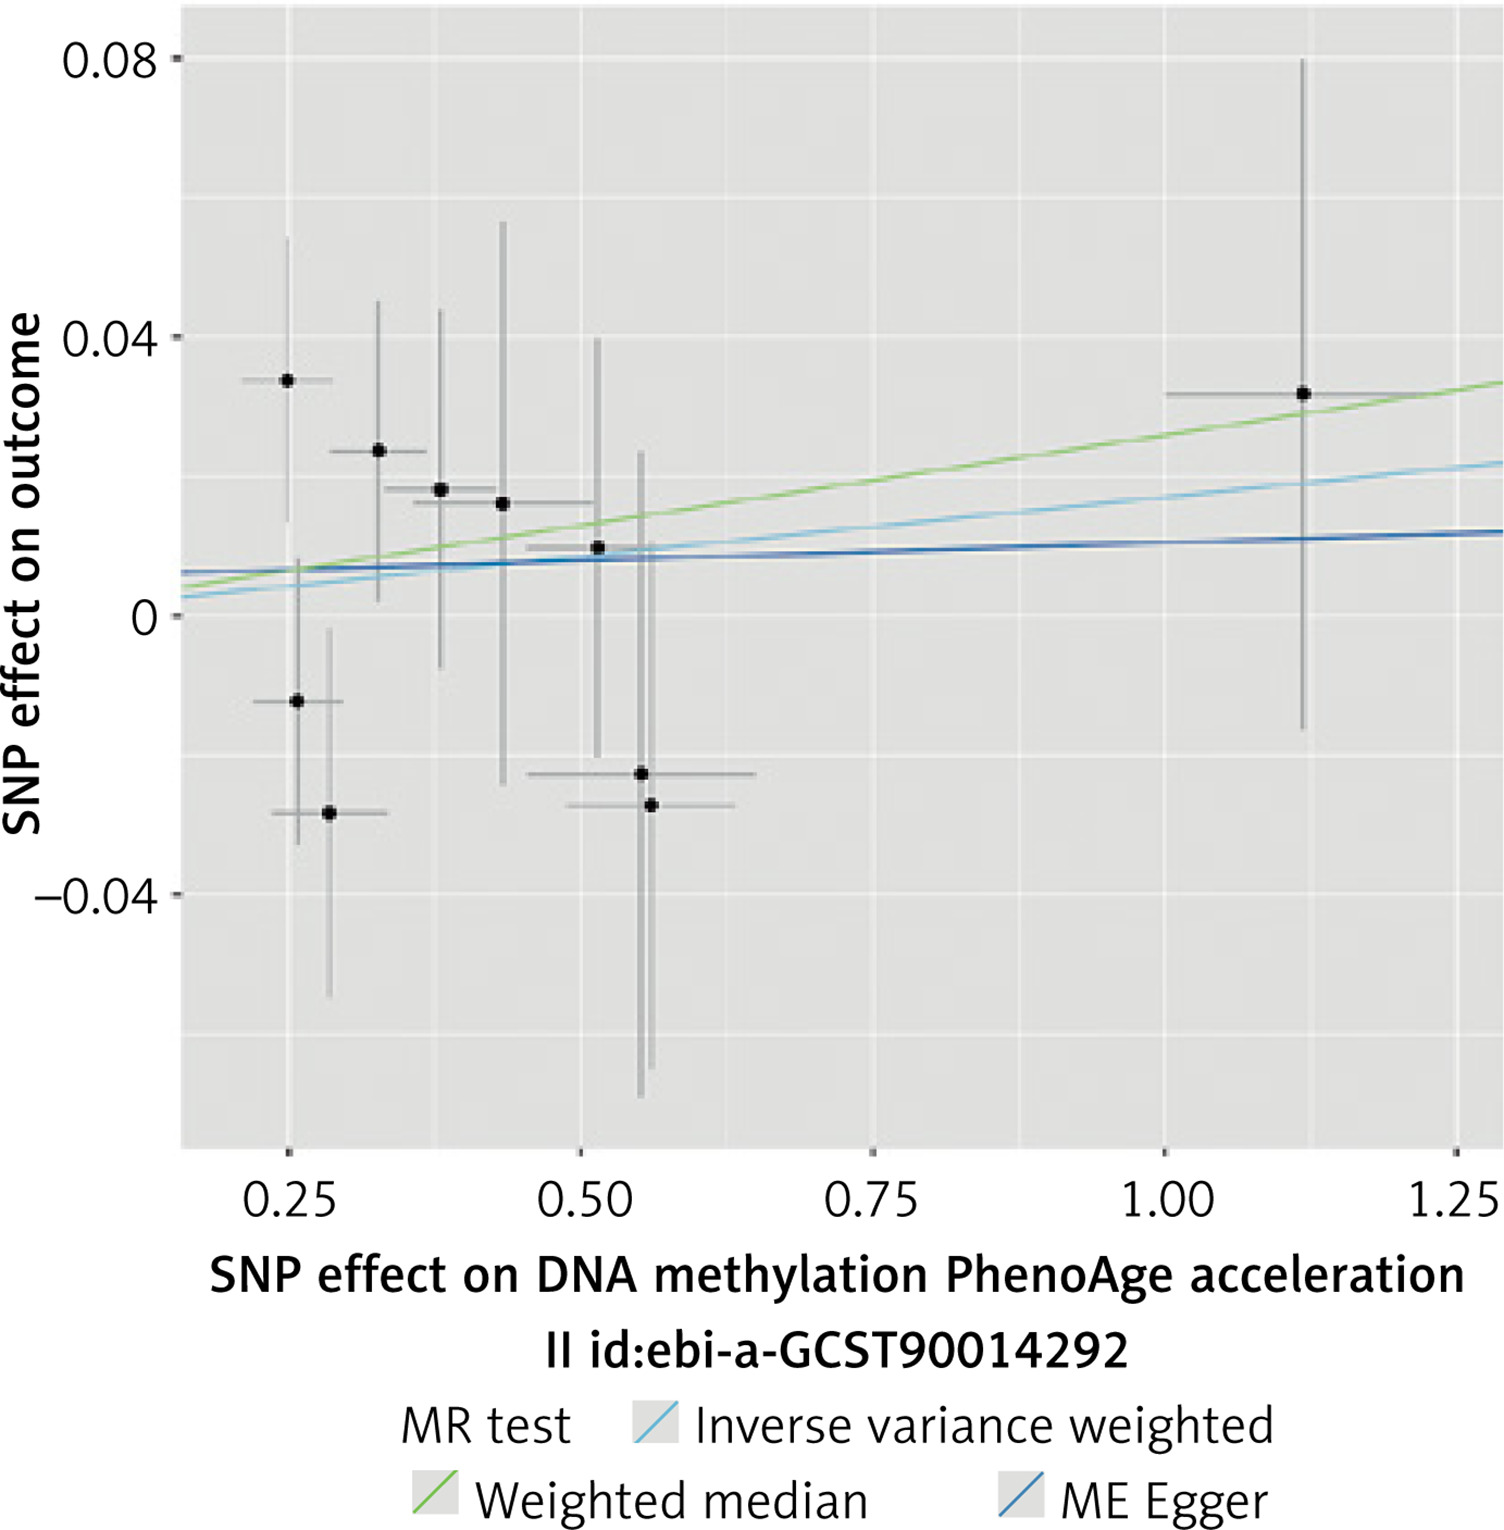
| PhenoAge | IVW | 10 | 0.02 | 0.02 | 0.43 |
| MR-Egger | 10 | 0.005 | 0.05 | 0.92 | |
| WME | 10 | 0.03 | 0.03 | 0.36 |
Table VI
Sensitivity analyses of the Mendelian randomization on IEAA, PhenoAge and CAC
| Exposure | Cochran’s QIVW | Cochran’s Q MR Egger | MR Egger | MR-PRESSO | ||||
|---|---|---|---|---|---|---|---|---|
| Value | P-value | Value | P-value | Intercept | P-value | Outliers | Global P test | |
| IEAA | 32.56 | 0.03 | 29.04 | 0.05 | –0.03 | 0.16 | – | 0.02 |
| PhenoAge | 6.75 | 0.66 | 6.68 | 0.57 | 0.005 | 0.80 | – | 0.70 |
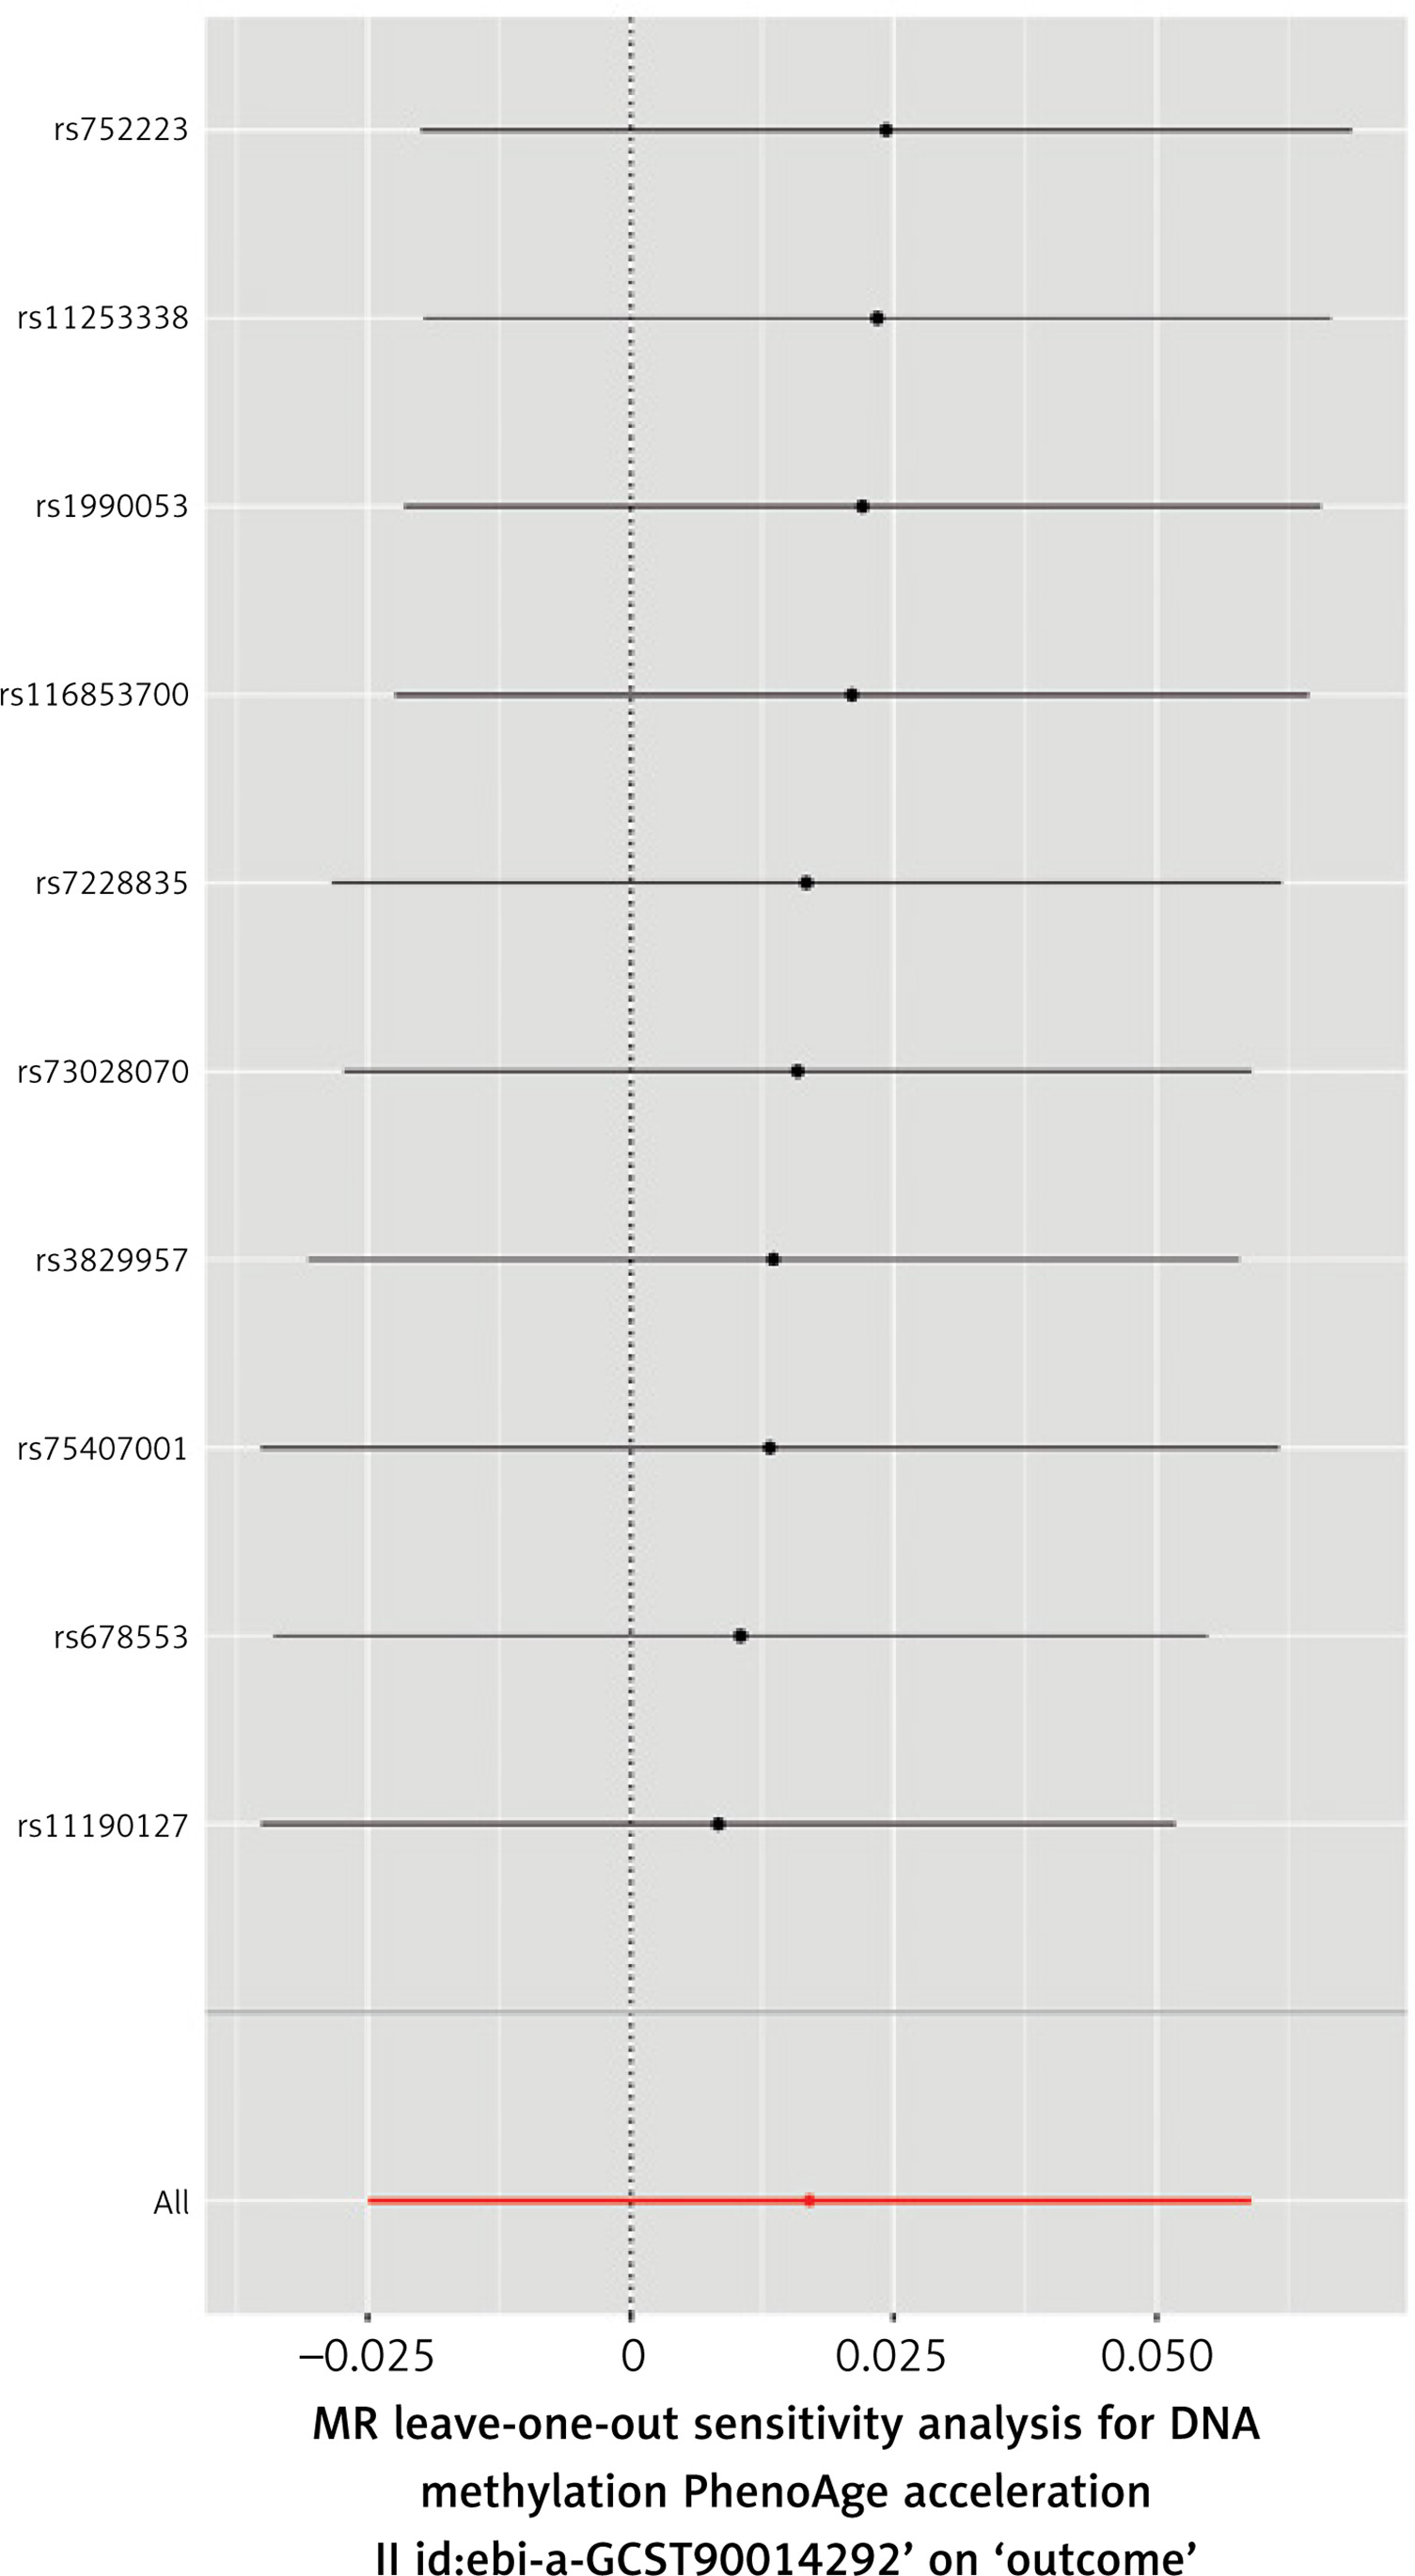
A total of 10 SNPs were selected for the analysis of the impact of PhenoAge on CAC (Supplementary Table SVI). We found no genetic liability to PhenoAge that was causally associated with CAC. The results of analyses were not significant (IVW, MR-Egger, WME p > 0.05). No significant heterogeneity was detected between the included SNPs, and there was no evidence of horizontal pleiotropy. The results of this analysis are presented in Tables V, VI and Figures 8, 9.
The impact of dental deterioration parameters on CAC
Due to the limited number of potential IVs for loose teeth and bleeding gums, we reduced the required genetic significance threshold to p < 5 × 10⁻⁶. We did not identify evidence of genetic liability supporting a causal association between dental deterioration parameters and CAC. None of the parameters studied significantly affected CAC in analyses (IVW, MR-Egger, and WME p > 0.05). Significant heterogeneity and horizontal pleiotropy were detected only for loose teeth.
The SNPs analyzed are presented in Supplementary Tables SVII–SIX, while the results of the analyses of dental deterioration parameters and CAC are presented in Supplementary Tables SX, SXI and Supplementary Figures S3–S8.
Discussion
The study utilized MR to examine the causal relationship between aging and CAC. Aging is inherently difficult to measure directly and is commonly assessed using various genetically determined biomarkers, such as TL [23, 25], epigenetic age (e.g., DNA methylation patterns) [26–28], and changes in dental deterioration [39].
Our analysis showed a causal association between genetically longer TL and lower CAC, whereas no significant associations were found between epigenetic aging markers (IEAA, PhenoAge) and CAC. Similarly, genetically determined parameters related to age-related deterioration of dentition (bleeding gums, denture use, loose teeth) had no notable impact on CAC.
TL, as a genetically determined marker of aging, is also associated with the risk of morbidity, including CVD. Previous MR studies confirm that longer TL is associated with lower CVD risk, although it is also linked to a higher risk of some cancers and HTN [40]. Other studies highlight the inverse relationship between TL and CVD risk, such as coronary atherosclerosis, myocardial infarction (MI), and stroke [41].
Epigenetic markers may help clarify mechanisms of aging [26–28]. For instance, MR analysis using IEAA data suggests that TL, rather than changes in this epigenetic clock, reduces the risk of CVD, including related conditions like atherosclerosis, stable and unstable angina pectoris, and MI [42]. The potential for a one SD increase in TL to reduce cardiovascular complications by 10–30% emphasizes its clinical significance. Moreover, studies using PhenoAge data demonstrate that DNA methylation levels are positively associated with the risk of heart failure and arrhythmias [43].
Genetic factors linked to dentition deterioration (such as tooth mobility, gum bleeding, and the use of dentures) were hypothesized to influence aging and CAC. However, no significant genetic association with CAC was observed. Other studies investigating the link between oral health and CVD have found mixed results. While some of them failed to confirm a causal relationship between dental diseases and CVD, a potential link to heart failure was suggested [44]. Certain research studies on periodontitis indicate its causal role in increasing the risk of minor vessel stroke and CVD [19]. The results presented in the work of Liu et al. indicate that MR analysis supports potential causal associations between the use of dentures (genetic predisposition) and the risk of heart failure, stroke, type 2 diabetes, and other risk factors; no association was observed with CAD, MI, or subtypes of ischemic or hemorrhagic stroke [45]. Thus, while oral hygiene is critical in reducing cardiovascular risk, the causal mechanisms remain under investigation [2, 45].
CAC is a critical predictor of CVD, and CAC > 0 is an essential indication for pharmacological intervention. Shorter TL has been associated with higher CAC levels, suggesting an increased risk of CVD [46]. Studies show that a significant portion of patients with initially CAC = 0 will develop CAC > 0 within a 3–5-year observation period, but assuming age, sex, and individual CVD risk category [47, 48].
The relationship between TL and CVD remains relatively ambiguous – it is assumed that shortened TL is a result of oxidative stress, chronic inflammation, and endothelial damage, all of which contribute to CVD [41]. It was demonstrated that telomere shortening in endothelial cells promotes the expression of proinflammatory cytokines [16]. Additionally, TL is linked to the pathogenesis of type 2 diabetes, a known risk factor for CVD. Environmental and lifestyle factors, such as physical inactivity, smoking, and poor diet, can negatively affect TL, further increasing the risk for cardiovascular disease [41].
However, different studies suggest that mitochondrial dysfunction, rather than telomere shortening, may be the primary cause of endothelial damage [49].
A significant inverse relationship between TL and CAC has been indicated, confirming the importance of TL as a biological marker of aging and its association with CAD [46]. CAC serves as an essential indicator in predicting cardiovascular events, strongly associated with subsequent CAD occurrence and mortality risk [1, 12, 30, 50]. Additionally, the absence of CAC in CAD cases is very rare, whereas CAC score > 0 may be observed in up to 40% of primary care patients, suggesting underlying atherosclerosis progression [4, 51]. The extent of CAC is more pronounced in men, while in women, it intensifies in the postmenopausal period. Importantly, calcification correlates poorly with vessel lumen narrowing but shows a significant association with the total atherosclerotic plaque area [12].
Surprisingly, athletes, especially those engaged in endurance sports, often exhibit higher CAC levels than sedentary individuals [7]. Intense physical activity increases catecholamine levels, blood pressure, hypomagnesemia, and PTH levels, and affects coronary vessel hemodynamics. These factors contribute to a higher cardiovascular load, potentially increasing the risk of elevated CAC levels. However, the atherosclerotic plaques observed in athletes tend to be less vulnerable. Despite higher CAC levels in athletes, these calcifications may not indicate advanced atherosclerosis or heightened cardiovascular risk [7, 52].
The presence of CAC, particularly its distribution across arterial segments, is a significant indicator of vascular disease progression. However, in clinical practice, CAC assessment alone is often insufficient, as coronary CT angiography with stenosis severity assessment is more informative [52]. The severity of CAC also corresponds to endothelial cell lifespan, thereby contributing to the assessment of arterial biological age by indicating gradual arterial aging [1]. Similarly, the correlation with TL allows for the evaluation of CVD and premature aging of the organism, independently of environmental influences [4, 12].
Among the limitations of the conducted analysis, one can point out the exclusion of SNPs with weak F-statistics (< 10), which helps avoid weak instrument bias by eliminating weak IVs but can also limit the completeness of the analysis, as fewer SNPs reduce statistical power.
Additionally, the determination of the significance threshold (GWAS) for SNPs selected as IVs may impact the statistical significance of the results and limit the effects of heterogeneity and pleiotropy in the conducted analysis, in the context of narrowing the selection in the additional analysis for TL. In our study, the selection criteria were also relaxed due to the very limited number of IVs in the dental parameter analysis.
In studies like ours, the accuracy of the procedures used to obtain the underlying data may also be indirectly significant to the overall results. Variations in telomere measurement methods, such as PCR, may introduce discrepancies, affecting results and, in turn, interpretation. Inconsistencies in calibration samples and standard curves across laboratories can introduce variability, underscoring the need for consistent research methodology [25].
In conclusion, this study supports an inverse causal relationship between TL and CAC, reinforcing CAC as a potential biomarker of biological aging. Epigenetic aging markers and dental deterioration parameters were not significantly linked to CAC. Future studies should explore additional aging-related traits and refine the genetic instruments for epigenetic aging and dental health to further elucidate their roles in vascular aging.