Introduction
A glioma is a type of malignant tumour that occurs in the neuroectoderm of the central nervous system with high morbidity, mortality, and recurrence rates [1]. It is the most common primary intracranial tumour, with an annual incidence of 3–10 per 100,000 in the United States, accounting for 46% of intracranial tumours and 2% of all malignant tumours [2, 3]. Current predominant treatments are surgical resection, radiation therapy, and chemotherapy [4–6]. However, due to the invasion and metastasis properties of gliomas, it is difficult to attain total removal by surgical resection [7]. In addition, the resistance to radiotherapy and chemotherapy frequently lead to the progression and recurrence of tumours [8]. The prognosis of patients with high-grade glioma is still poor, with a median survival time of 14 months [9]. However, gene therapy has emerged as a promising treatment for glioma, with fewer side effects and greater specificity compared to those of traditional therapies. Therefore, it is necessary to identify therapeutic targets based on the molecular mechanisms underlying tumour occurrence and progression for effective glioma treatment.
Autophagy is a homeostatic process in which cellular metabolic waste is recycled to support cellular metabolism via autophagosomes [10, 11]. Recently, researchers have proven that autophagy can promote tumour growth. Activated autophagy is a mechanism by which tumour cells adapt to extreme conditions, such as hypoxia and high metabolic demand [12]. Autophagy occurs during glioma chemoresistance after the use of temozolomide, contributing to the failure of chemotherapy. Drugs targeting autophagy in glioma are urgently needed. CALCOCO2 encodes a coiled-coil domain-containing protein [13]. The protein can combine with ubiquitin-coated bacteria, recognise microtubule-associated protein 1 light chain 3 (LC3) in autophagy, and deliver bacteria to autophagosomes for elimination [14]. However, the role of CALCOCO2 in glioma is unclear.
In this study, the role of CALCOCO2 in the pathogenesis and progression of glioma was investigated.
Material and methods
Cell culture
Human glioma U87 and U251 cell lines were obtained from the Shanghai Institute of Cell Biology, Chinese Academy of Sciences. The cells were cultured in DMEM supplemented with 10% FBS and 1% antibiotics at 37°C with 5% CO2.
The present study was approved by the Ethics Committee of China-Japan Union Hospital of Jilin University and The First Hospital of Jilin University.
CALCOCO2 expression in glioma cell lines
CALCOCO2 expression in four glioma cell lines, i.e., U87, U251, U373, and A-172, was assessed by quantitative real-time polymerase chain reaction (RT-qPCR). Briefly, total messenger RNAs (mRNAs) of cells were extracted using TRIzol reagent (Invitrogen, Carlsbad, CA, USA). The mature mRNAs (2 µg per sample) were reverse transcribed into cDNAs using Super MMLV reverse transcriptase (BioTeke, Beijing, China). The mRNA levels of CALCOCO2 were determined by RT-qPCR using the Bio-Rad Connect Real-time PCR platform. RT-qPCR consisted of an initial denaturation step at 95°C for 15 s, 30 cycles of 95°C for 5 s, and 60°C for 30 s. The mRNA expression levels were determined by a comparative CT (2–ΔΔCt) analysis.
Construction of lentivirus vectors targeting CALCOCO2
A short hairpin RNA (shRNA) was designed according to the sequence of CALCOCO2. The shRNA oligos were synthesised and inserted into the plasmid GV115 (GeneChem, Shanghai, China), and then recombinant lentiviruses were constructed by plasmid co-transfection of 293T cells according to the manufacturer’s instructions. The viral supernatant was collected and filtered through a 0.45-µm filter (Millipore, Billerica, MA, USA) at 72 h post-transfection, and the viral titre was determined. Subsequently, the viral supernatant was added to the U87 and U251 cell lines, and the expression of CALCOCO2 in cells was observed under a fluorescence microscope at 48 h (Olympus America, Melville, NY, USA). The cells infected with shCALCOCO2 and control shRNA were termed shCALCOCO2 and shControl, respectively.
Silencing efficiency assessment
The silencing efficiency of CALCOCO2 at the protein level was assessed by western blotting. Briefly, after U87 and U251 cells were infected with shCALCOCO2 or shControl for 5 days, they were collected and lysed with protein lysate (100 mM tris(hydroxymethyl)aminomethane hydrochloride (pH 6.8), 10 mM ethylenediaminetetraacetic acid, and 4% sodium dodecyl sulphate) for 20 min. The lysates were centrifuged, and the supernatants were collected. The total protein was measured by a BCA protein assay (HyClone-Pierce, Rockford, IL, USA), separated by 12.5% sodium dodecyl sulphate polyacrylamide gel electrophoresis, transferred to polyvinylidene difluoride membranes, and blocked for 1 h at room temperature (25°C). The membranes were then incubated with rabbit anti-GAPDH or rabbit anti-CALCOCO2 primary antibodies (1 : 500; Santa Cruz Biotechnology, Santa Cruz, CA, USA) and incubated at 4°C overnight. The membranes were washed with Tris-buffered saline and Tween, and a moderate volume of secondary antibody (goat anti-mouse IgG, 1 : 5000; Santa Cruz Biotechnology) was added and incubated for 3 h at room temperature. The membranes were then detected using enhanced chemiluminescence (ECL) reagent (ECL-Plus/Kit; Amersham, Piscataway, NJ, USA).
Cell counting
Multiparametric high-content screening (HCS) was utilised to determine the cell growth status. Briefly, U87 and U251 cells in the logarithmic phase in shCALCOCO2 or shControl groups were seeded on 96-well plates at a density of 4000 cells/well. Subsequently, the cells were incubated for 5 days, and every day the living cells exhibiting green fluorescence in each plate were recognised and counted using ArrayScan™ HCS software (Cellomics Inc., Pittsburgh, PA, USA).
MTT assay
A 3-(4,5-dimethylthiazol-2-yl)-2, 5-diphenyl-tetra-zoniumbromide (MTT) assay was performed to assess cell viability. Briefly, the exponential growth cells infected with shCALCOCO2 or shControl were seeded on 96-well plates at a density of 4000 cells/well and incubated for 1, 2, 3, 4, or 5 days. At a predetermined timepoint, 20 µl of MTT was added to the cells, followed by incubation for 4 h. The supernatants were removed, and 100 µl of dimethyl sulphoxide (DMSO) was added to decompose formazan. The viability of cells was analysed by detecting absorbance at 490 nm using a microplate reader (BioTek Instruments, Winooski, VT, USA).
Flow cytometry
U87 and U251 cells infected with shCALCOCO2 or shControl were seeded on six-well plates after lentivirus infection for 5 days at a density of 3 × 10⁵ and cultured for 48 h. Subsequently, the cells were harvested, centrifuged, washed with PBS twice, and then resuspended using staining buffer at a cell concentration of 1.0 × 10⁶/ml. The cell suspensions were then stained with Annexin and PI at room temperature for 15 min in the dark and evaluated by flow cytometry (FCM, FACSCalibur; BD Biosciences, Franklin Lakes, NJ, USA).
Caspase-Glo 3/7 assay
Caspase-Glo 3/7 reagent was prepared by mixing caspase-Glo 3/7 with the substrate and was then stored at 4°C. Cells transfected with shCALCOCO2 or shControl at the logarithmic phase were seeded on 96-well plates at a density of 4000 cells/well and then cultured for 1, 2, 3, 4, or 5 days. The caspase-Glo 3/7 reagent was added to the cells at an amount equivalent to the volume of the culture, shaken for 30 s, and cultured for 0.5–3 h at room temperature according to cell conditions. The fluorescence of each well was assessed using a microplate reader.
Gene microarray
The genome-wide effect of the silencing of CALCOCO2 in the U87 cell line was investigated using a GeneChip® PrimeView™ Human Gene Expression Array (Affymetrix; Thermo Fisher Scientific, Inc., Waltham, MA, USA). Briefly, after cells were treated with shControl or shCALCOCO2 for 72 h, the total mRNA was extracted, quantified, reverse-transcribed, and labelled with biotin using the GeneChip® 3’ IVT Express Kit (Thermo Fisher Scientific). Subsequently, the labelled cDNAs were used to hybridise the GeneChip® PrimeView™ Human Gene Expression Array consisting of 20,000 genes according to the manufacturer’s protocol. After hybridisation, the gene chips were washed and scanned using a GeneChip® Fluidics Station 450, and images were acquired using GeneChip operating software. Data were summarised, and GeneSpring software was used for data analysis. Differentially expressed genes generated from the microarray analyses were analysed by the Ingenuity Pathway Core Analysis (IPA®, QIAGEN, Redwood City, CA, USA) to interpret the underlying molecular mechanisms. The enrichment of gene networks was analysed based on the overlap score (p-value and z-score). Three main analyses were performed using IPA, i.e. analyses of diseases and functions, gene networks, and downstream targets.
Assessment of downstream target proteins
To investigate the role of CALCOCO2 in the pathogenesis of glioma, the expression levels of related proteins in U87 and U251 cells infected with shCALCOCO2 or shControl were assessed by western blotting. The specific methods were as described above, and the protein levels were measured.
Statistical analyis
All experiments were repeated thrice and the results expressed as means ± standard deviation. Statistical differences were evaluated using paired Student’s t-tests implemented in SPSS 23.0 (SPSS Inc., Chicago, IL, USA). P < 0.05 indicated statistical significance, and p < 0.01 and p < 0.001 were considered highly significant.
Results
CALCOCO2 expression in glioma cells and the silencing of CALCOCO2 in U87 and U251 cell lines
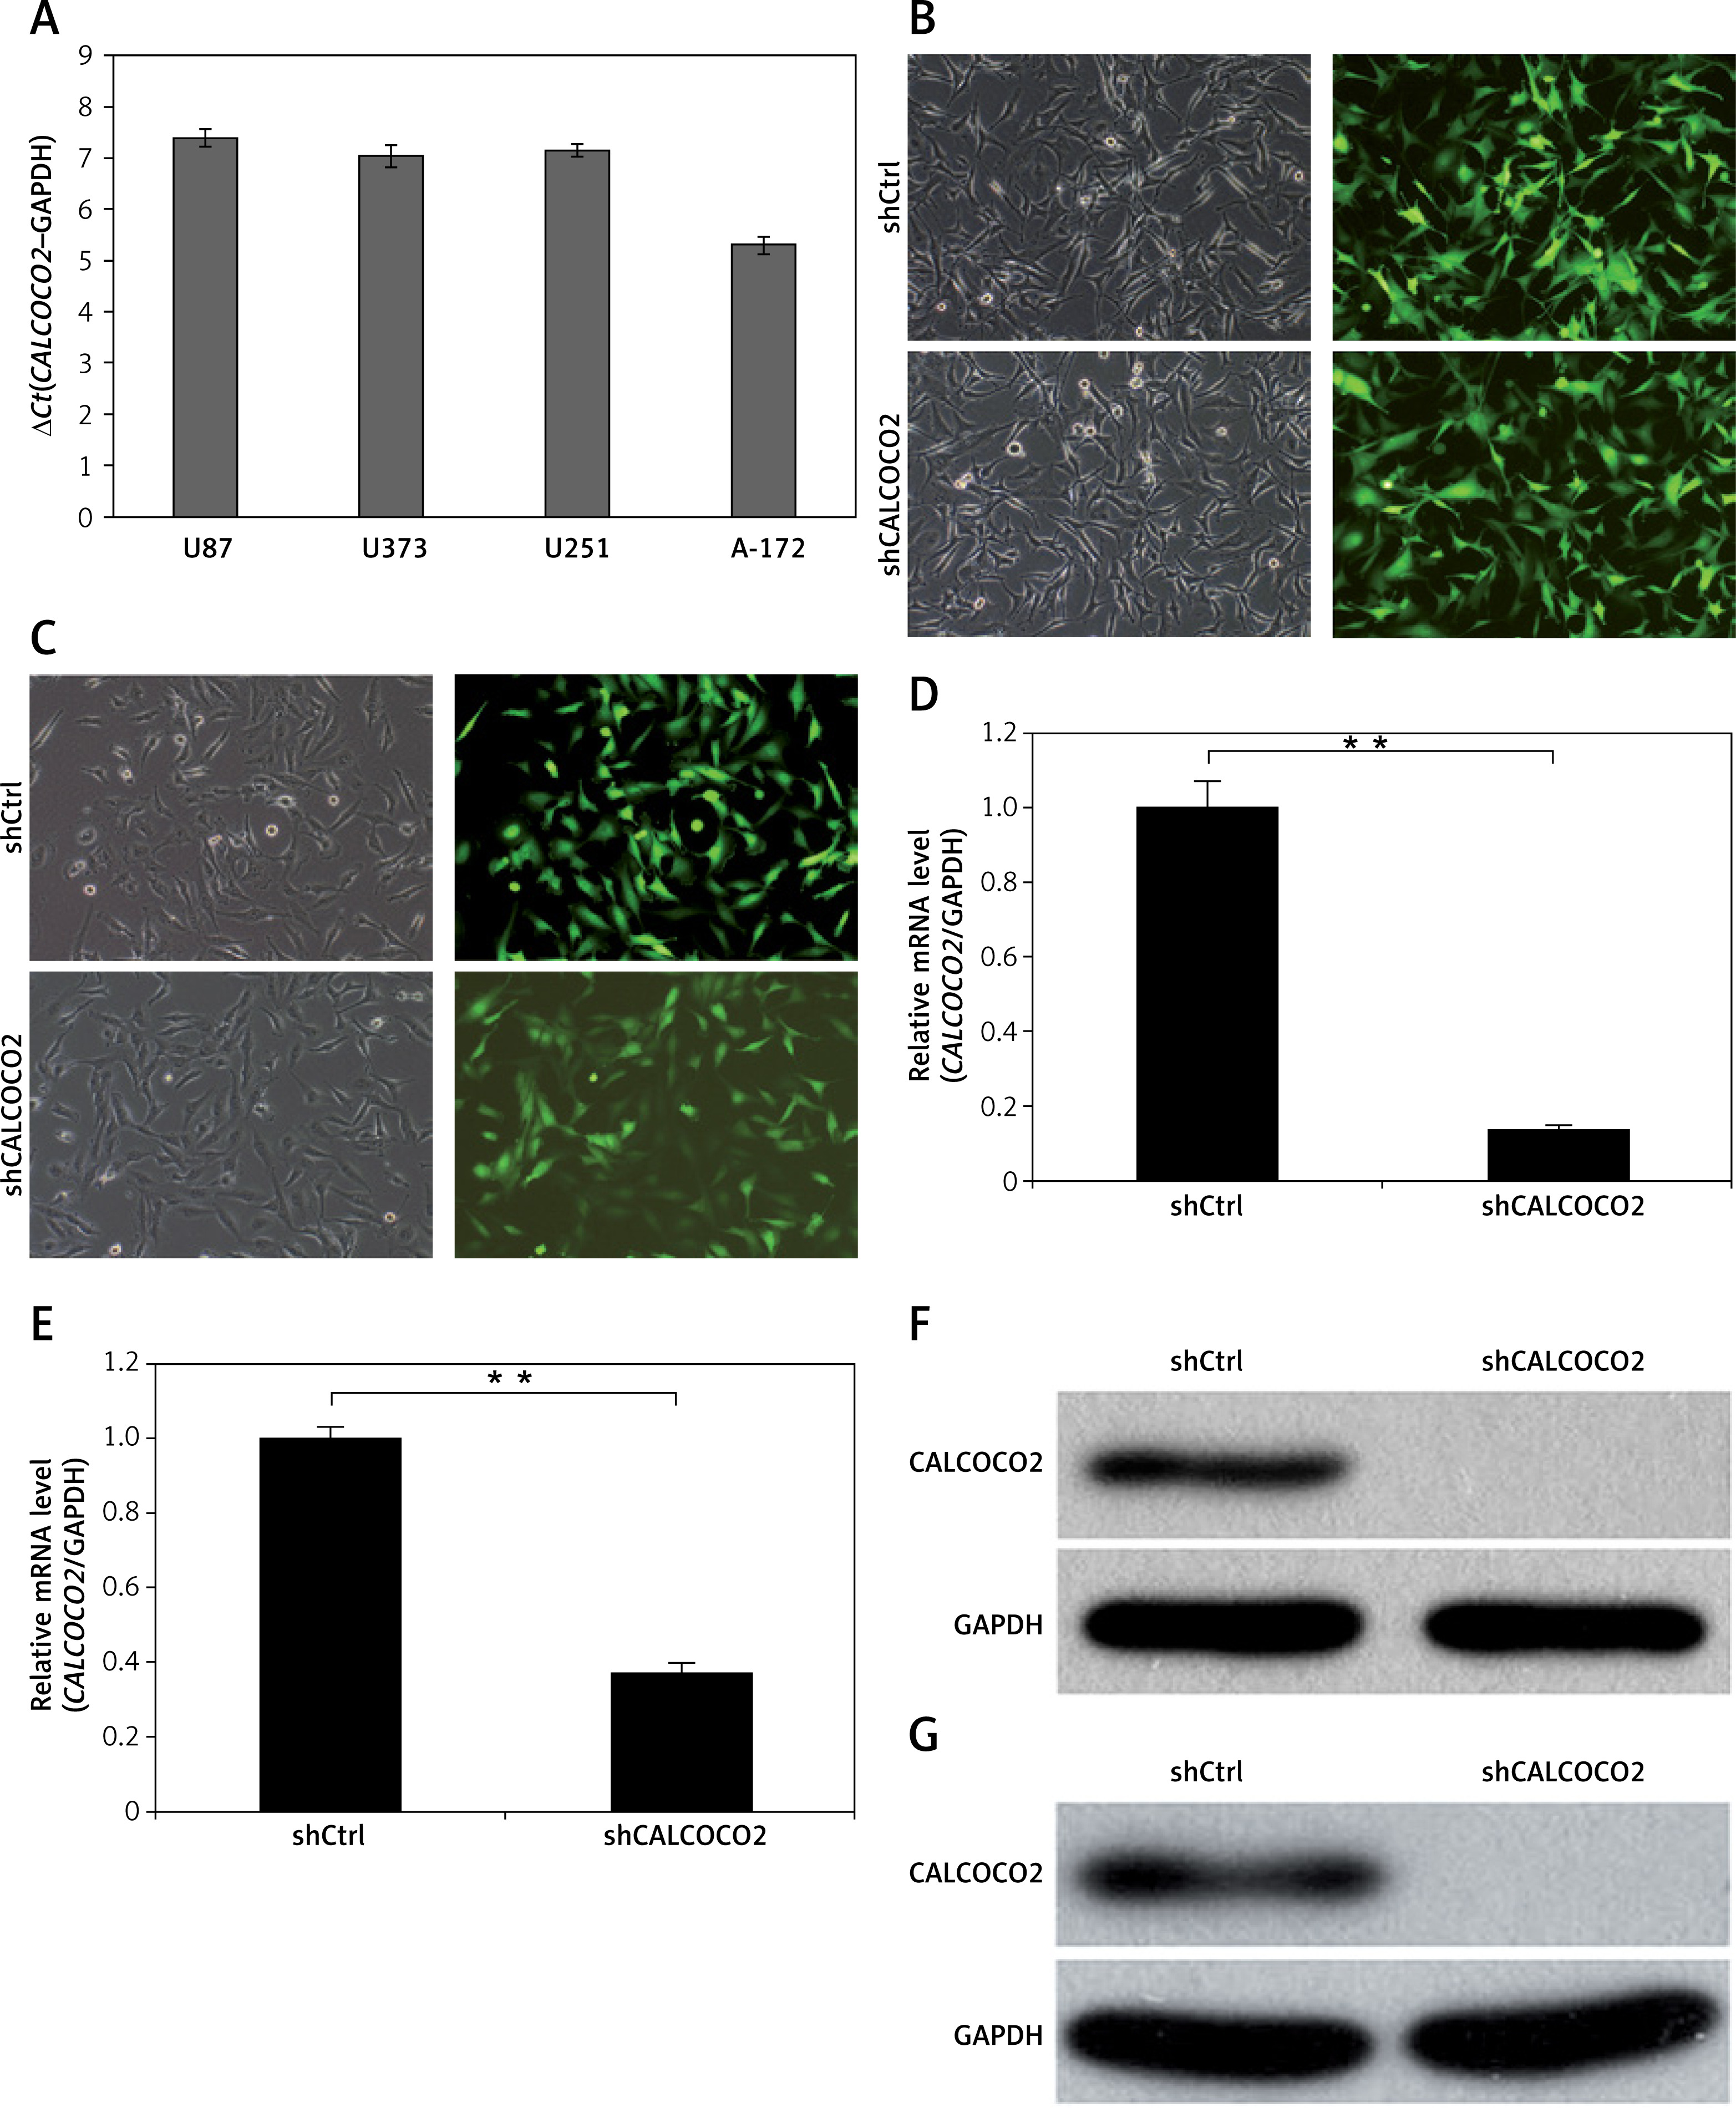
As shown in Figure 1 A, CALCOCO2 mRNA was overexpressed in all four cell lines, and the expression was highest in U87 and U251 cells. Moreover, as shown in Figures 1 B and C, most U87 and U251 cells were positive for green fluorescent protein under a microscope, indicating the efficient silencing of CALCOCO2 in both cell lines. The relative CALCOCO2 mRNA levels for shCALCOCO2-treated cells were 0.138 ±0.014 and 0.375 ±0.025 for the U87 and U251 cell lines, respectively, which were significantly lower than those of shControl cells (1.002 ±0.071 and 1 ±0.032, respectively, p < 0.001; Figures 1 D, E). Consistent with these findings, the protein levels of CALCOCO2 were significantly downregulated compared with those in shControl U87 and U251 cells (Figures 1 F, G).
Figure 1
CALCOCO2 silencing in the U87 and U251 cell lines. A – Expression of CALCOCO2 in glioma cell lines. qRT-PCR was performed to evaluate the expression levels of CALCOCO2 in four glioma cell lines (U87, U251, U373, and A-172). B, C – Microscopic images of U87 and U251 cell lines in the shControl and shCALCOCO2 groups. D, E – qRT-PCR analysis of the efficiency of CALCOCO2 silencing at the mRNA level. F, G – Western blot analysis of the efficiency of CALCOCO2 silencing at the protein level
Data are shown as means ± SD (n = 5; *p < 0.05, **p < 0.01, and ***p < 0.001).
Effects of CALCOCO2 silencing on cell growth
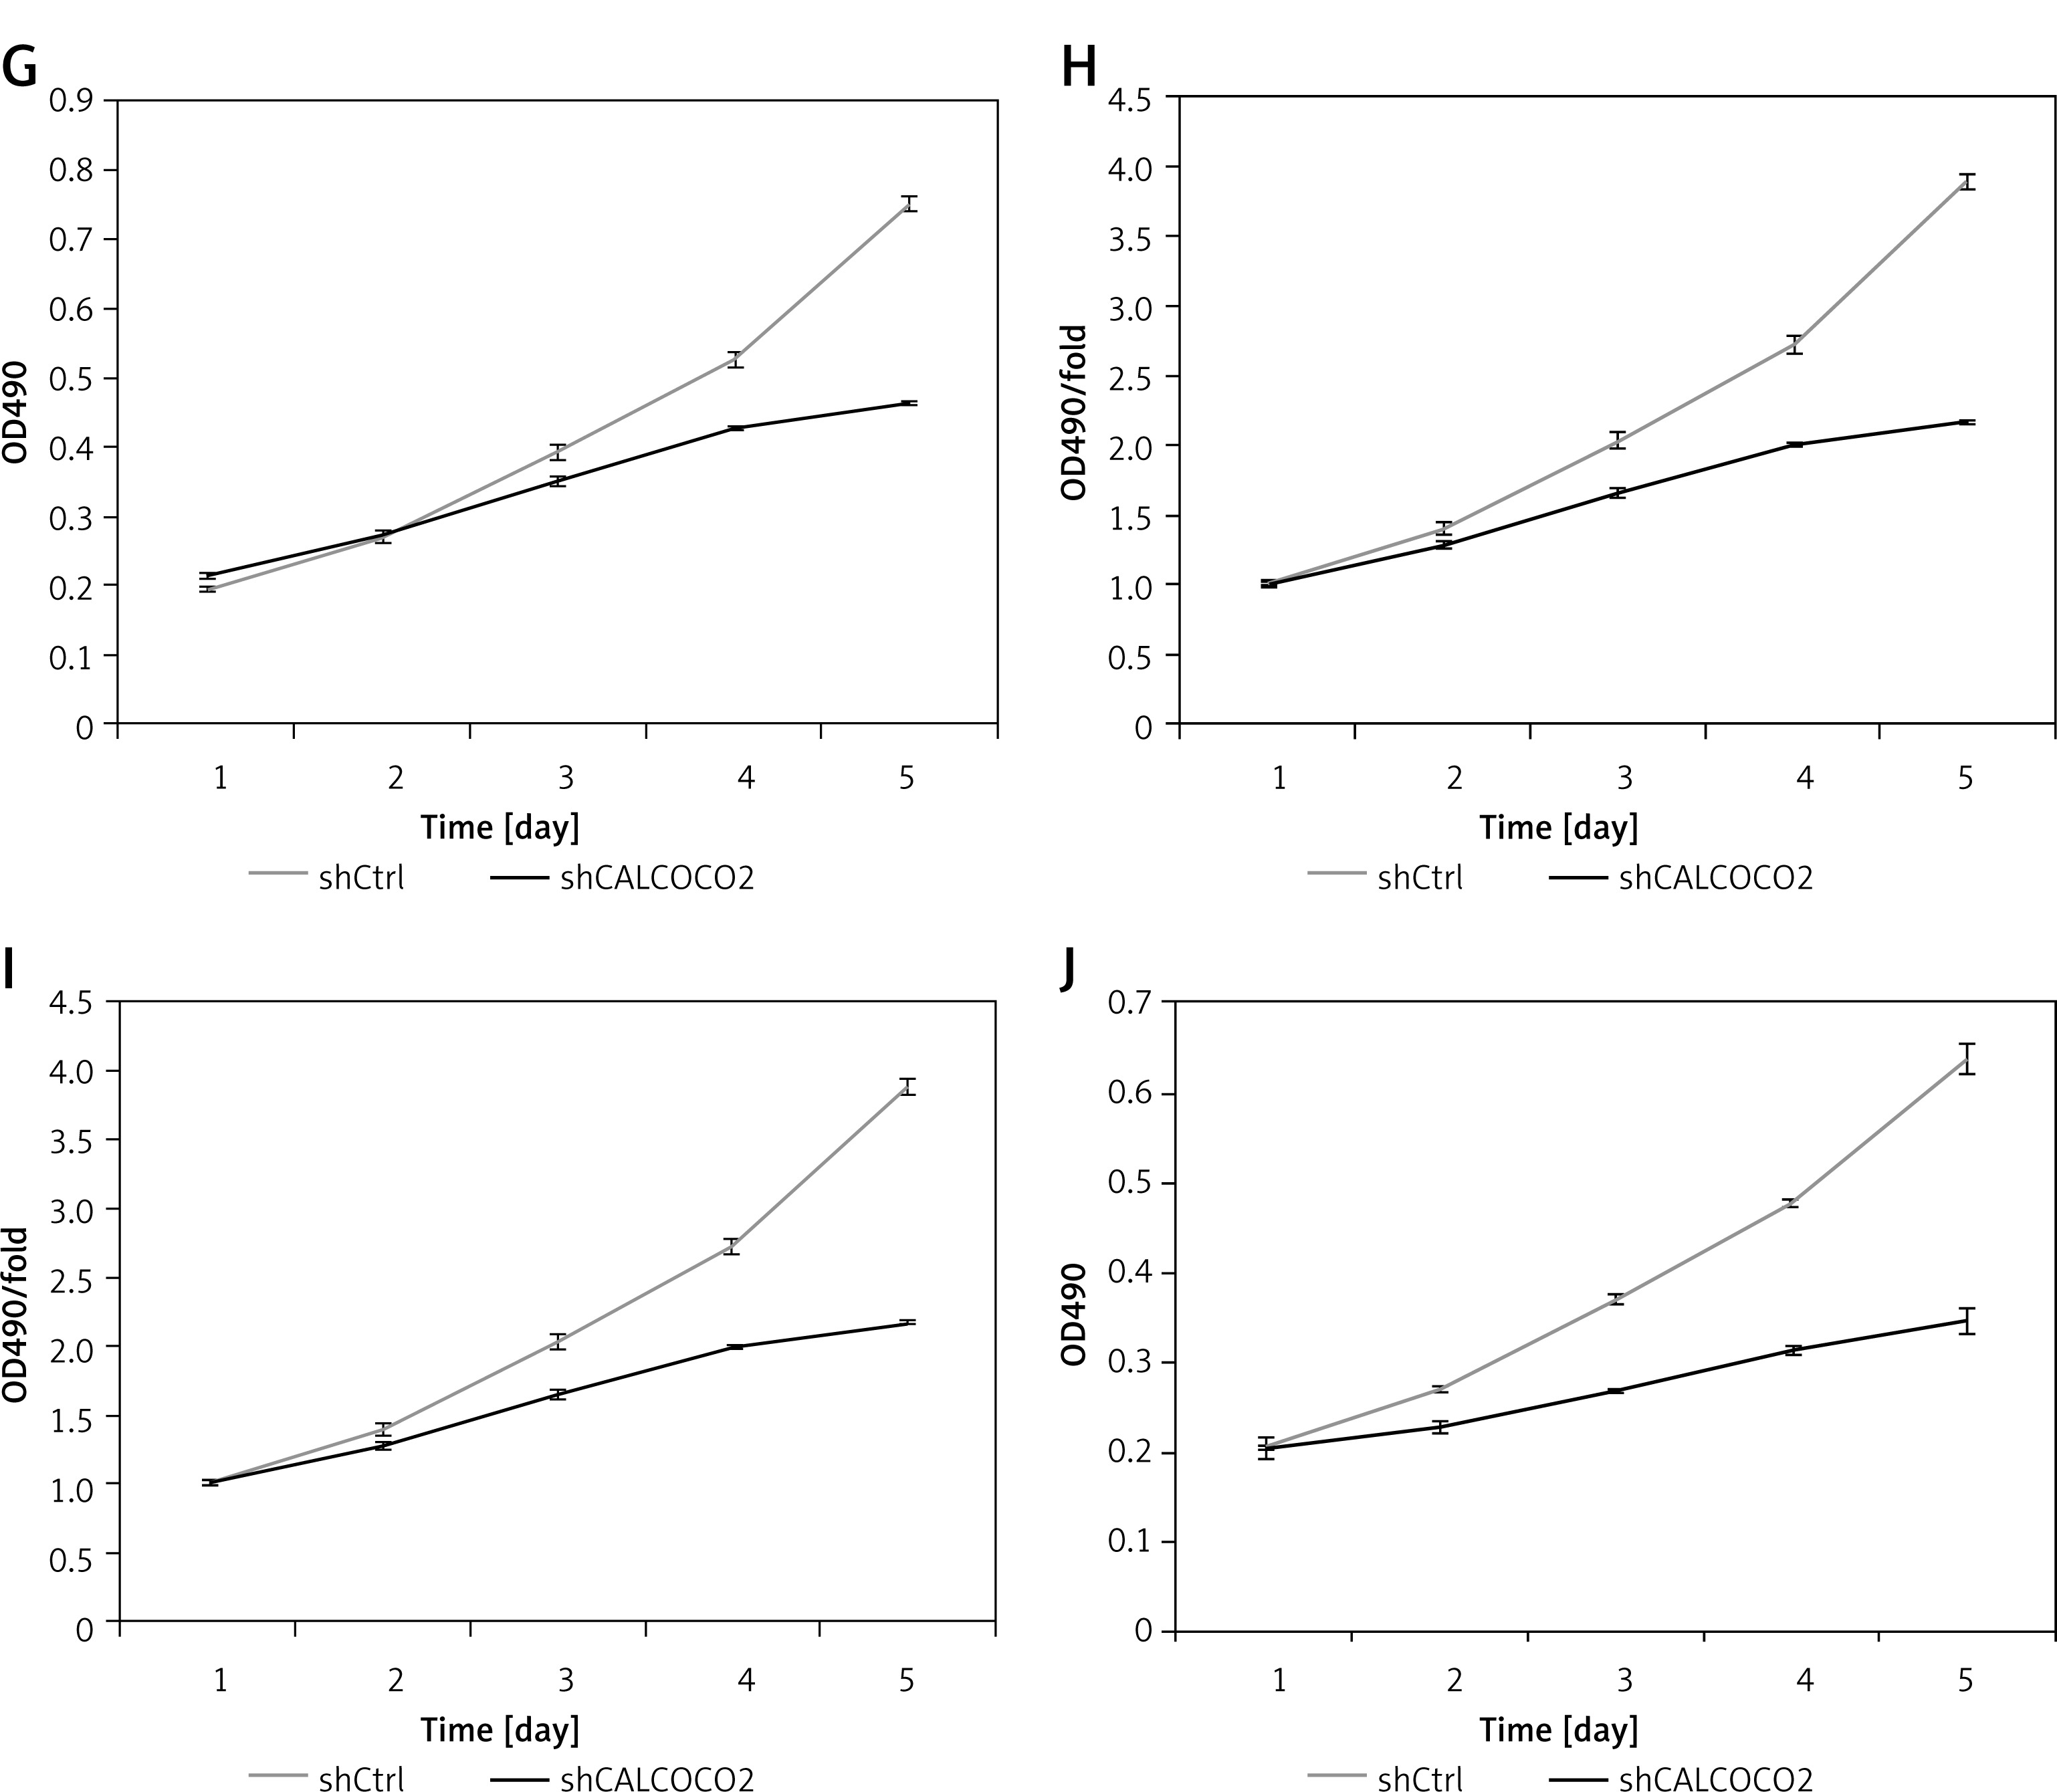
As shown in Figure 2 A, CALCOCO2 silencing significantly inhibited U87 cell growth compared to that of the shControl group (p < 0.05). The cell counting results showed that the proliferation fold change values for the shCALCOCO2 group in the U87 cell line at days 4 and 5 were 2.8 ±0.07 and 4.1 ±0.11, respectively, which were obviously lower than those for shControl cells (4.13 ±0.05 and 6.42 ±0.2, respectively). Similarly, there was a significant difference in cell counts between the shCALCOCO2 and shControl groups in the U251 cell line, especially on days 4 and 5, indicating the inhibitory effect of CALCOCO2 silencing on cell growth. An MTT assay also showed that both U87 and U251 cells exhibited slower proliferation and growth after the silencing of CALCOCO2, and these effects were even more pronounced on day 5, when the proliferation fold changes in the shCALCOCO2 group were 2.163 ±0.0068 and 1.696 ±0.0672 in U87 and U251 cells, respectively, while the proliferation fold changes in the shControl group were 3.882 ±0.0547 and 3.117 ±0.0793, respectively.
Figure 2
Silencing of CALCOCO2 inhibited the proliferation of both U87 and U251 cells. A – Representative images of HCS analysis of U87 cell lines in the shControl and shCALCOCO2 groups at various timepoints after lentivirus infection. B, C – Statistical analysis of cell numbers for the U87. D – Representative images of HCS analysis of U251 cell lines in the shControl and shCALCOCO2 groups at various timepoints after lentivirus infection. E, F – Statistical analysis of cell numbers for the U87 cell lines
HCS – multiparametric high-content screening.
Effects of CALCOCO2 silencing on cell apoptosis
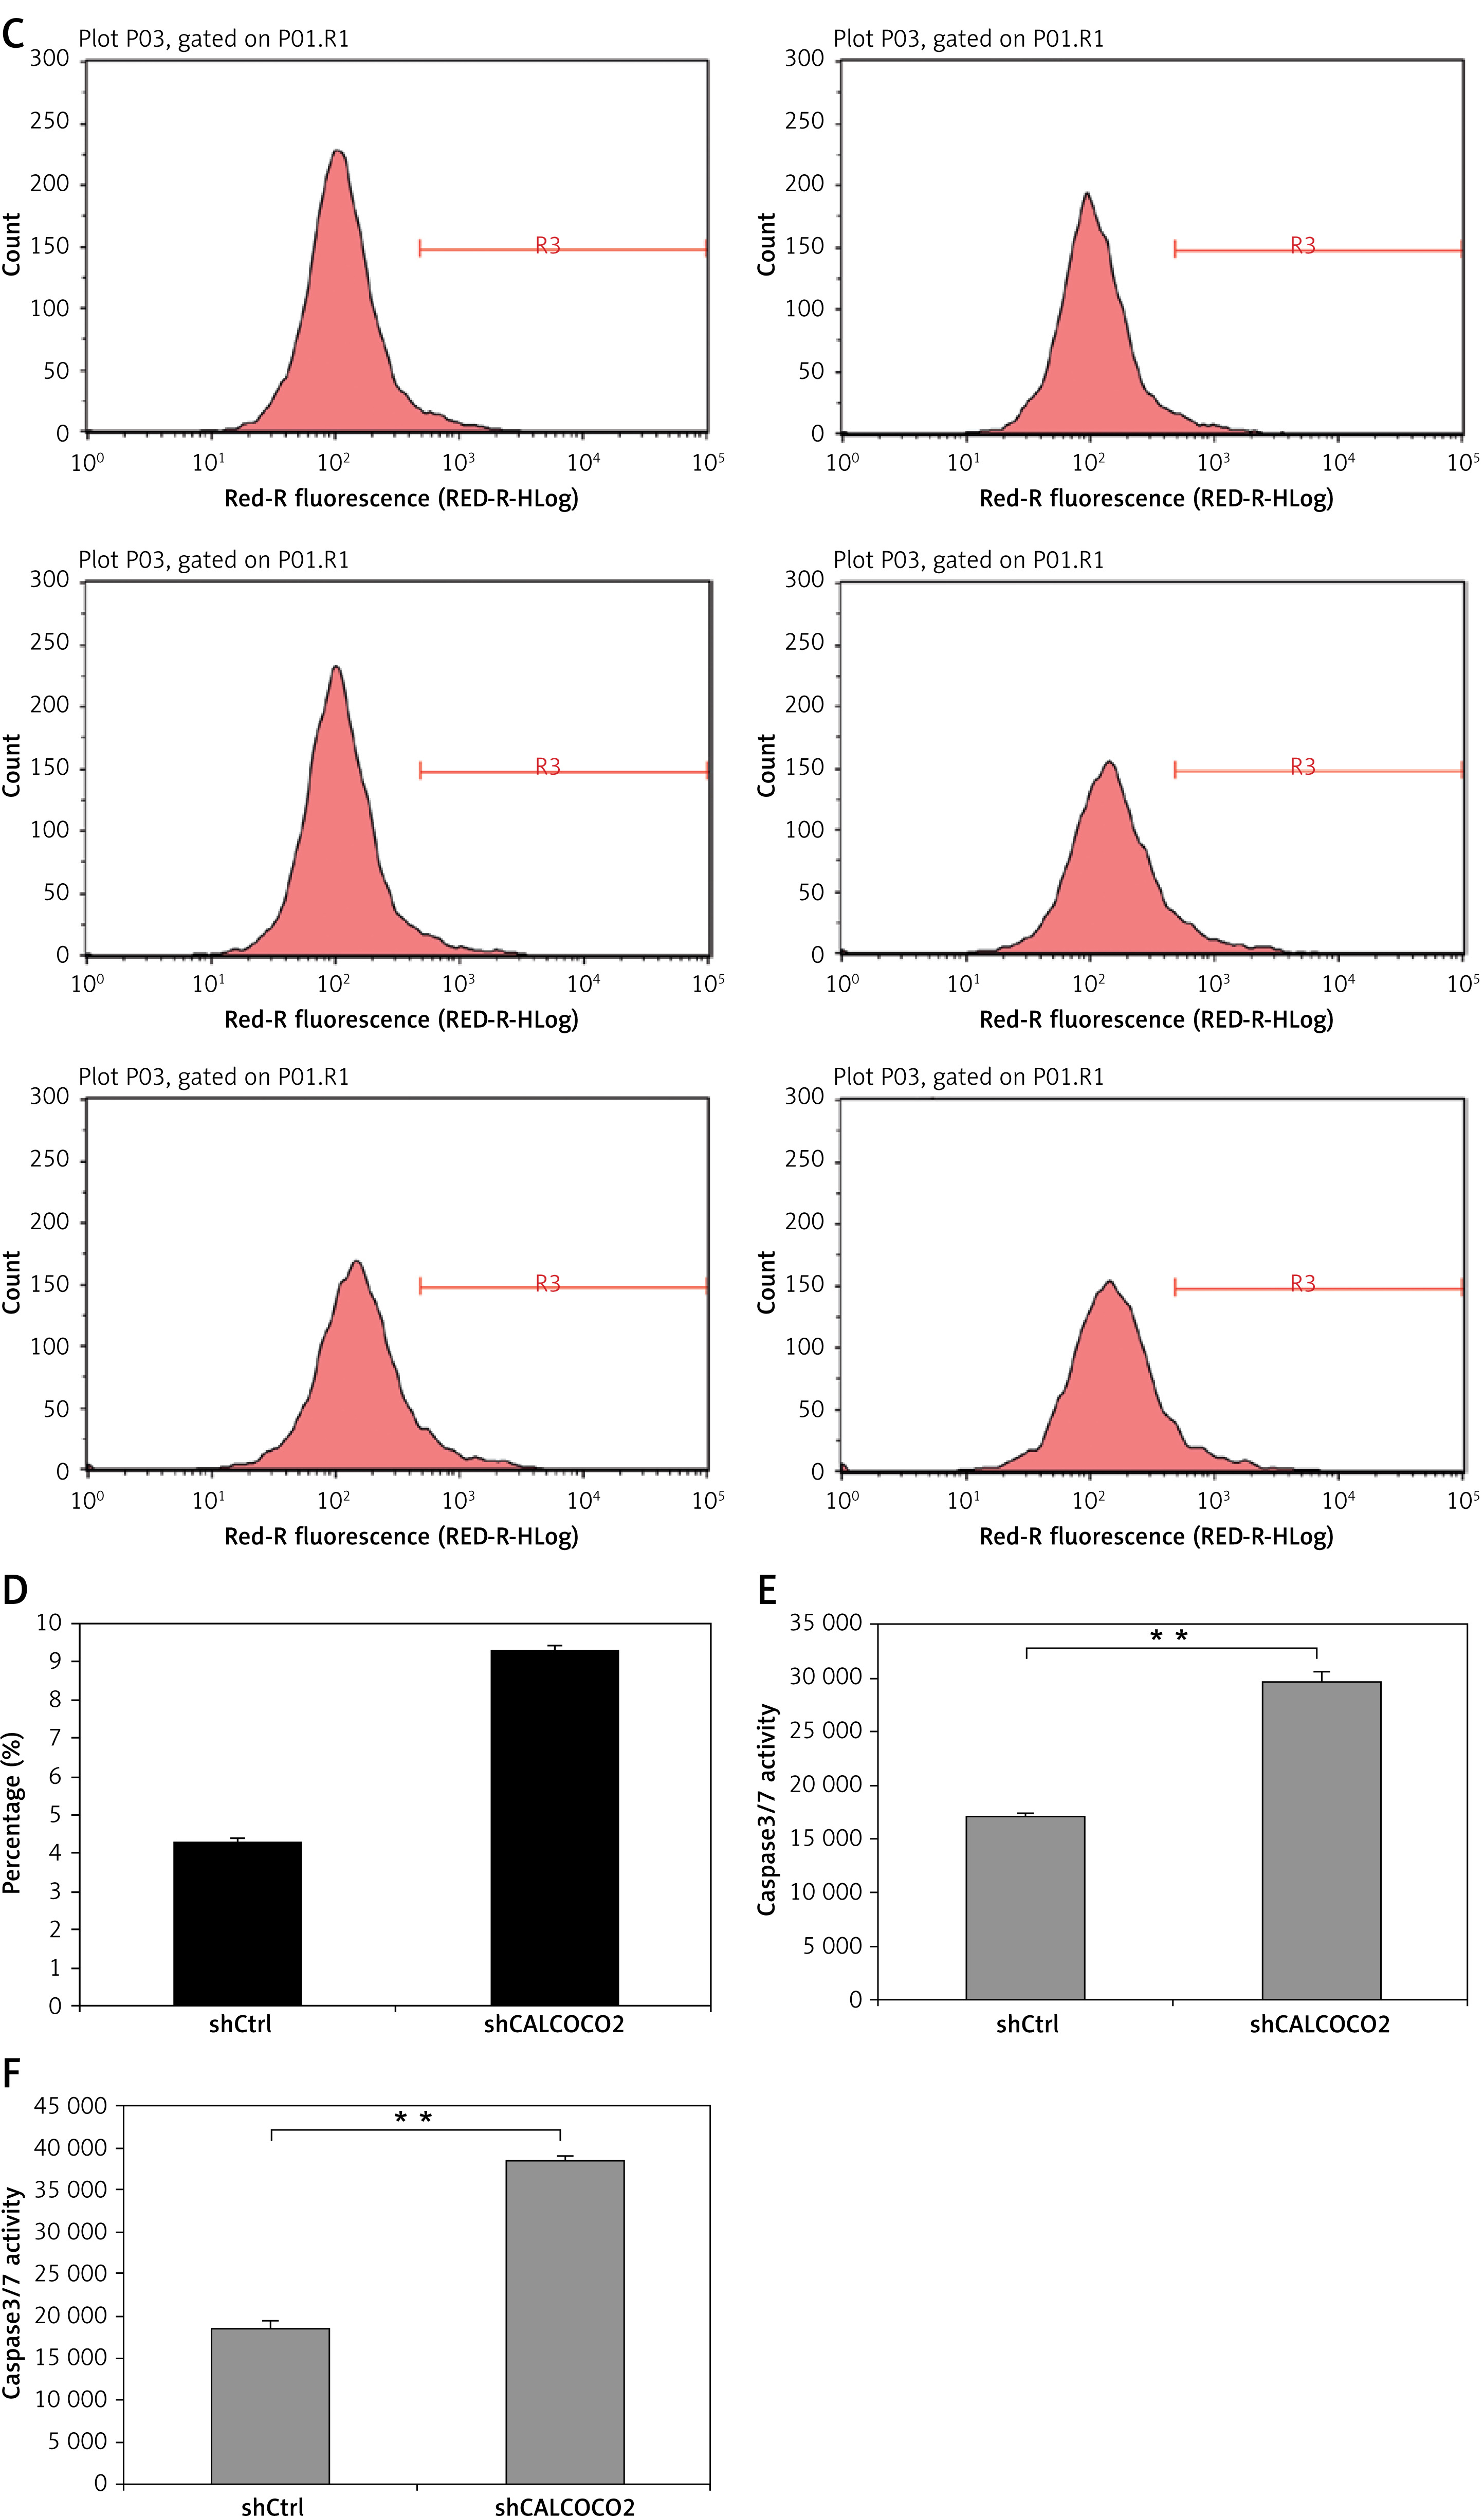
As shown in Figures 3 A–D, the percentages of cell apoptosis in shCALCOCO2-infected U87 and U251 cell lines, as detected by FCM, were 11.44 ±0.1178% and 9.32 ±0.0955%, respectively, on day 4 post-CALCOCO2 silencing, while the shControl group exhibited significantly decreased apoptotic percentages of 4.13 ±0.1308% and 4.3 ±0.1%, respectively (p < 0.001). In addition, caspase3/7 measurements showed that the expression levels of caspase3/7 were approximately 1.72 and 2.07 times greater than those in the shControl group for U87 and U251 cells after infection with shGATAD2A for 3 days (Figures 3 E, F).
Figure 3
Silencing of CALCOCO2 promoted apoptosis in both U87 and U251 cells. A – Cell apoptosis in U87 was analysed by FCM. B – Quantified results of A were presented. C – Cell apoptosis in U251 was analysed by FCM. D – Quantified results of A were presented. E, F – Caspase 3/7 activity assays of U87 and U251 cells
Data are shown as mean ± SD (n = 3; *p < 0.05, **p < 0.01, and ***p < 0.001).
Molecular mechanisms underlying the effects of CALCOCO2 in gliomas
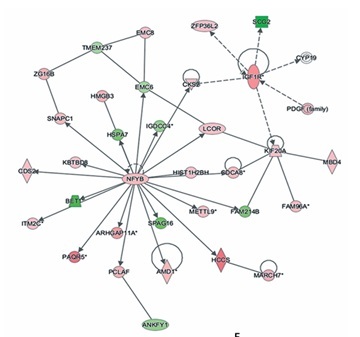
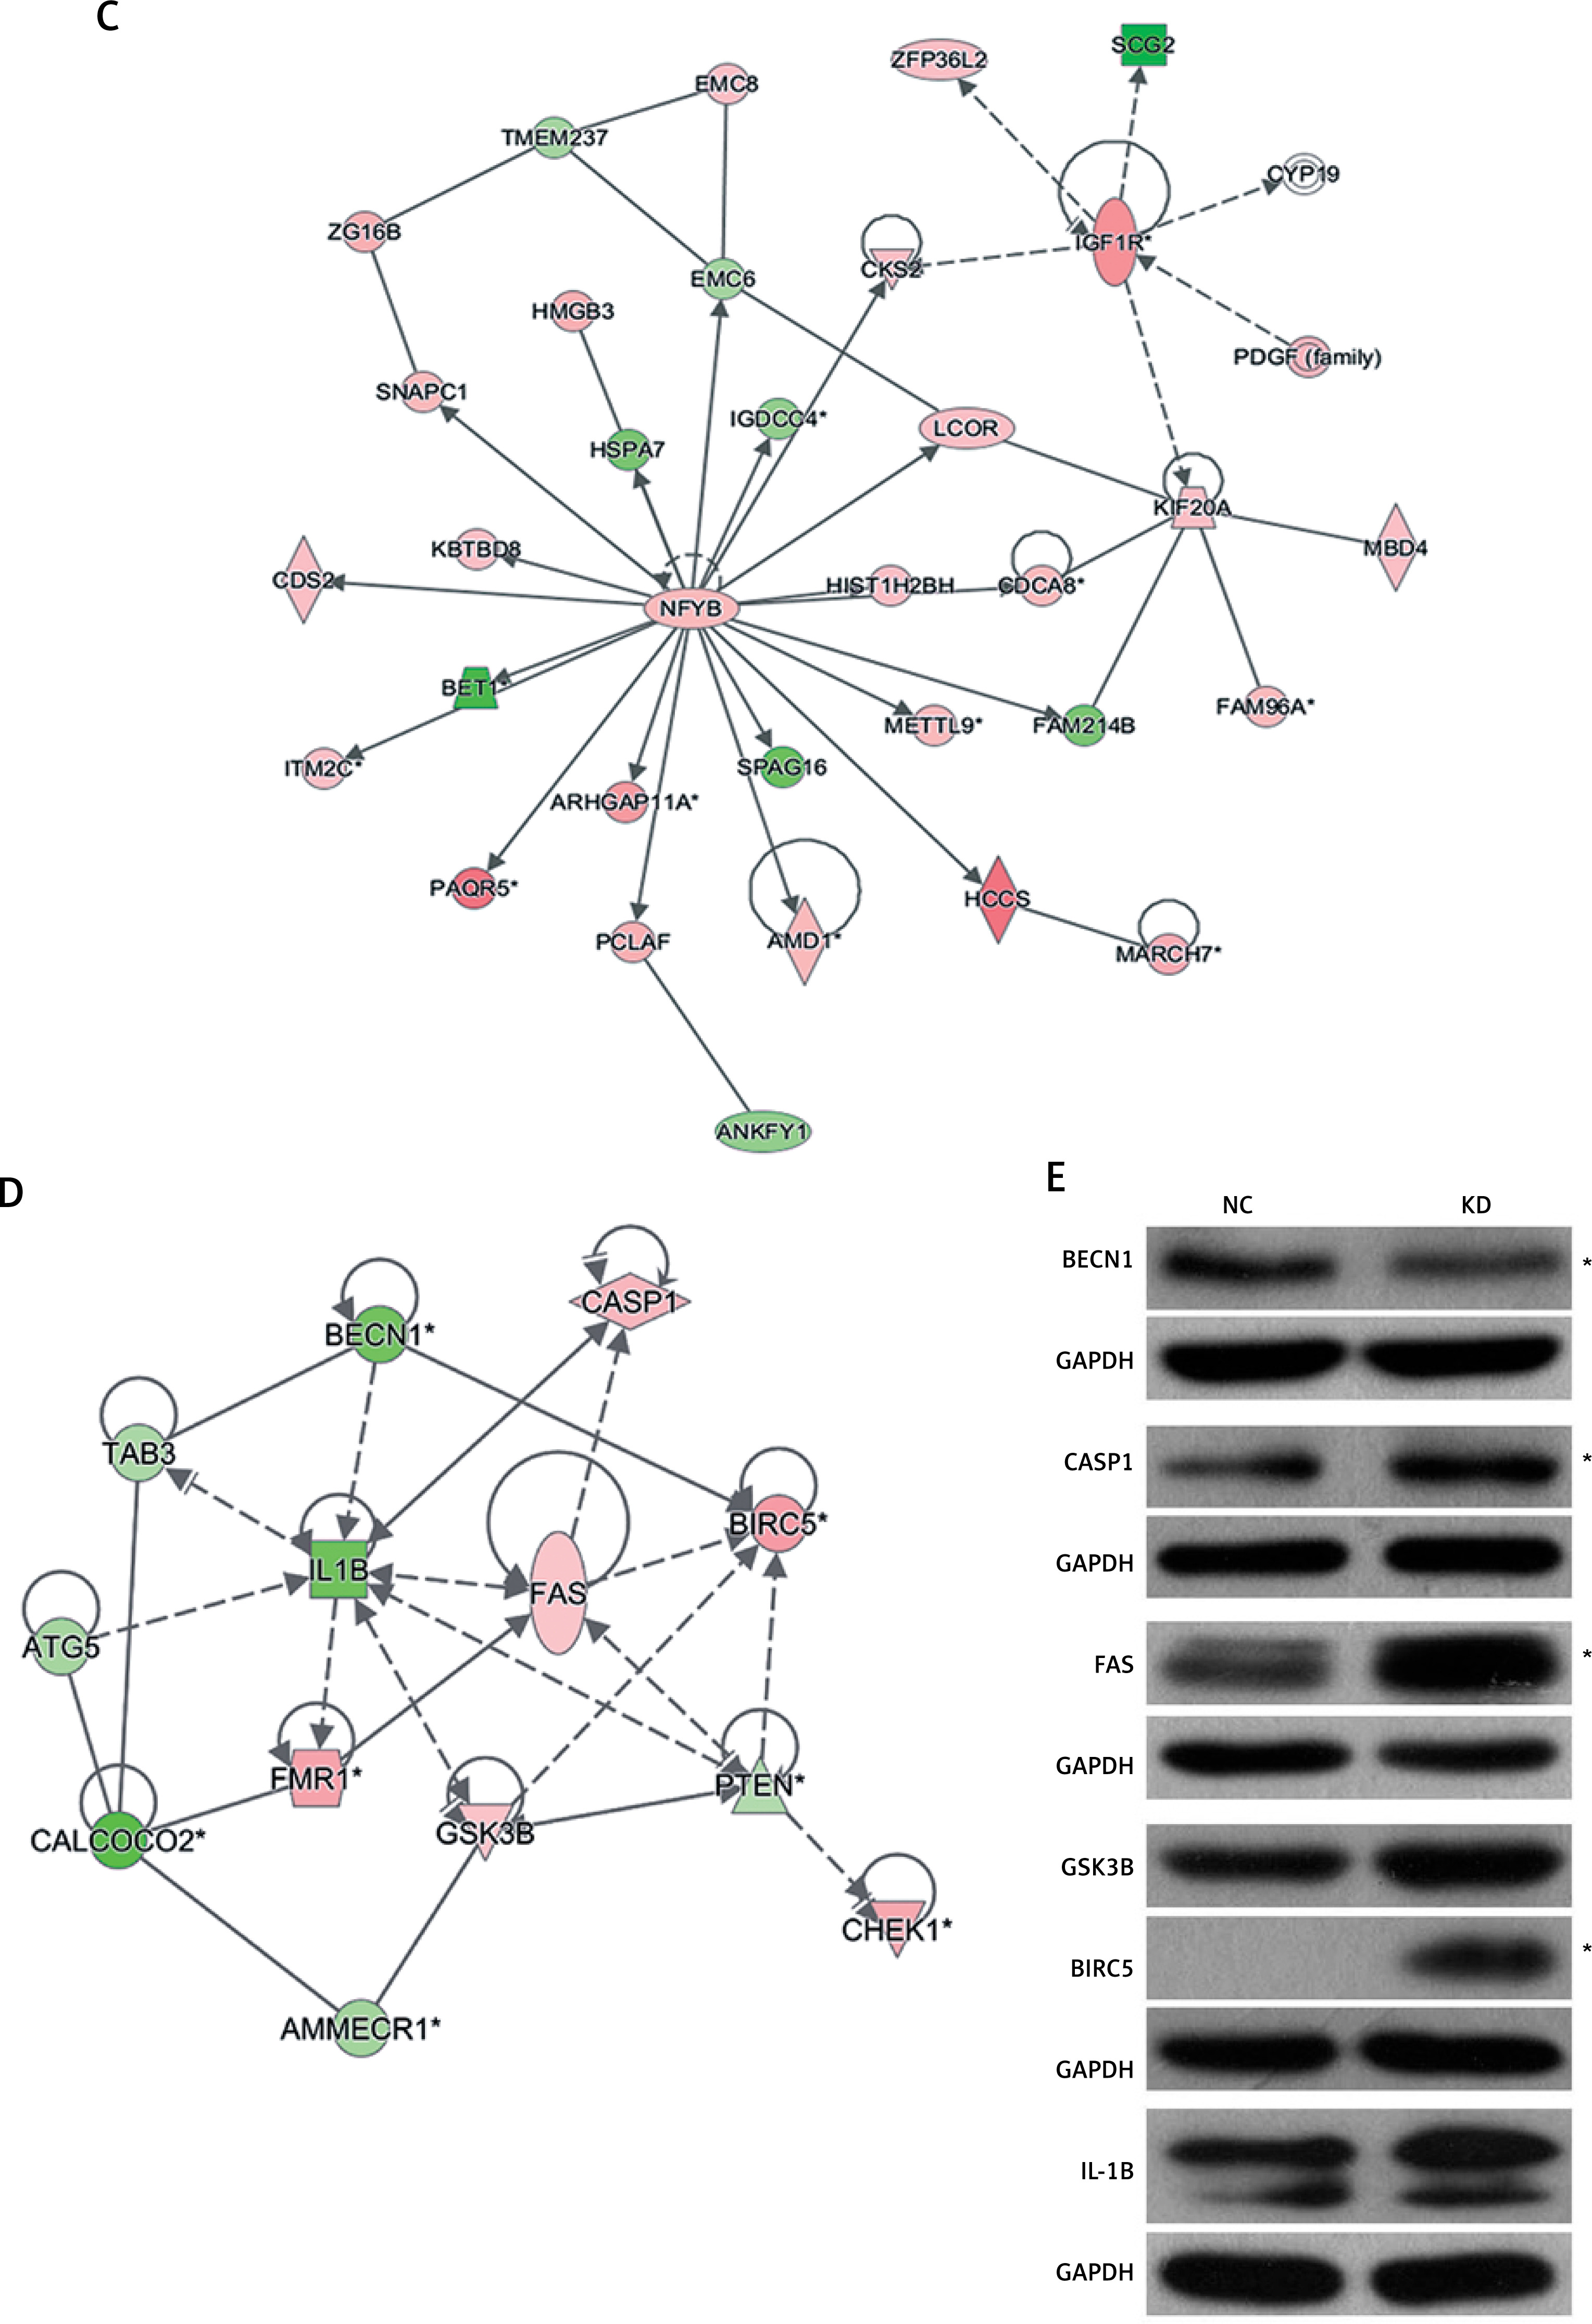
In the gene microarray analysis, there were 586 differentially expressed genes, including 357 genes that were downregulated and 229 genes that were upregulated (Figure 4 A). These discriminative genes were functionally analysed by IPA. As shown in Figure 4 B, 17 CALCOCO2-related functions and diseases were detected by IPA, and infectious diseases, cancer, organismal injury, and abnormalities were the highest ranked categories. The gene interaction network confirmed these results (Figure 4 C). The silencing of CALCOCO2 markedly upregulated CASP1, FMR1, GSK3B, BECR5, CHEK1, and FAS and downregulated the other loci (Figure 4 D). The expression levels of BBECN1, CASP1, FAS, GSK3B, BIRC5, and IL-1β were further analysed by western blotting (Figure 4 E).
Figure 4
Molecular mechanism underlying the effect of CALCOCO2 in glioma pathogenesis and progression. A–D – IPA analysis of differentially expressed genes obtained from the microarray analysis. A – Heat map of differentially expressed genes. B – Z-scores of related functions and diseases. C – Interaction network. Upregulated genes are shown in red, and downregulated genes are shown in green. D – Potential downstream genes influenced by CALCOCO2 by IPA. E – Western blotting analysis
Data are shown as mean ± SD (n = 3; *p < 0.05, **p < 0.01, and ***p < 0.001).
Discussion
CALCOCO2 is a coiled-coil domain-containing protein-coding gene with an important role in autophagy [15]. It serves as an autophagy receptor that interacts with targets and transfers them to autophagosomes by binding to LC3. The abnormal expression of CALCOCO2 is related to inflammation and Crohn’s disease [16]. However, its potential role in tumours, especially gliomas, remains a mystery. U87, U373, U251, and A-172 are common glioma cell lines in the cellular experiments. In the present study, we chose these four cell lines and selected the most abnormally expressed ones to verify the following experiments. Our results showed that CALCOCO2 is overexpressed in these four glioma cell lines, and the expression was highest in U87 and U251 cells, suggesting that it may be an important tumour-associated factor in the pathogenesis and progression of glioma. In the present study, CALCOCO2 was successfully silenced using a lentiviral vector, and the role of CALCOCO2 in cell growth and apoptosis was evaluated in U87 and U251 cell lines. Cell counting and MTT assays demonstrated that the silencing of CALCOCO2 significantly inhibited cell growth and proliferation. These results suggested that CALCOCO2 silencing had antitumor effects via its anti-proliferation functions.
In addition to proliferation, apoptosis also has a profound impact on the pathogenesis and progression of tumours. Apoptosis accomplishes programmed cell death via cell shrinkage and nuclear and DNA fragmentation [17]. Further, multiple human diseases are influenced by apoptosis, including tumours, immunological diseases, sepsis, and neurodegenerative changes [18–21]. Previous studies have demonstrated an important role of apoptosis in glioma; promoting apoptosis of glioma cells is a potential strategy for tumour therapy [22, 23]. In this study, FCM and caspase-glo 3/7 assays indicated that tumour apoptosis increased significantly after CALCOCO2 silencing. Thus, apo-ptosis is a crucial mechanism by which CALCOCO2 influences gliomas.
To further assess the molecular mechanisms underlying CALCOCO2-associated glioma, the U87 glioma cell line was evaluated by a microarray analysis, and the results were analysed by IPA. The silencing of CALCOCO2 influenced the expression of hundreds of genes associated with various functions and diseases. CALCOCO2 was most strongly associated with cancer, supporting the important role of CALCOCO2 in gliomas. Other relevant functions, such as cell cycle, cell death and survival, cell growth, and proliferation, are also correlated with pathogenesis and progression [24, 25]. To further clarify the downstream biological alterations, several genes involved in cancer development were chosen, and a core CALCOCO2 network including multifarious genes related to cancer was mapped. Several cancer-related genes exhibited significant differential expression after the silencing of CALCOCO2. In particular, the well-known pro-apoptosis genes FAS and CASP1 were significantly upregulated and the autophagy-related gene BECN1 was markedly downregulated by CALCOCO2 silencing.
We then used western blotting to investigate the expression of BECN1, CASP1, FAS, GSK3B, BIRC5, and IL-1β at the protein level. FAS is a key death receptor; when combined with FasL, the conformation of FAS is altered, which then triggers the cascade reaction of apoptosis [26, 27]. Interleukin (IL)-1β (IL-1β) is a cytokine in the family of chemokines, also known as lymphocyte stimulating factor [28]. In the cellular process, it is mainly produced by activated mononuclear macrophages and is related to immune response [29, 30]. CASP1 plays a crucial role in innate immunity by activating the proinflammatory cytokine IL-1β [31]. GSK3β is a proline-guided serine/threonine protein kinase involved in energy metabolism, nerve cell development, and body morphogenesis [32]. BIRC5 is a member of the inhibitor of apoptosis (IAP) gene family, which encodes negative regulatory proteins that prevent apoptotic cell death [33, 34]. It has been reported that activating CASP1, FAS, GSK3B, BIRC5, and IL-1β may induce cell apoptosis [35–39]. In this study, the protein levels of CASP1, FAS, GSK3B, BIRC5, and IL-1β were upregulated by the silencing of CALCOCO2, in accordance with the microarray results. These results suggested that the up-regulation of CASP1, FAS, GSK3B, BIRC5, and IL-1β induced by the inhibition of CALCOCO2 result in increased tumour apoptosis. In addition, we detected the significant downregulation of BECN1 after CALCOCO2 silencing. BECN1 is a key autophagy-promoting gene that maintains the balance between cell death and survival [40, 41]. The activation of tumour autophagy is decreased using a BECN1-targeted microRNA [42]. Additionally, the size and number of breast carcinoma cells decrease after the knockdown of BECN1 [43]. Autophagy in tumour cells is activated in response to cellular stress [12]. The silencing of autophagy-related genes can decrease tolerance to extreme external conditions and even contribute to tumour cell death [44–46]. Previous studies have shown that there is a relationship between CALCOCO2 and autophagy [13, 15]. The results of western blotting and gene microarray analyses in this study suggest that the mechanisms underlying CALCOCO2-mediated glioma pathogenesis and progression are also associated with autophagy.
In conclusion, the results of this study demonstrated that the knockout of CALCOCO2 could inhibit glioma by influencing autophagy and promoting apoptosis via the activation of FAS and CASP1.