Colorectal cancer (CRC) is the third most common cancer, accounting for about 10% annually diagnosed tumors worldwide, and it is the second leading cause of death from among all tumors [1, 2]. Given the impairment of quality of life from not only CRC itself but also the treatment’s adverse effects, such as a stoma, it is pivotal to predict a patient’s overall survival (OS).
American Joint Committee on Cancer (AJCC) TNM stage is a typical and extensively used reference for cancer prognosis. However, many studies have revealed that the survival of the same stage CRC patients varied, and a more precise staging system is needed [3–7]. Another choice is to use the Cox proportional hazard model (CPH). But the CPH is a semiparametric model, assuming that a patient’s log-risk of an event (e.g., “death”) is a linear combination of the patient’s covariates, which might be too simplistic to handle time-to-event prediction in the real world [8, 9]. In this regard, some researchers began to set their sights on machine learning algorithms and even deep learning neural networks (NNs). NNs can improve prediction accuracy by discovering relevant features of high complexity [8, 9]. There are 8 popular NN survival theories, such as DeepSurv and CoxCC (Cox case-control corresponding methods). However, no study has compared them yet. At the same time, though there have been some predictive models for CRC, they were mainly based on the CPH, traditional machine learning method or using American clinical data, such as the Surveillance, Epidemiology, and End Results (SEER) database [10–12].
We aimed to compare several survival algorithms based on NN and develop a deep learning survival model for colorectal cancer patients (DeepCRC) using Asian clinical data. It might offer advice for Asian doctors on patients’ therapeutic decisions, to avoid unnecessary treatment and complications such as a stoma.
Methods
Study design and data source
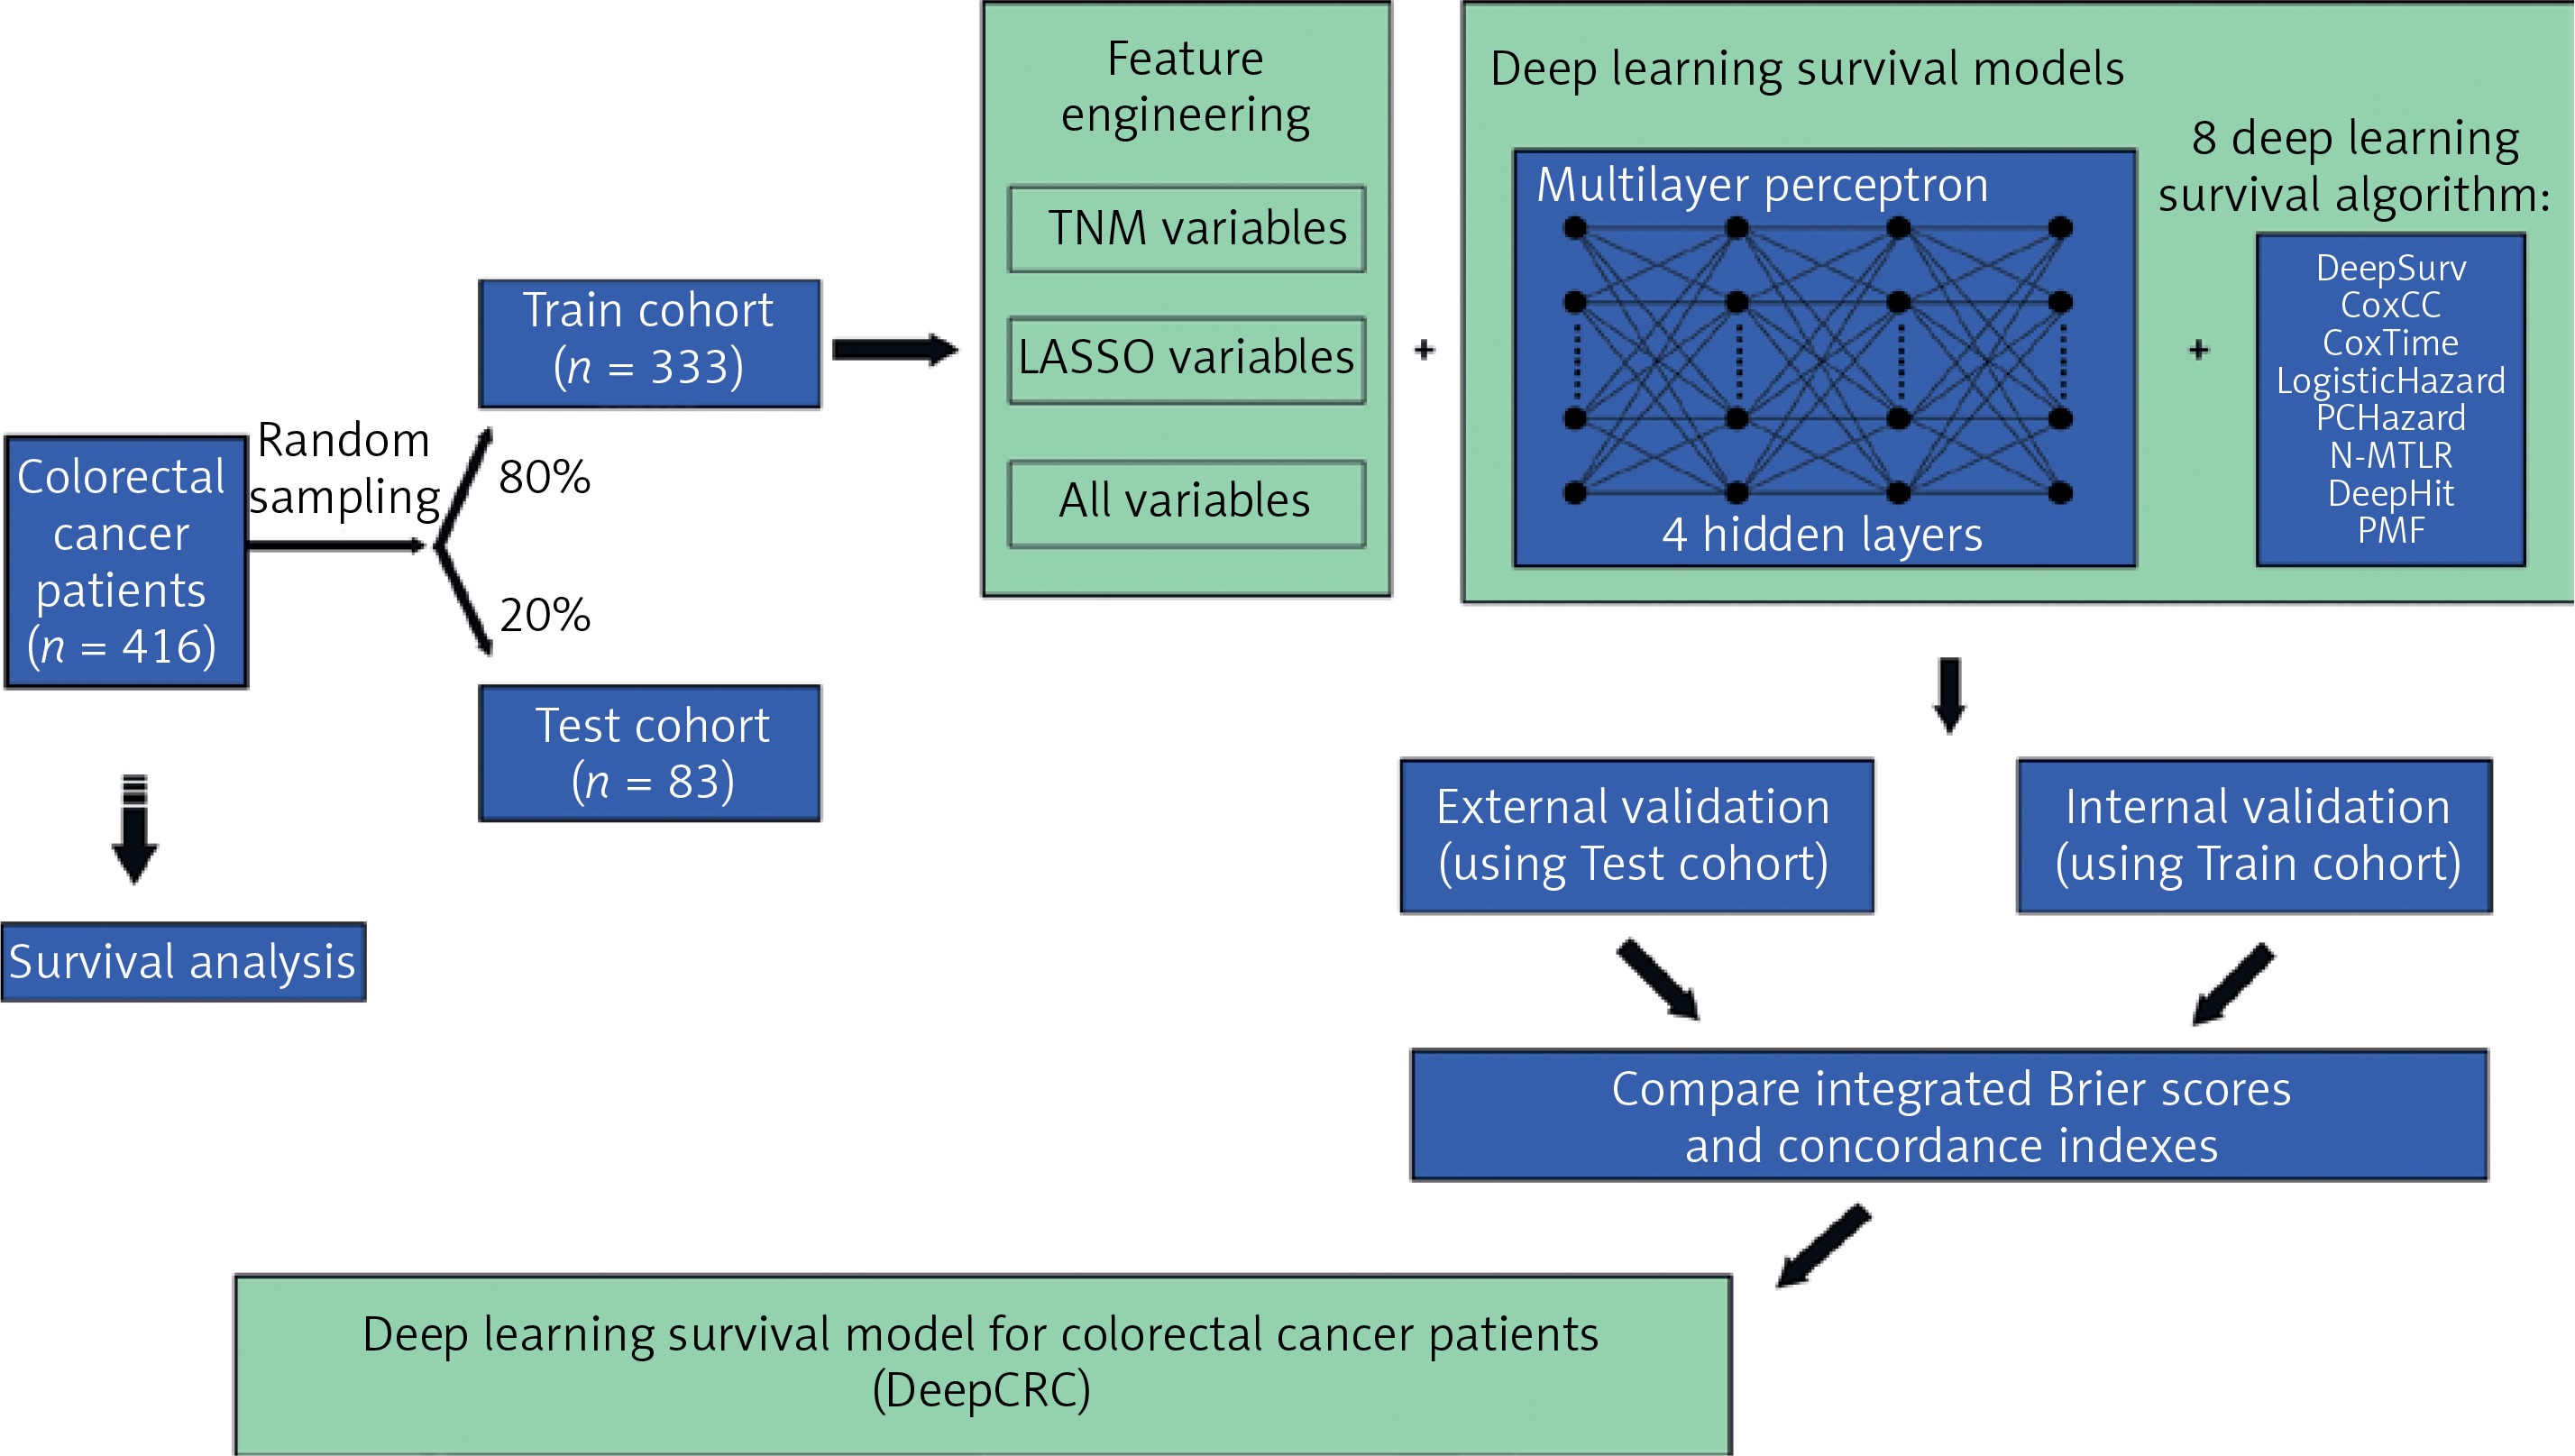
This study was designed as a retrospective cohort study. Patients diagnosed with colorectal cancer in 2006–2014 were included and the last follow-up time was 2018. Raw clinical information was obtained from the biobank of Shanghai Outdo Biotech Company. Multivariate Imputation by Chained Equations was employed to fill in missing values (Supplementary Figure S1). All data were then divided into two cohorts randomly (Figure 1): the training cohort (80% of all) and the test cohort (20% of all). Survival models were trained using the training cohort, with validation by itself and the test cohort.
This study has been approved by the Ethics Committee (No. LW-2022-007) and individual consent for this retrospective analysis was waived.
Model training
Sex, age, size, site, grade, numbers of lymph nodes examined, numbers of positive lymph nodes, T, N, M and stage were all the clinical features included by the authors (abbreviated as ALL variables). Classical TNM variables (T, N, M and stage) were included as input features too, called TNM variables by us. Least Absolute Shrinkage and Selection Operator (LASSO) was adopted to refine variables, filtering non-zero coefficient features as LASSO variables (Age, Size, Site, Grade, Lymph nodes examined, Lymph nodes positive, T, N, M and Stage) (Supplementary Figure S2, Supplementary Table SI). Three group variables were then combined with 8 NN survival algorithms to identify the best one, with traditional Cox models conducted too as a comparison. Before building the models, categorical clinical features were recoded as dummy variables. The Adam algorithm was chosen to be an optimizer. Batch training and batch normalization were used to avoid underfitting, while dropout layers and the early stopping callback function were applied to avoid overfitting when necessary. Dropout layers could silence some neural nodes randomly and the early stopping callback function could end up training when performance did not improve during several epochs. Training curves are shown in Supplementary Figure S3.
Model evaluation
The concordance index (C-index), also known as area under the receiver operating curve (AUC), was the main criterion. The C-index close to 1.0 showed a perfect prediction, while a 0.5 or smaller one tended to randomly guess. Another indicator was the integrated Brier score, whose range was between 0 and 1, with a smaller one or near 0 representing a better performance. Each model was evaluated on the training cohort and test cohort. 1000 times bootstrap (resampling 1000 times from the training or test cohort) was taken to get precise 95% confidence intervals (CIs) of the C-index.
Data processing and statistical analysis
Missing values were visualized and imputation performed by R 4.1.2 with mice and VIM packages. LASSO regression was established with the R package glmnet. NN was constructed with python 3.9.7, pytorch and pycox. R packages (fmsb, RColorBrewer and ggplot2) were used for visualization. Two-sided p < 0.05 was considered statistically significant.
Results
Patient characteristics
Patients diagnosed with CRC in 2006–2014 (n = 416) were stochastically split up into two groups, the training cohort (80% of all, n = 333) and test cohort (20% of all, n = 83) (Figure 1). Table I shows the clinical characteristics of the two cohorts. The median follow-up time of the training cohort was 62 months, with that of the test cohort being 65 months. There were 156 events observed in the training cohort and 30 in the test cohort.
Table I
Demographics and clinical characteristic of two cohorts
Model performance
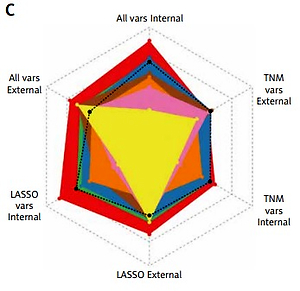
As illustrated in Figure 2 and Table II, TNM variables could not reflect a patient prognosis appropriately enough even using the NN algorithm, with a C-index between 0.4756–0.6957, of which DeepSurv behaved best. When LASSO variables were inputted, the performances were boosted markedly, with the top C-index up to 0.8224 in the training cohort and 0.7491 in the test cohort, from DeepSurv too. All variables were employed to conduct models finally, making some enhancement, for the C-index was determined as 0.8300 in the training cohort and 0.7681 in the test cohort by DeepSurv. Of 3 groups, ALL variables seemed to be the best indicator while DeepSurv showed the greatest potency in predicting patient OS.
Table II
C-index and integrated Brier score of different deep learning survival models
[i] C-index, concordance index. TNM variables: T + N + M + Stage. LASSO variables: Age + Size + Site + Grade + Lymph nodes examined + Lymph nodes positive + T + N + M + Stage. All variables: Sex + Age + Size + Site + Grade + Lymph nodes examined + Lymph nodes positive + T + N + M + Stage. LASSO – Least Absolute Shrinkage and Selection Operator. CoxCC – Cox Case-control Corresponding methods. PCHazard – Piecewise Constant Hazard. N-MTLR, Neural Multi-Task Logistic Regression. PMF – Probability Mass Function.
Figure 2
Performance of 8 neural network algorithms combined with 3 group variables, both internal and external validations. A – The Brier score of them. B – The concordance index of them. C – The radar plot showing the comparison of concordance index among these combinations
C-index – concordance index. TNM vars – T + N + M + Stage. LASSO vars – Age + Size + Site + Grade + Lymph nodes examined + Lymph nodes positive + T + N + M + Stage. All vars – Sex + Age + Size + Site + Grade + Lymph nodes examined + Lymph nodes positive + T + N + M + Stage. CoxCC – Cox Case-control Corresponding methods. PCHazard – Piecewise Constant Hazard. N-MTLR – Neural Multi-Task Logistic Regression. PMF – Probability Mass Function. LASSO – Least Absolute Shrinkage and Selection Operator.
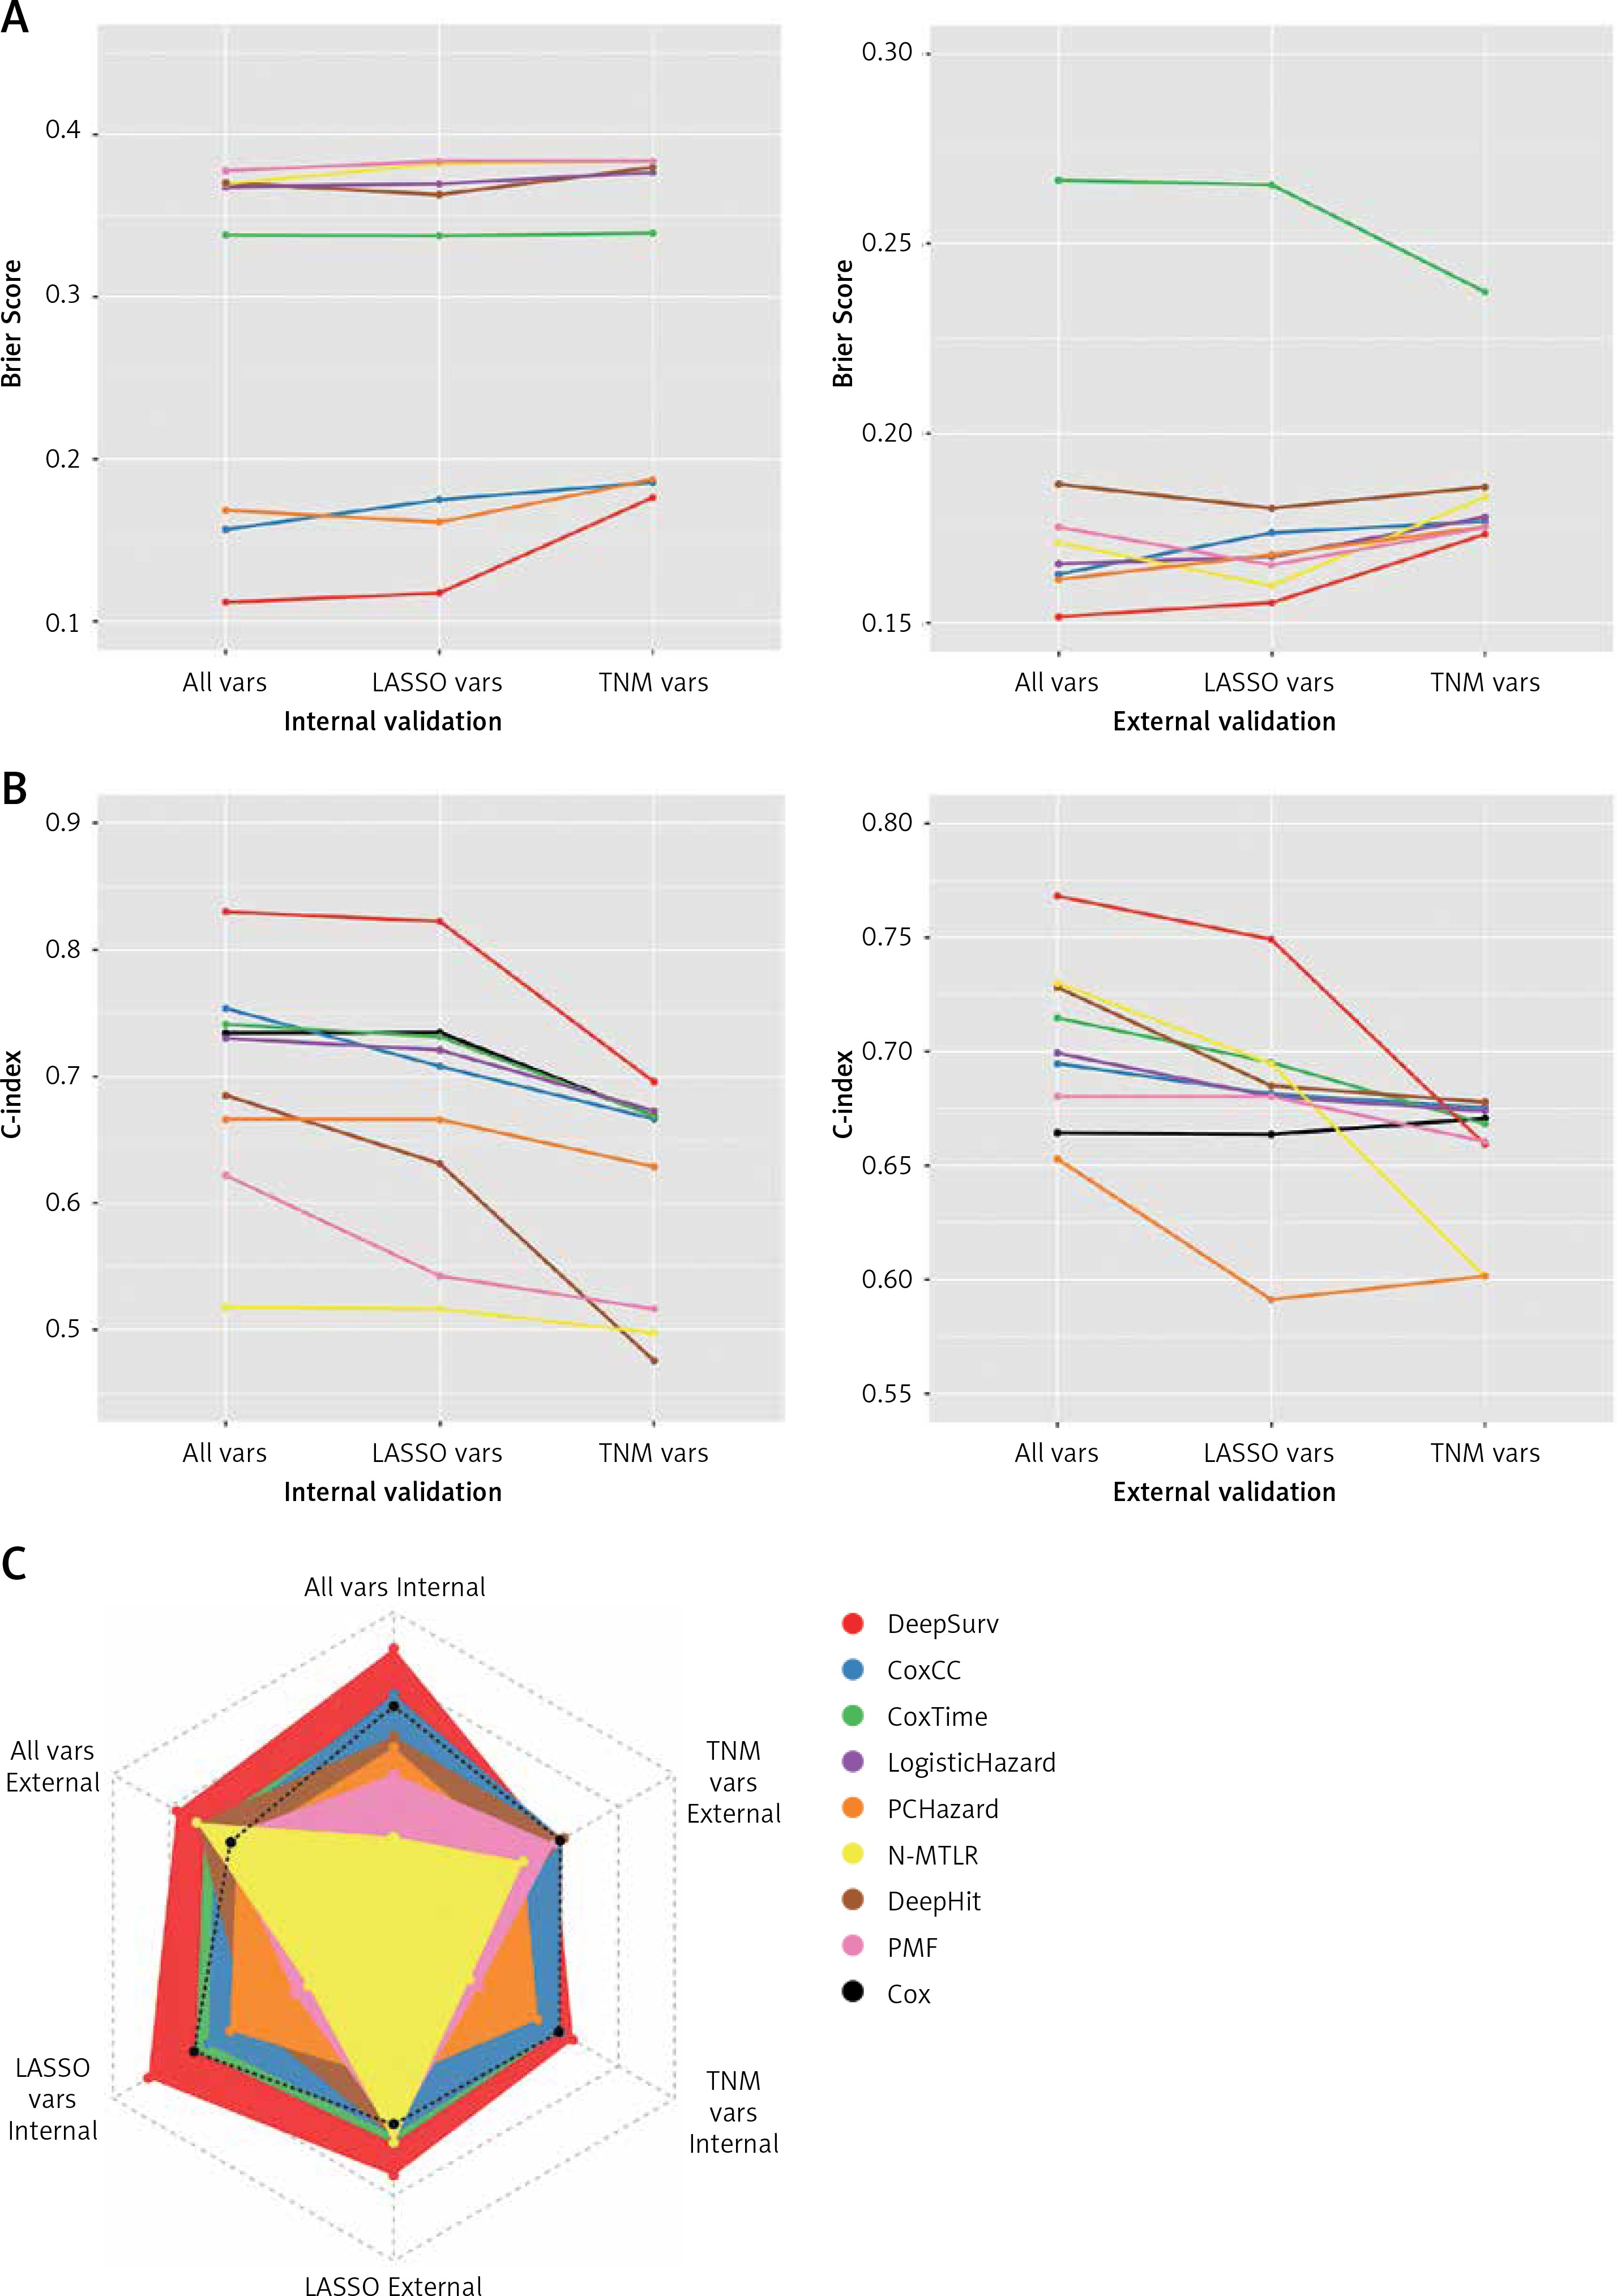
After 1000 times bootstrap, DeepSurv still exhibited the best performance, with the C-index 0.8315 (95% CIs: 0.8297–0.8332) in the training cohort and 0.7719 (95% CIs: 0.7693–0.7745) in the test cohort (Supplementary Table SII).
Discussion
As a semiparametric and linear-assumption model, CPH has inherent limitations in forecasting the real word data. As the top algorithm in the machine learning field, NN has become more and more popular in the medical domain. Typical examples were application for tumor pathology or X-ray computed tomography (CT). Reasonably, researchers hoped to utilize NN to improve the accuracy of predicting cancer patients’ OS. In fact, the NN survival model has shown great potential. For example, to predict urinary continence recovery after robot-assisted radical prostatectomy, Loc Trinh and colleagues compared the Cox and NN survival model DeepSurv (C-index: CPH 0.695, DeepSurv 0.708) [13]. However, there are several NN survival algorithms, but nobody has compared them yet.
Though there are already survival models for CRC, an NN model based on Asian data has not been reported but is needed. Simultaneously, we hoped to identify the best one based on our collected clinical features, by comparing 8 frequent NN survival algorithms. DeepSurv had the highest C-index in all 8 algorithms in both cohorts (0.8300 in the training cohort and 0.7681 in the test cohort). The codes we used have been uploaded to Github, hoping it will offer some help for doctors not only for CRC but also other cancers.
There were some limitations in this study. Family history, lifestyle and some biomarkers are important reasons for colorectal carcinogenesis, possibly influencing prognosis, but they were not considered in this study [14, 15]. The sample size of this study was moderate. It is better to validate DeepCRC using prospective data.
Collectively, this study pioneered the use of 8 NN survival models with real Asian data for predicting CRC patients’ OS. The prediction of OS might offer a reference for doctors on treatment options.
In conclusion, we utilized and compared 8 deep learning survival models to predict CRC patients’ survival (DeepCRC) using Asian data. The DeepCRC model had good performance in predicting CRC patients’ overall survival.