

Introduction
One of the most common malignant tumors that affect women worldwide, breast cancer (BC) has a major influence on life and health [1]. The US is likely to see 310,720 new female BC cases in 2023, with 42,250 deaths anticipated, according to the American Cancer Society (ACS) [2]. For early-stage BC, the 5-year survival rate has significantly increased [3]. Less than 30% of patients with metastatic breast cancer survive, however, due to the intrinsic heterogeneity of the tumor, which frequently causes treatment resistance, post-surgical recurrence, and distant metastasis [4]. This results in a survival rate of less than 30% for patients with metastatic breast cancer [5]. Therefore, enhancing clinical outcomes depends heavily on comprehending the molecular pathways behind the onset and progression of breast cancer as well as discovering novel biomarkers [6, 7].
We have recently investigated the molecular pathways connected to the development of tumors, paying particular attention to the interaction between transfer RNA (tRNA) and messenger RNA (mRNA). Due to its involvement in the initiation and progression of tumors, this relationship is receiving more attention [8, 9]. A hallmark of tumors is aberrant cell proliferation, which is mostly controlled by protein translation pathways. mRNA and tRNA are important players in gene expression [10]. By matching mRNA codons and contributing particular amino acids to the expanding polypeptide chain at the ribosome, tRNA, a subclass of short non-coding RNA (sncRNA), stimulates the synthesis of proteins [11]. Beyond its conventional function in translation, recent research has highlighted that tRNAs in tumor cells can influence mRNA in various ways to regulate protein translation, thereby impacting tumor biological characteristics [12, 13]. Tumor invasion and aberrant proliferation can be encouraged by changes in tRNAs, which can change the rates at which mRNAs are translated [14, 15]. For example, Ma et al. reported that m7G-modified tRNA could enhance the translation of target mRNAs through a codon frequency-dependent mechanism, encouraging lung cancer cell proliferation, invasion, migration, and colony formation – a factor linked to a poor prognosis for patients with lung cancer [16]. Additionally, tRNA-derived microRNAs (miRNAs) act by suppressing the expression of protein-coding genes through sequence complementarity with mRNA [17]. In summary, tRNA influences cancer progression not only through genomic alterations but also by modifying the malignant phenotype of tumors through changes in mRNA. Research on the function of t-mRNAs related to BC prognosis in the onset and progression of breast cancer is still lacking. Despite recent discoveries connecting tRNAs with BC prognosis [14], there remains a lack of research on the role of BC prognosis-associated t-mRNAs in the development and progression of breast cancer.
Machine learning, a significant branch of artificial intelligence in the era of big data, excels at identifying relevant features from large, high-dimensional datasets derived from sequencing studies [18], and is increasingly employed to construct tumor prognosis models [19, 20]. Recognizing the promising prognostic value of tRNA across various tumors [21, 22], our research used ten machine learning methods to generate 101 combinations of machine learning algorithms to identify the t-mRNAs linked with BC prognosis and develop a prognostic model.
Single-cell sequencing enables us to analyze gene expression, mutations, and epigenetic modifications within tumors at the cellular level, shedding light on tumor heterogeneity and the complexity of tumor cell evolution. However, in practice, scRNA-Seq is mostly confined to studying individual cancer types. By integrating single-cell sequencing with pan-cancer analysis, we can uncover potential common driver genes across different cancers and identify subpopulations with similar gene expression profiles, deepening our understanding of cancer development mechanisms. In our study, we also tested the model’s efficacy in different cancers, achieving favorable outcomes.
Material and methods
Gathering and processing public data
We obtained target tRNAs associated with the prognosis of BC from the OncotRF database (http://bioinformatics.zju.edu.cn/OncotRF). We downloaded the GSE20711 and GSE20685 datasets, which include the expression profiles of 92 and 327 breast cancer patients’ tumor and normal tissues, from the Gene Expression Omnibus (GEO) database (https://www.ncbi.nlm.nih.gov/geo//). For the purpose of developing and validating our risk model, we accessed data on BC patients from TCGA-BRCA, including 64 patients with metastases and 19 patients with original tumors, from The Cancer Genome Atlas (TCGA) database (https://tcga-data.nci.nih.gov/tcga/). In order to investigate potential relationships between t-mRPM (t-mRNA related prognostic model) and its model genes across various cancers, we also obtained the processed RNA-Seq data of 32 solid malignant tumor types from the UCSC Xena database (https://xena.ucsc.edu/). For an extensive pan-cancer analysis, the 32 processed scRNA-Seq datasets and annotations of 32 solid malignant tumor types were additionally acquired from the TISCH2 database (http://tisch.comp-genomics.org). The TISCH2 database has already undergone quality control, normalization, unsupervised clustering, and cell type annotation for these datasets.
Screening and functional analysis of t-mRNA related to BC prognosis
Using the OncotRF database, we screened tRNAs differentiating breast cancer from normal tissues that influence prognosis, selecting from 3ʹ-tRF and 5ʹ-tRF sequences. We calculated Spearman correlation coefficients between these tRNAs and mRNA expression profiles, defining t-mRNAs as those with a correlation coefficient > 0.4 and p < 0.01, which were then visualized using Cytoscape [23]. We used Kyoto Encyclopedia of Genes and Genomes (KEGG) pathway analysis to comprehend the biological roles of these mRNAs [24].
Identification of differentially expressed t-mRNA related to BC prognosis
We first screened prognosis-related genes from t-mRNAs using the Boruta algorithm [25], a random forest-based method for feature ranking and selection, to screen prognosis-related genes from t-mRNAs. Next, we examined the mRNA expression matrix between BC samples and normal breast samples using the “limma” package [26]. A false discovery rate (FDR) < 0.05 and an absolute log2 (fold change) > 1 were the requirements assigned for finding differentially expressed mRNAs (DEmRNAs). From these results, we obtained BC-related genes and the selected t-mRNA genes. By intersecting these genes, we acquired DEt-mRNAs for further analysis.
Construction of t-mRPM using machine learning-based integrative approaches
Ten machine learning algorithms and their 101 combinations were applied to guarantee great accuracy and stability of our t-mRPM. Among them were the following: supervised principal components (SuperPC), generalized boosted regression modeling (GBM), random survival forest (RSF), elastic net (Enet), Lasso, Ridge, stepwise Cox, CoxBoost, and survival support vector machine (survival-SVM). Based on the highest average concordance index (C-index), the best model was chosen. We used three datasets (TCGA-BRCA, GSE20711, and GSE20685) for Kaplan-Meier analysis in order to verify the stability and reproducibility of the model. The results were displayed using survival curves. Additionally, we plotted the model’s 1-year, 3-year, 5-year, 7-year, and 9-year ROC curves to evaluate the predictive performance.
Association of clinical-pathological features and construction and validation of the nomogram
We examined the relationship between the risk model and pathological features in order to assess the clinical value of t-mRNA. Additionally, we analyzed the gene expression patterns across several pathological features in the risk model, which were shown in a heatmap. Furthermore, the TCGA BC metastasis database was used to evaluate the predictive potential for metastasis of BC patients. The model was then integrated with clinical-pathological variables to produce the nomogram, and calibration and decision curves were used to assess the nomogram’s clinical efficacy.
Gene set variation analysis (GSVA) and single-sample gene set enrichment analysis (ssGSEA)
The R package “GSVA” [27] was used in our investigation to calculate scores for fifty HALLMARK pathways. The “limma” program was then used to examine pathways that showed notable variations between high- and low-risk groups. In order to determine the contribution of tumor-related molecular mechanisms in different risk groups, we used the R package “clusterProfiler” [28] to perform a GSEA of HALLMARK gene sets with FDR < 0.25 and |NES| > 1.
Immune feature correlation analysis
Using ssGSEA, we evaluated the variations in immune-related pathways between the groups [29]. The CIBERSORT and xCell algorithms [30] were used to quantify the relative abundance of tumor-infiltrating immune cells (TIICs) within tumor samples. Based on recent advances in immunotherapy for BC [31], we used the IMgor210 dataset to predict the effects of immunotherapy in BC patients using our model.
Performance of the risk model and its genes in pan-cancer
We sought to further assess the performance of the model and its genes regarding expression, mutations, copy number variations, and methylation across various cancers. Additionally, we examined the impact of the t-mRPM on the prognosis of different cancers, affirming the model’s broad applicability across various tumor types. We also assessed the relationship between the model and features of tumor malignancy such as the cell cycle, angiogenesis, and epithelial–mesenchymal transition (EMT).
Expression of model genes at the pan-cancer single-cell level
We obtained single-cell gene expression information from the TISCH2 database, which was used to investigate the relationship between the tumor microenvironment and t-mRNA by examining the single-cell expression of model genes in 32 distinct solid malignant cancer types.
Quantitative real-time PCR (RT-qPCR)
Human mammary epithelial cells (HS578BST) and breast cancer cell lines (MDA-MB-231 and MCF-7) were procured from Fenghui Biotechnology Co., Ltd. (Hunan, China). These cells were maintained in DMEM medium supplemented with 10% fetal bovine serum (Gibco) and incubated at 37°C with 5% CO2. Total RNA was isolated from cultured cells using TRIzol reagent (Tiangen, Beijing, China) according to the manufacturer’s protocol. Then the total RNA was reverse-transcribed into cDNA using RevertAid Reverse Transcriptase (Thermo Fisher Scientific, Waltham, MA, USA). The RT-qPCR analysis was subsequently carried out on the ABI QuantStudio 1 Plus instrument using PerfectStart Green qPCR SuperMix. The reaction conditions were as follows: initial denaturation at 94°C for 35 s, annealing at 60°C for 15 s, and extension at 72°C for 10 s. Relative gene expression levels were quantified using the 2–∆∆Ct method. The primers used in this study were designed by Pulateze Biotech (Hunan, China), as listed in Table I.
Table I
RT-qPCR primer sequences used in the study
Statistical analysis
R software (version 4.1.1) was used for the analysis. Pearson’s χ2 test was utilized to assess categorical data, and one-way ANOVA was employed to investigate continuous variables. A p-value of less than 0.05 was considered statistically significant. The OS of individuals with breast cancer was examined using the Kaplan-Meier method. Cox regression models, both univariate and multivariate, were used to find independent predictive markers and clinical features that varied significantly between patient groups. Using the Mann-Whitney U test, differences in immune cell infiltration were evaluated. Statistical significance was defined as p-values < 0.05 (*p < 0.05, **p < 0.01, ***p < 0.001, ns: not significant).
Results
Identification of DEt-mRNAs
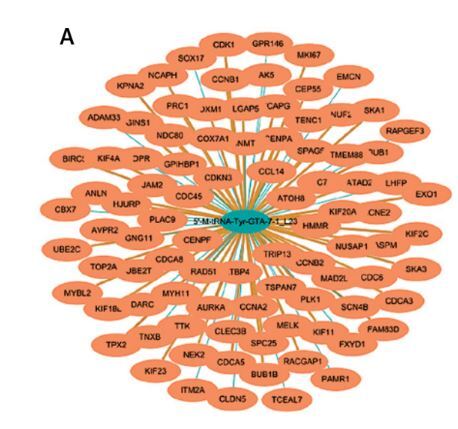
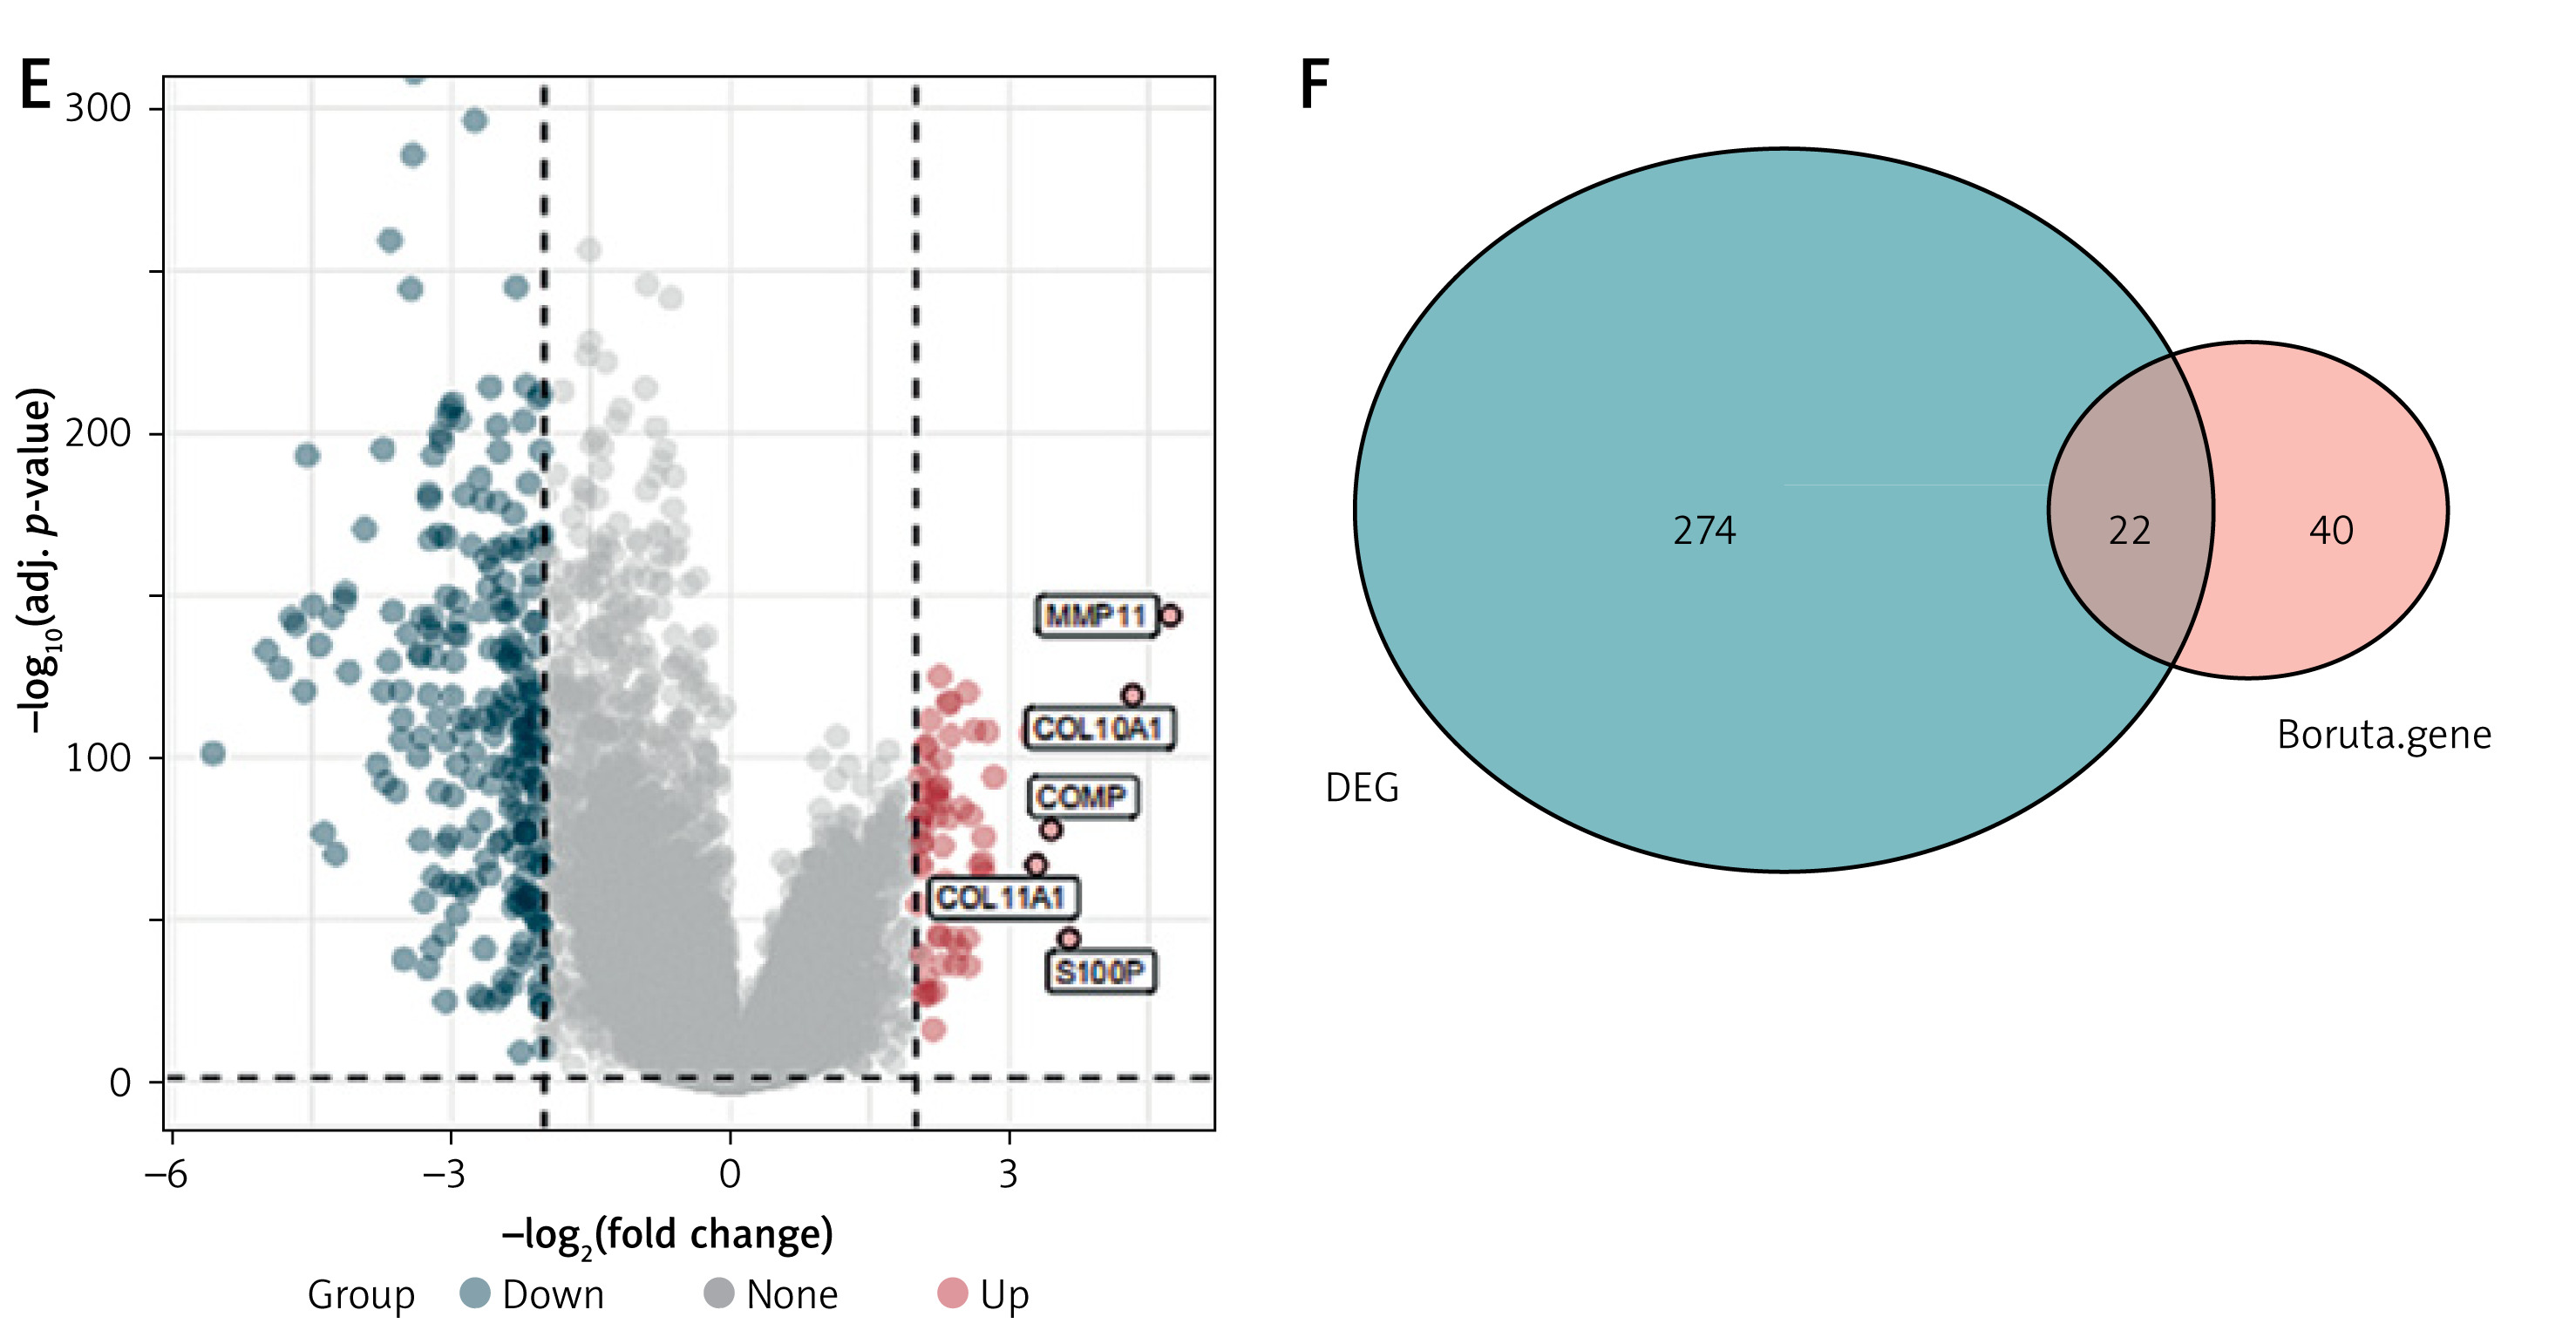
Using the OncotRF database, we first chose a prognostically significant tRNA (5ʹ-M-tRNA-Tyr-GTA-7-1_L23) in BC. We next calculated the Spearman correlation coefficient to find 92 mRNAs that were significantly associated with this tRNA (Figure 1 A). Meanwhile, we also found that these t-mRNAs are mainly involved in pathways that include the cell cycle, infection of the human T-cell leukemia virus, the p53 signaling pathway, maturation of oocytes through progesterone, meiosis of oocytes, cellular senescence, leukocyte transendothelial migration, and the FoxO signaling pathway (Figure 1 B). We identified 62 genes associated with BC prognosis using the Boruta method (Figures 1 C, D). In TCGA-BRCA cohorts, we found 296 DE-mRNAs, which were visualized in a volcano plot (Figure 1 E). Notably upregulated genes in this plot include MMP11, COL10A1, COMP, COL11A1, and S100P. Finally, these 62 prognostic genes were intersected with the DE-mRNAs using a Venn diagram (Figure 1 F), yielding 22 key genes that were designated as DEt-mRNAs.
Figure 1
Identification of DEt-mRNA. A – t-mRNA related network diagram. B – Biological process involvement by t-mRNA. C – t-mRNAs related to BC prognosis: identified by the Boruta algorithm. D – Feature selection detail diagram: shows t-mRNAs selected by the Boruta algorithm across different iterations E – Volcano plot: displays DE-mRNAs between normal and tumor tissues in BC patients. F – Venn diagram: used to identify common genes between differentially expressed genes (DEGs) and t-mRNAs in BC
Construction and validation of t-mRPM
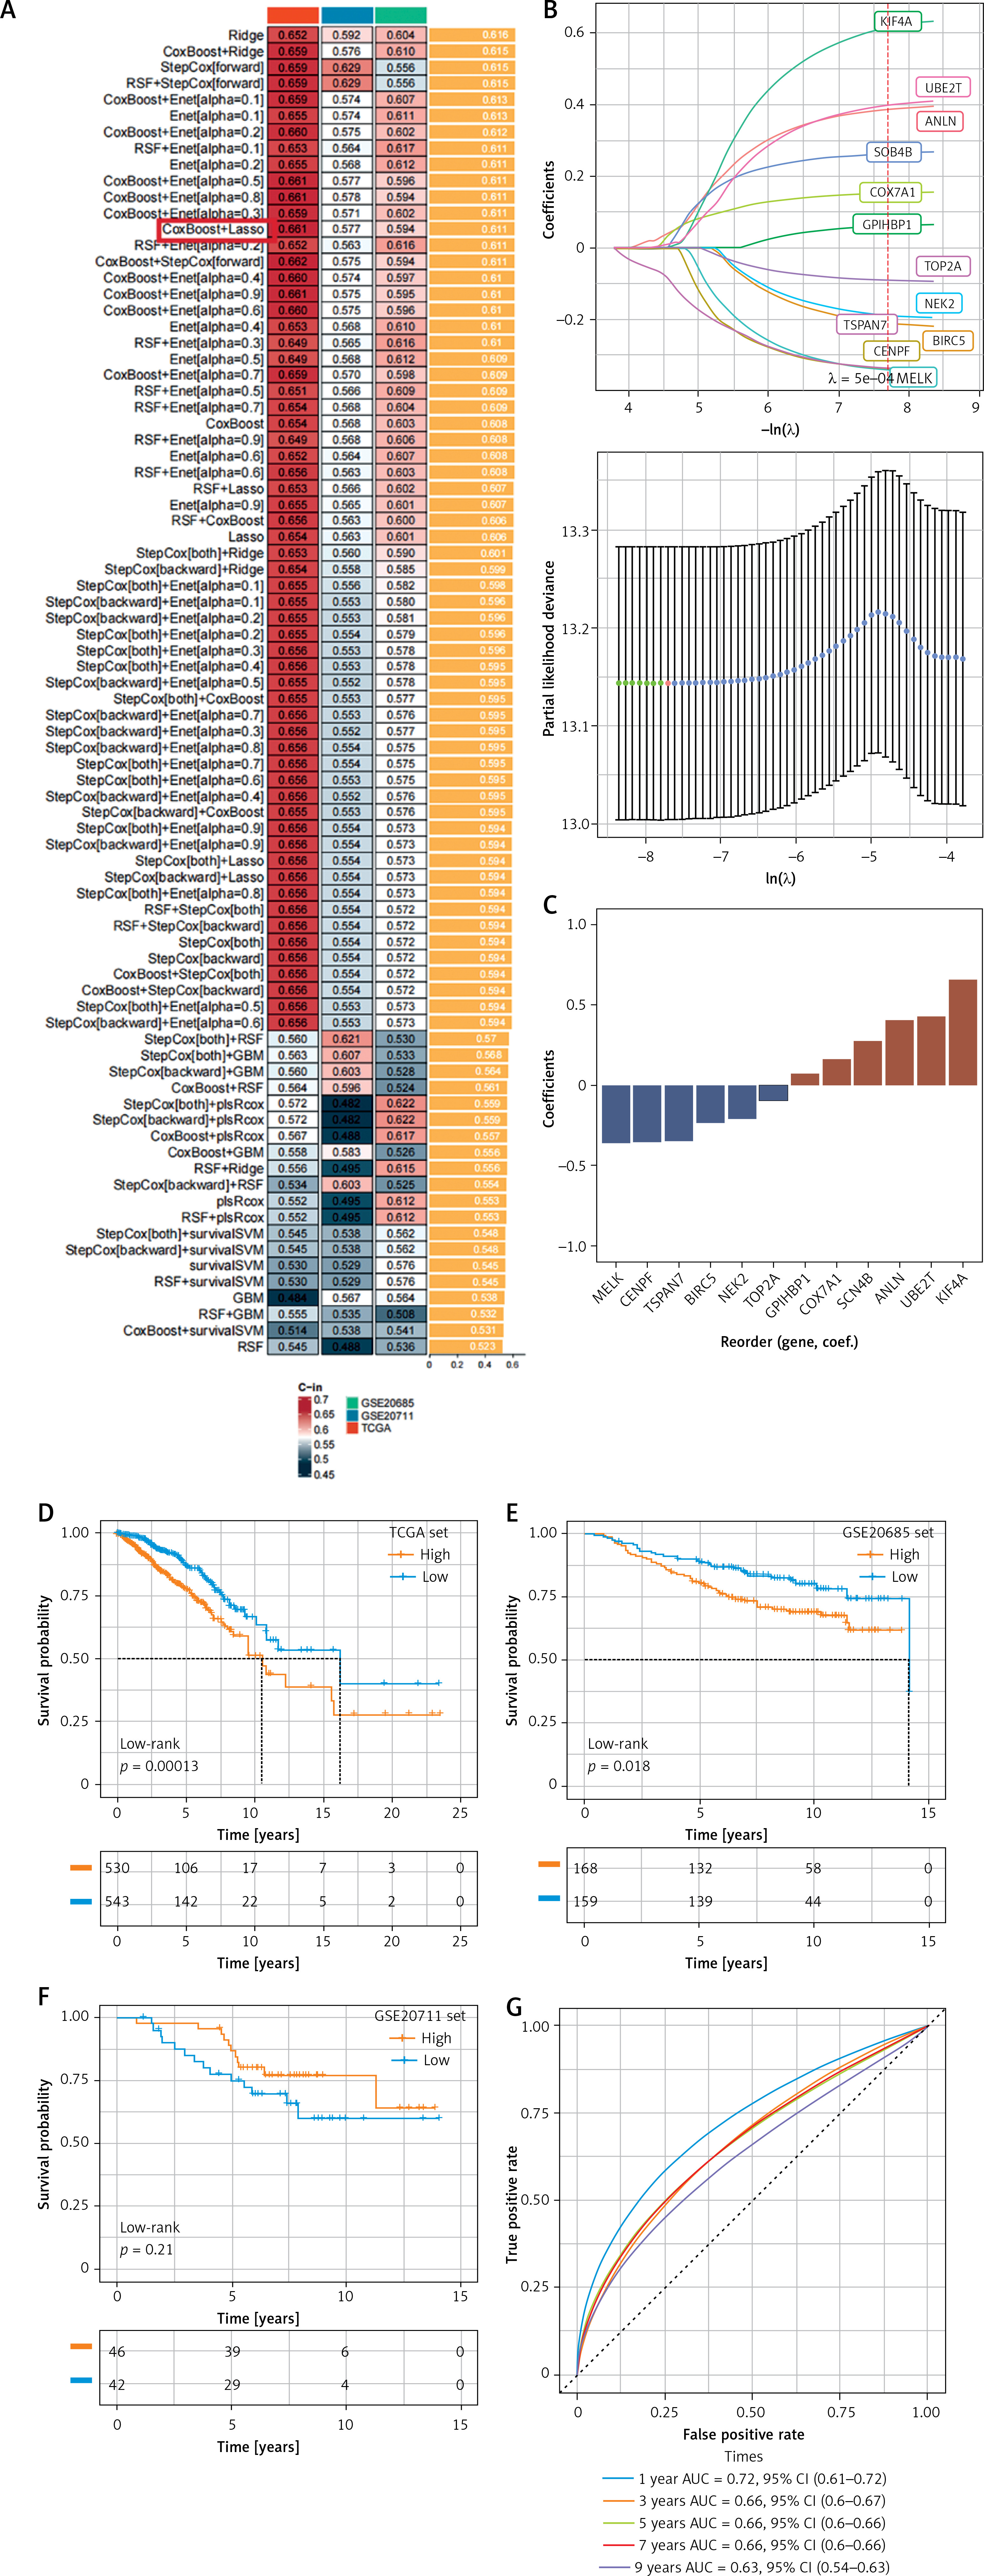
An integrative technique based on machine learning was applied to the 22 DEt-mRNAs in order to generate a consensus tRNA-related mRNA signature. Even though Ridge had the greatest average C-index (0.616), we decided that the Lasso and CoxBoost combo was the best algorithm pair. This combination achieved the greatest average C-index value, 0.611, among all combinations that incorporated Lasso, which affected the decision. Additionally, the combination was required to obtain coefficient values from Lasso regression for a subsequent pan-cancer study (Figure 2 A). According to the LOOCV framework (Figure 2 B), the optimal λ for the Lasso regression was found at the point where the partial likelihood deviance was lowest. A definite collection of 12 t-mRNAs was identified by applying CoxBoost proportional hazards regression analysis to t-mRNAs with nonzero Lasso coefficients. These t-mRNAs are MELK, CENPF, TSPAN7, BIRC5, NEK2, TOP2A, GPIHBP1, COX7A1, SCN4B, ANLN, UBE2T, and KIF4A (Figure 2 C). Next, the expression levels of these 12 t-mRNAs, weighted by their regression coefficients in the CoxBoost model, were used to calculate the risk score for each BC patient, referred to as the t-mRPM score. The ‘survminer’ R package was implemented to determine the optimal cutoff value, classifying BC patients into high-risk and low-risk groups. As demonstrated in the TCGA training dataset and the GSE20585 validation set, overall survival was significantly lower in the high-risk group compared to the low-risk group (p < 0.05) (Figures 2 D–F). However, in the GSE20711 validation set, there was no significant difference in survival rates between the high- and low-risk groups (p = 0.21), likely due to the smaller sample size of this validation cohort. ROC analysis assessed the discrimination capability of t-mRPM, with 1-, 3-, 5-, 7-, and 9-year AUC values of 0.72, 0.66, 0.66, 0.66, and 0.63, respectively, in TCGA-BRCA, indicating the model’s effective predictive power for the OS of BC patients across these time points (Figure 2 G).
Figure 2
Construction and validation of t-mRPM. A – 101 different kinds of prediction models were created using the LOOCV framework. B – Logarithmic sequence graph (λ) illustrating the t-mRNA by LASSO regression analysis. C – CoxBoost regression coefficients for the last set of 12 t-mRNAs D–F – Kaplan-Meier curves for OS based on t-mRPM in several datasets. G – The optimal model’s ROC curves
Correlation between t-mRPM score and clinical-pathological features
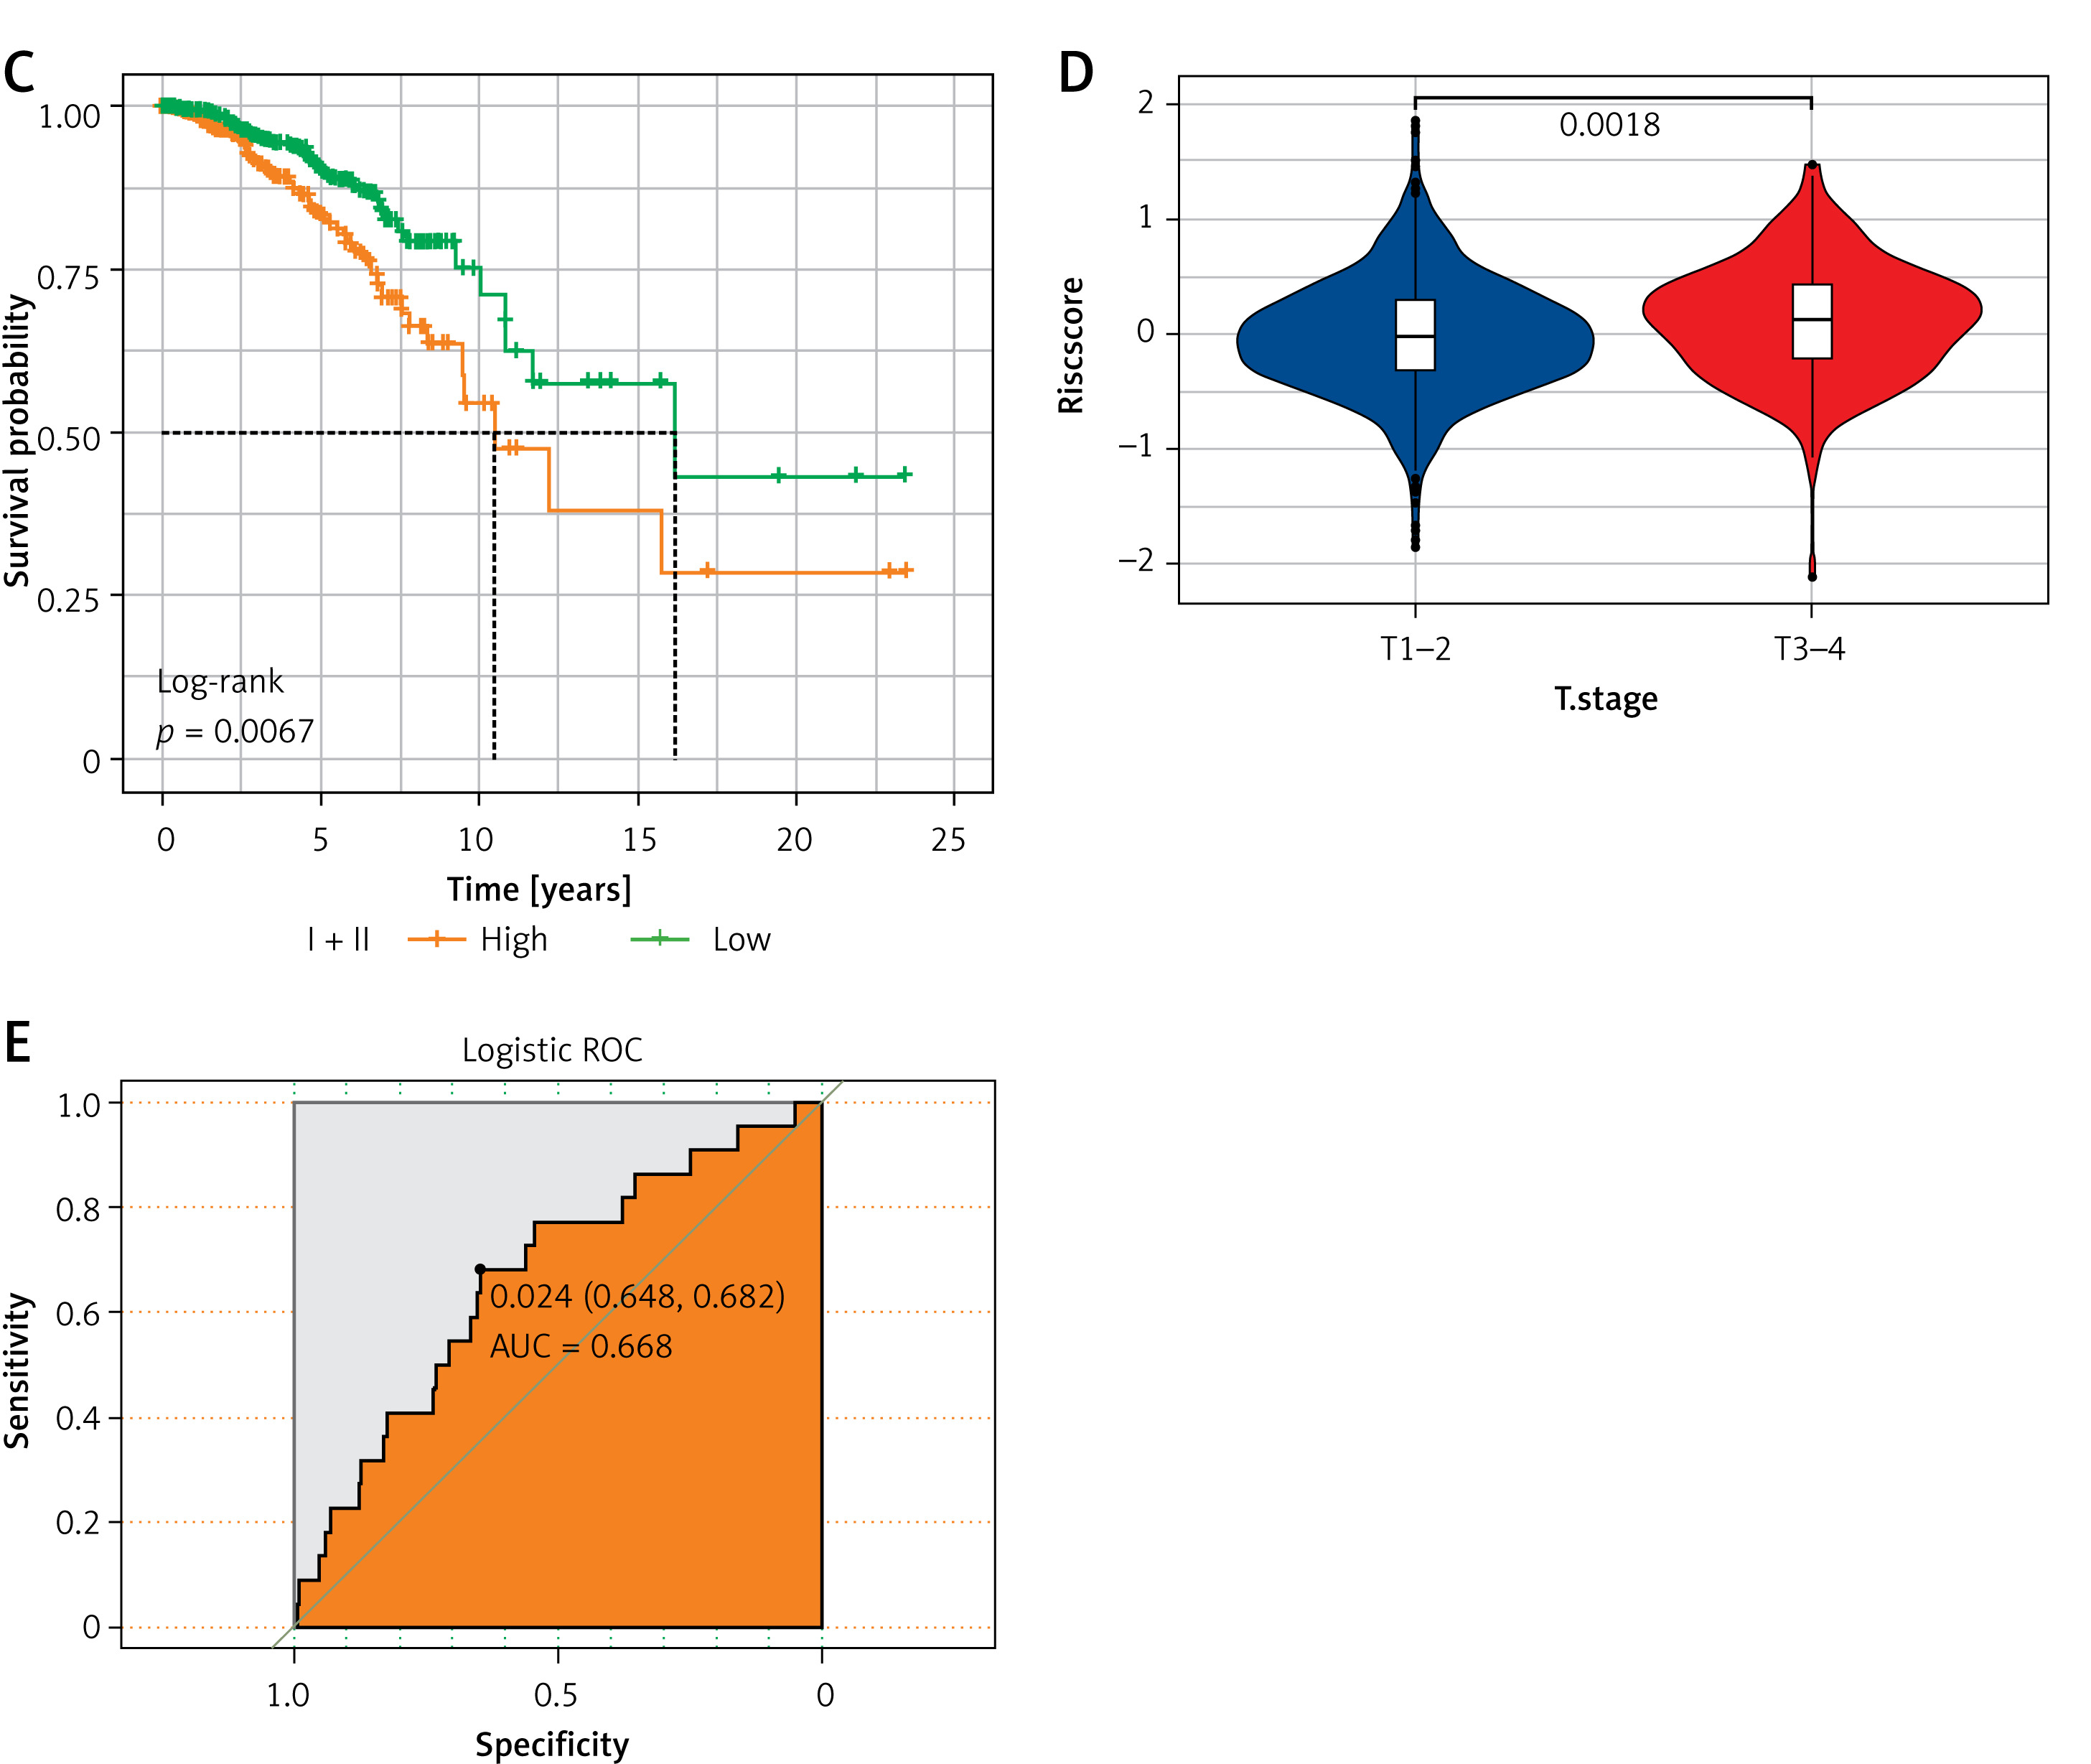
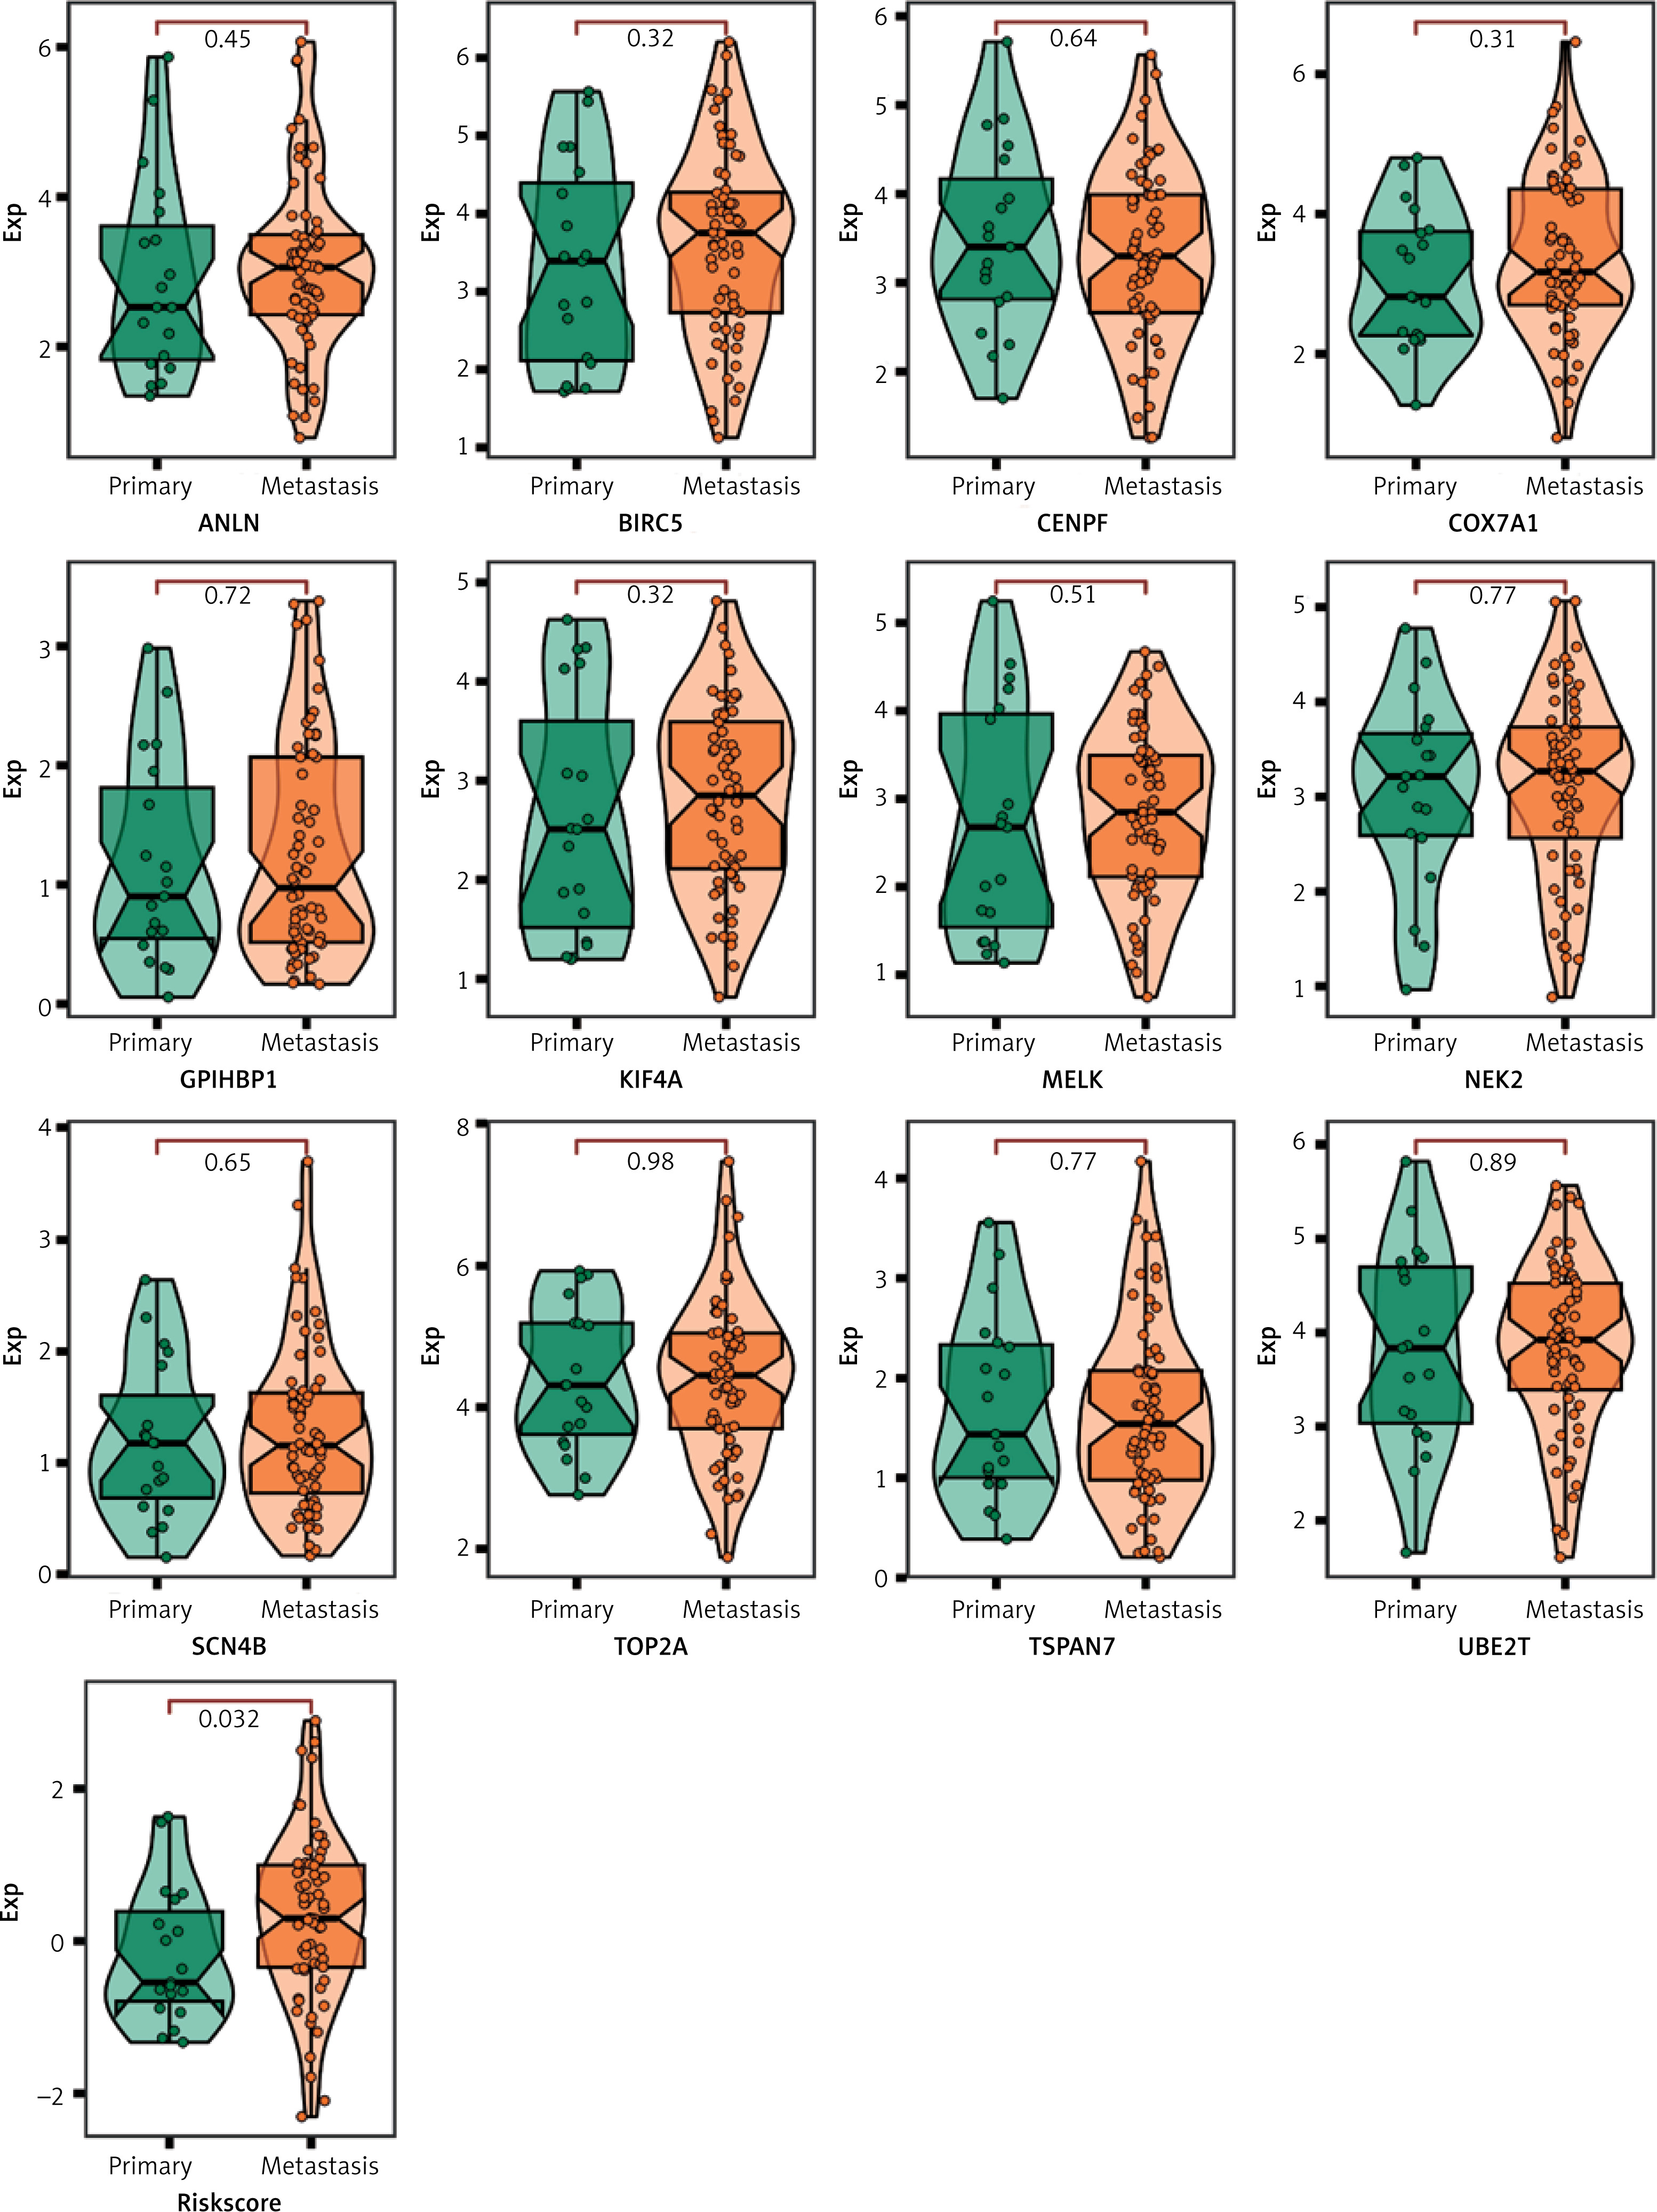
The TCGA dataset’s analysis of the relationship between t-mRPM risk scores and clinical-pathological features showed significant differences (p < 0.05) in TNM staging, pathological grading, survival status (fustat), and gender between the high- and low-risk groups (Figures 3 A, B). As seen in Figure 3 C, Kaplan-Meier curve analysis indicated that the high-risk group had a worse prognosis than the low-risk group (log-rank test, p < 0.01). Since early BC (stages I and II) still accounts for a significant portion of diagnoses, we first looked at how this risk model varied across different T stages. Patients in later stages (T3-4) showed greater risk ratings than those in early stages (T1-2) (Figure 3 D; p < 0.01, Wilcox test). Furthermore, ROC curve analysis showed that the AUC value for t-mRNA predicting M staging was 0.668 (Figure 3 E), suggesting that the t-mRPM score might also predict the development of distant organ metastasis in BC patients. t-mRPM was also found to be predictive of M staging (M0 and M1). We investigated the predictive power of model genes for BC metastasis using the TCGA-BRCA dataset. While individual genes were not very predictive, the risk model that consists of these genes showed better predictive power in predicting metastases of breast cancer (p = 0.032) (Figure 4). According to this model, metastasis is more likely to occur in patients with higher scores. All things considered, the t-mRPM score enhances the prediction for BC survival and is a useful predictor of cancer metastasis.
Figure 3
Analysis of correlations between various clinicopathological features and the prognostic model in the TCGA cohort. A – Pie chart showing the relationship between clinical-pathological traits and high- and low-risk groups. B – Heatmap showing how six distinct clinicopathological traits are distributed along with each patient’s risk score determined by their signature C – Kaplan-Meier OS curves for breast cancer in its early stages based on t-mRPM (log-rank test: p = 0.0067). D – Risk scores were considerably greater in patients in stages T3–4 than in those in stages T1-2 (p = 0.0018). E – ROC curves for BC patients showing M stage prediction (M0 and M1, AUC = 0.668)
Development and evaluation of nomogram
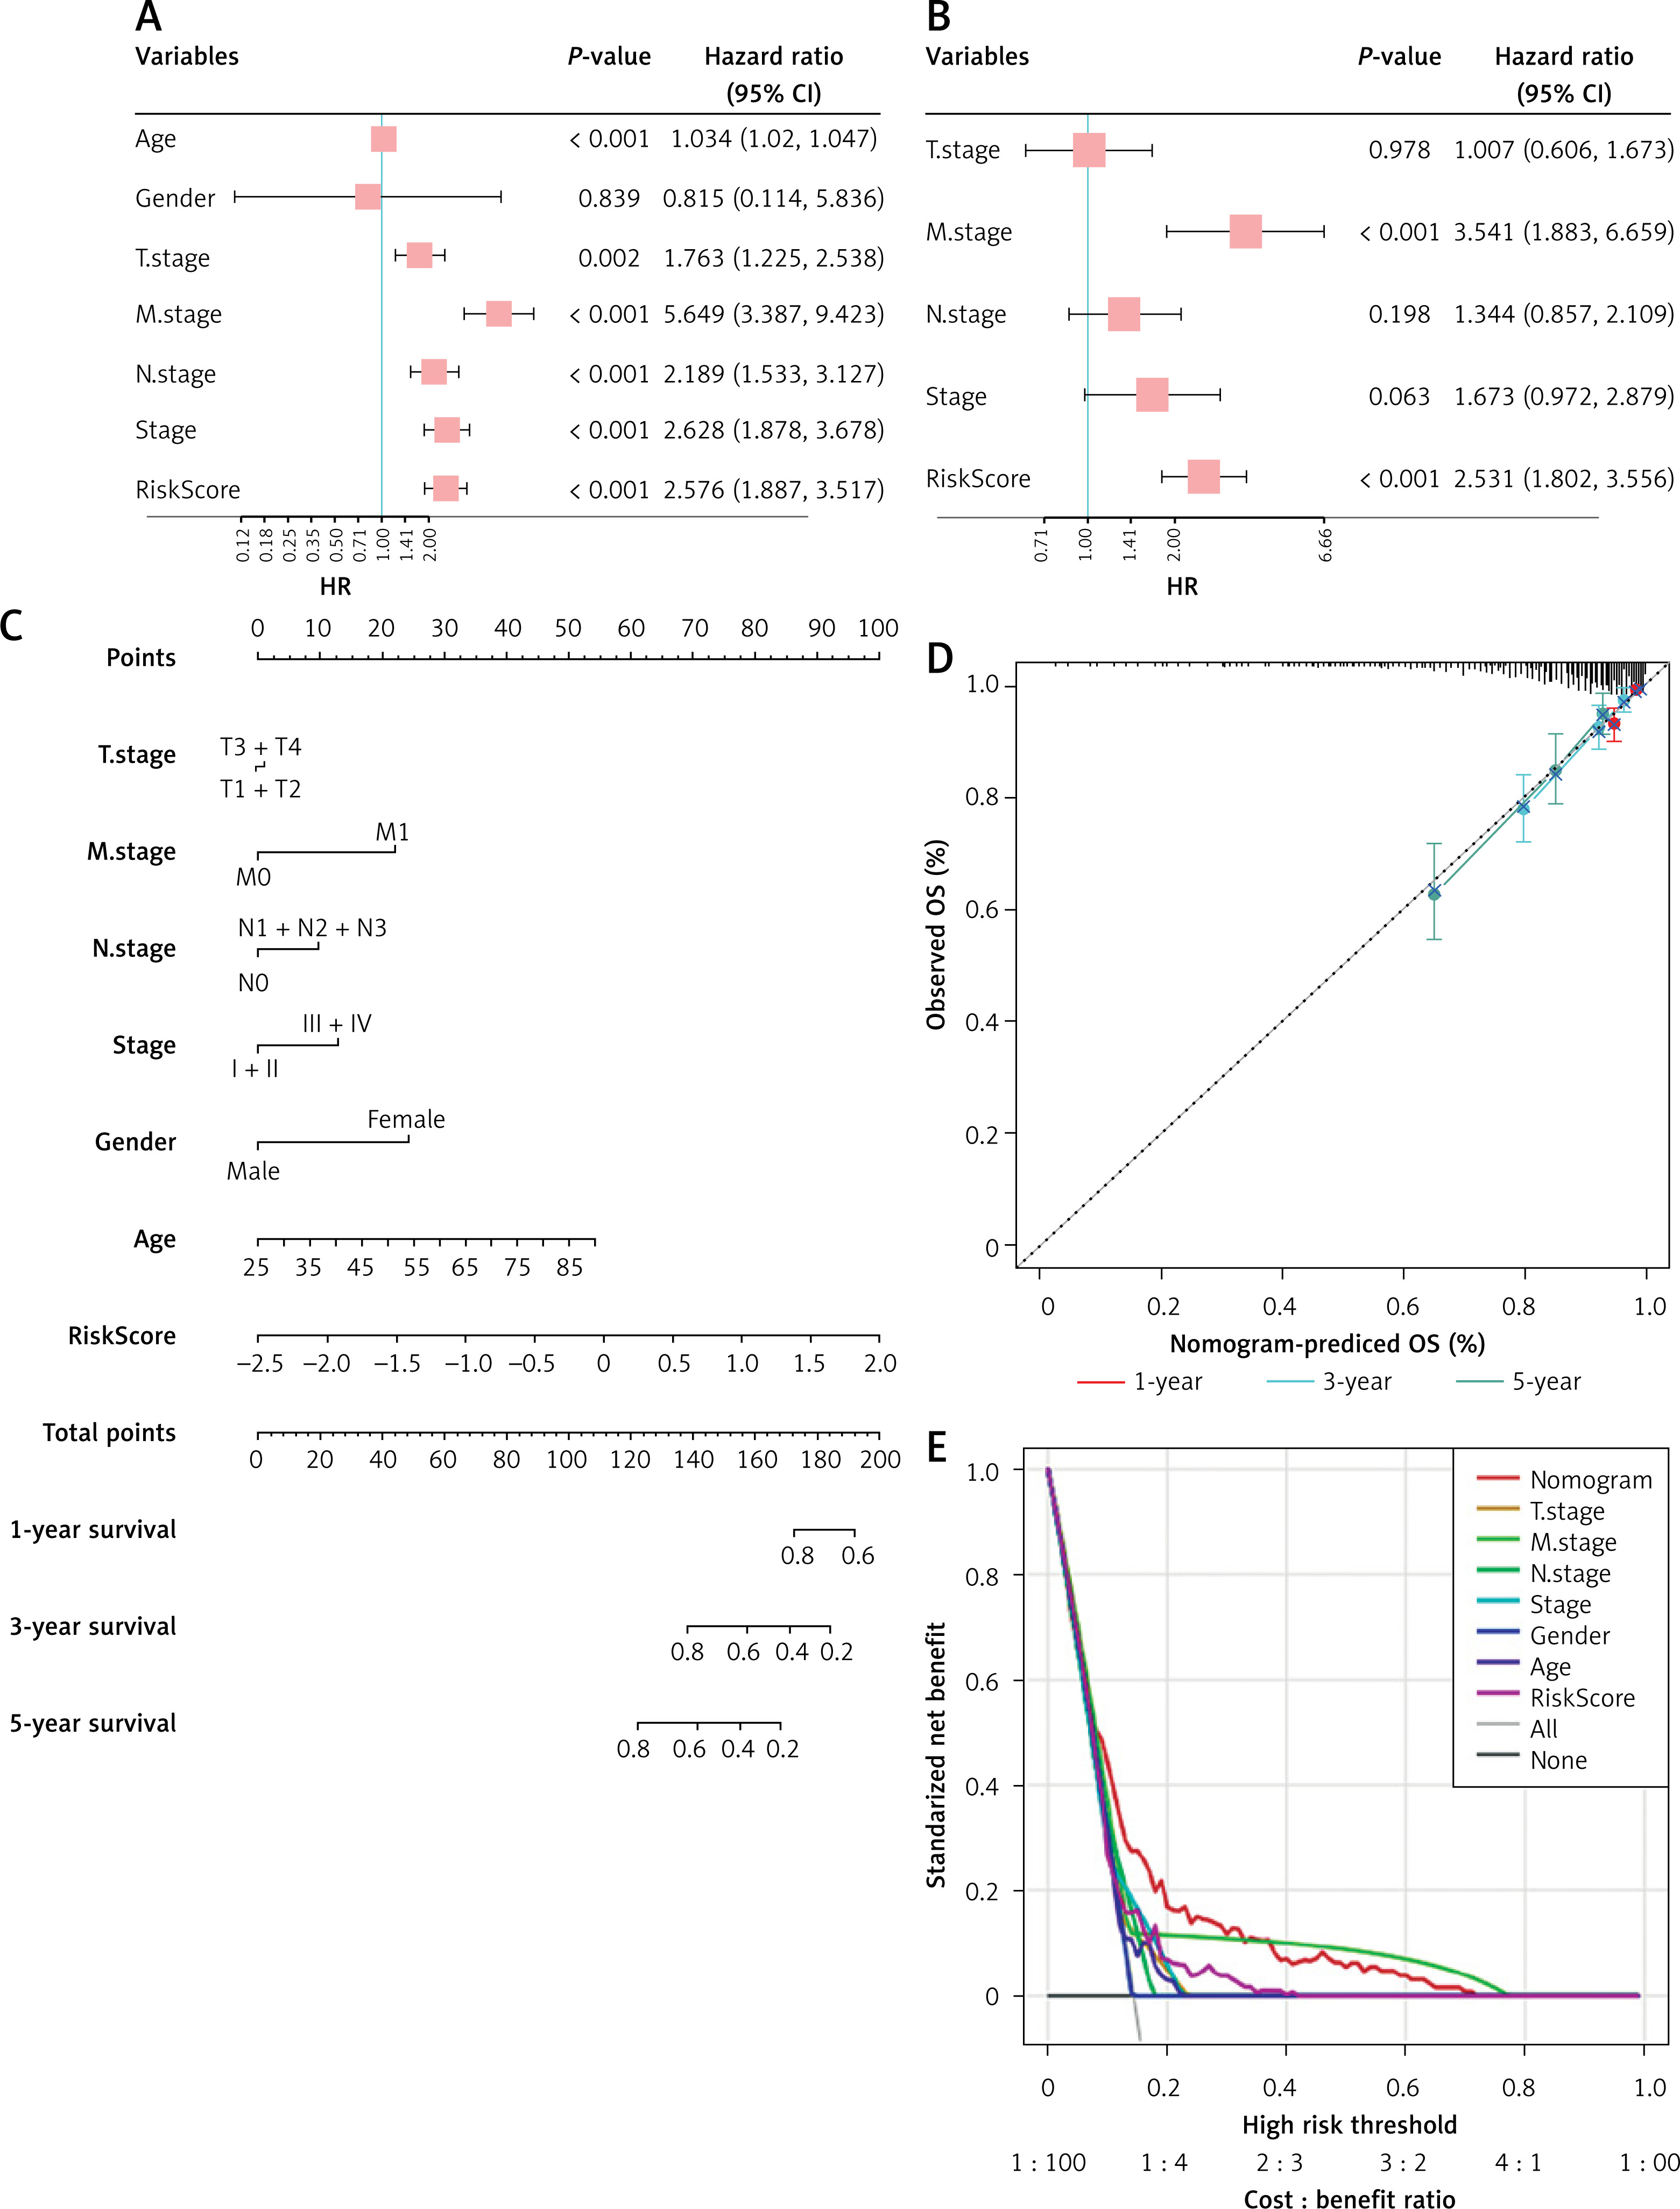
To confirm the independent predictive capability of t-mRPM, both univariate and multivariate Cox regression analyses were conducted (Figures 5 A, B). In the univariate analysis, all clinical-pathological characteristics, except for gender (HR = 0.815, 95% CI = 0.114–5.836, p = 0.839), i.e. age, TNM staging, pathological staging, and risk score, were significantly correlated with prognosis, each indicating a poor prognosis (all p < 0.05). These included age (HR = 1.034, 95% CI = 1.02–1.047, p < 0.001), T stage (HR = 1.763, 95% CI = 1.225-2.538, p = 0.02), M stage (HR = 5.649, 95% CI = 3.387–9.423, p < 0.001), N stage (HR = 2.189, 95% CI = 1.533–3.127, p < 0.001), overall stage (HR = 2.628, 95% CI = 1.878–3.678, p < 0.001), and risk score (HR = 2.576, 95% CI = 1.887–3.517, p < 0.001) (Figure 5 A). In the multivariate analysis, the risk score (HR = 2.531, 95% CI = 1.802–3.556, p < 0.001) and M stage (HR = 3.541, 95% CI = 1.883–6.659, p < 0.001) emerged as independent prognostic factors for predicting adverse OS in BC patients (Figure 5 B). A predictive nomogram including clinical-pathological variables was developed to predict an individual’s overall survival at 1, 3, and 5 years in order to enhance clinical decision-making. This nomogram closely matched the optimal prediction model (Figures 5 C, D), demonstrating high accuracy in predicting 1-year, 3-year, and 5-year OS. The decision curve analysis (DCA) (Figure 5 E) and calibration chart (Figure 5 D) demonstrated that t-mRNA is a reliable prognostic indicator for BC patients, confirming the nomogram’s accuracy in predicting survival probability with real outcomes. This enhances predictive models and facilitates clinical judgment.
Figure 5
Analysis of the clinical pathological characteristics of t-mRPM and its independent prognostic potential. A, B – Outcomes of the univariate and multivariate Cox regression analyses. C – A nomogram that can be used to forecast a patient’s overall survival. D – The nomogram’s decision curve values. E – The nomogram model calibration curve
To explore the difference of biological functions in two risk groups and the research value of model genes in multiple cancer types, we conducted pathway enrichment analysis, immune correlation analysis, and pan-cancer analysis, as detailed in the supplementary materials.
Validation of the 12 model genes with RT-qPCR assay
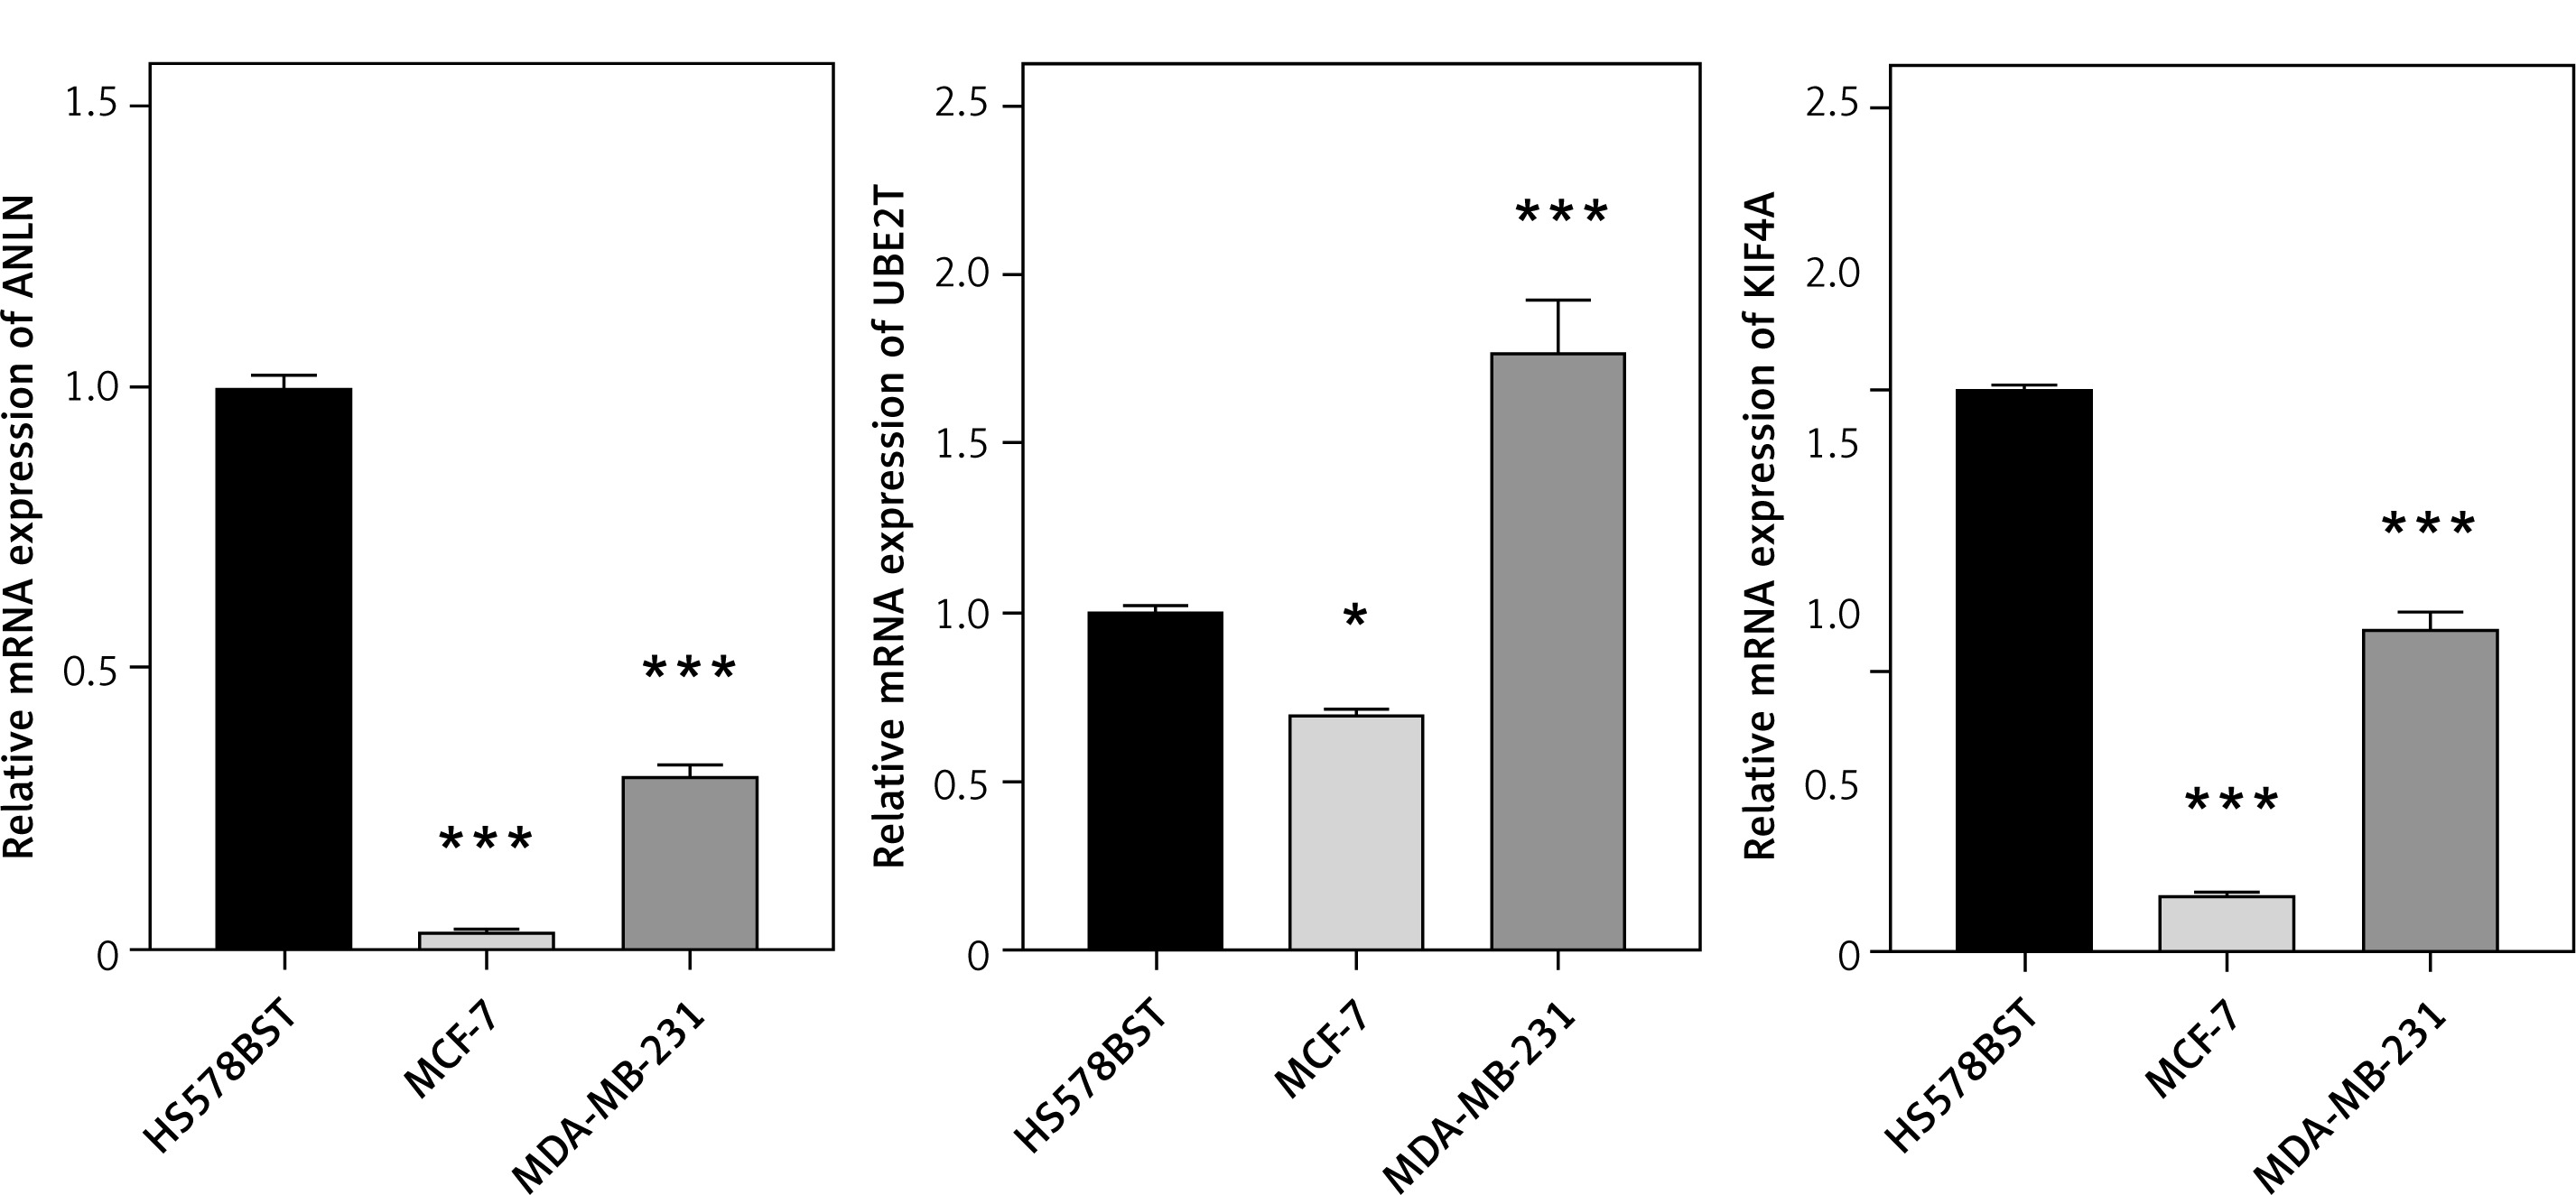
To delineate differential expression patterns of model genes between malignant and normal mammary epithelial cells, we conducted quantitative real-time PCR (RT-qPCR) assays. As shown in Figure 6, compared with normal breast cells (HS578BST), the expression of CENPF, TSPAN7, NEK2, TOP2A, COX7A1, SCN4B, and ANLN was downregulated in tumor cell lines (MCF-7 and MDA-MB-231). Moreover, distinct expression patterns of the signature genes were observed across diverse breast cancer cell subtypes. MELK, BIRC5, UBE2T, and KIF4A showed high expression levels in MDA-MB-231, but with low expression in MCF-7. In contrast, GPIHBP1 exhibited an inverse expression pattern.
Discussion
tRNA acts as the “translator” of genetic information, uniquely recognizing mRNA codons through its anticodon and converting mRNA nucleotide sequences into peptide chains of nascent proteins. As research in transcriptomics advances, the roles of tRNA and mRNA in cancer are drawing increased attention [32]. Alterations in tRNA expression levels, structures, and functionalities can disrupt the translation of associated mRNAs [33, 34], influencing tumor development and prognosis. Therefore, tRNA and its related mRNA are crucial in the gene expression process within tumor cells [35, 36]. Although previous studies have identified tRNAs that influence the prognosis of BC, the impact of related mRNAs on the molecular mechanisms of BC has remained largely unexplored. In this study, we developed a model of tRNA-related mRNA that influences the prognosis of BC, demonstrating its potential value in predicting BC biological characteristics, immunotherapy responsiveness, and survival outcomes. Remarkably, our pan-cancer analysis has shown that this model is effective not only in predicting the prognosis of various other cancers but also in assessing the reactivity of the associated tumor microenvironment.
Beyond its canonical role in translational regulation, transfer RNA (tRNA) is increasingly recognized as a key modulator in diverse oncogenic processes, including the stabilization of mRNA, modulation of reverse transcription, and regulation of apoptosis and cellular senescence [37]. During the senescence escape process of breast cancer cells, tRNA-Tyr is specifically upregulated and mediates the evasion of senescence through the mTOR pathway. Inhibiting mTOR can block this process [38]. In addition, tRNA can bind to RNA-binding proteins (such as YBX1) and regulate tumor cell metastasis and invasion [39]. We identified 5ʹ-M-tRNA-Tyr-GTA-7-1_L23 from the OncotRF database as an important prognostic marker for breast cancer (HR = 1.265, p < 0.001), which is significantly upregulated in breast cancer tissues [40]. Through bioinformatics analysis, we screened 12 characteristic genes from 92 closely related mRNAs and experimentally validated their differential expression between breast cancer and normal cells. Notably, MELK, BIRC5, GPIHBP1, UBE2T, and KIF4A were significantly upregulated in breast cancer cell lines; these genes have previously been implicated as potential therapeutic targets in breast cancer. The overexpression of these genes has been associated with unfavorable clinical outcomes in patients with breast cancer [41–45]. Given their coordinated upregulation with the tRNA, we hypothesize that this tRNA may facilitate tumor progression by interacting with the corresponding mRNAs and enhancing the translation of oncogenic transcripts. Nevertheless, the precise molecular mechanisms of the interaction between this tRNA and its mRNA targets remain to be elucidated, warranting further investigation.
We also constructed a prognostic model based on the 12 characteristic genes and validated its performance using both internal and external validation sets. This model accurately predicted BC patients’ survival outcomes. To improve the clinical applicability of the model, we investigated the correlation between t-mRPM and clinical pathological features. Our findings indicate that this feature can help differentiate between T and M stages in BC patients. Based on this relationship, we constructed a nomogram to enhance the ability to predict overall survival rates. Analysis of the variations within HALLMARK pathways across different groups revealed that the high-risk group shows enrichment in biological processes and metabolic pathways associated with cancer. Additionally, a positive correlation was observed between this risk score and the tumor’s malignant characteristics, including angiogenesis, malignant proliferation, and the cell cycle. We investigated the relationship between t-mRPM and immunological traits in BC considering recent notable developments in the field of cancer immune microenvironment and immunotherapy [46–48]. The high-risk group exhibited a reduced response to immunotherapy and high infiltration of M2 macrophages, confirming the prognostic value of this risk model in the context of immunotherapy. Lastly, we performed a pan-cancer analysis to explore the possible use of this trait in additional tumor types. Our study shows that this characteristic has tremendous research potential as it not only predicts BC patients’ prognosis accurately but also has a strong correlation with survival markers in other malignancies.
Currently, the use of immune checkpoint inhibitors (ICIs) has revolutionized therapy for cancer patients [49–51]. The combination chemotherapy project comprising anti-PD-L1 atezolizumab and anti-PD-1 pembrolizumab has been approved as the first-line treatment for PD-L1-positive (PD-L1+) advanced triple-negative breast cancer (TNBC) patients [52]. Despite this, PD-L1 evaluation in tumor samples remains the sole biomarker currently guiding immunotherapeutic decisions in breast cancer. Unfortunately, many PD-L1+ tumor patients do not benefit from ICI treatments [53], highlighting the need for identifying and validating responsive biomarkers to optimize their therapeutic application. Our study suggests that t-mRNA associated with BC could serve as a potential biological predictor for the efficacy of ICI therapy, though further research is essential to validate this potential.
To our knowledge, this is the first study to construct a prognostic model for BC from the perspective of t-mRNA using machine learning, complemented by various pan-cancer analyses and RT-qPCR validation. However, we must acknowledge several limitations. Firstly, although we used multiple datasets to validate our model’s predictive potential, most of the included cohorts are retrospective, and some datasets have small sample sizes. The application of this model’s features needs further validation in large-sample prospective studies and multicenter clinical trials. Secondly, our research relied on public databases. Future efforts should aim to confirm the specific mechanisms of these t-mRNAs through additional cellular and tissue experimentation. In conclusion, the specific mechanisms and clinical application value of t-mRPM in cancer require further investigation and validation.

