Mitral stenosis (MS) is the most common valve lesion in chronic rheumatic heart disease (RHD) with about 38% of patients developing pulmonary hypertension (PH) which may progress to right heart failure [1]. Persistent PH is observed in many patients even after successful percutaneous balloon mitral valvuloplasty [2] or surgical mitral valve replacement [3] and has a high mortality rate [1]. However all patients with RHD do not develop PH implying that some patients may be genetically predisposed to develop PH.
Endothelin-1 (ET-1) is a 21-amino acid peptide produced by endothelial cells, vascular smooth muscle cells and cardiac myocytes with mitogenic, angiogenic and vasoconstrictor properties [4]. ET-1 mediates its effects through endothelin receptor type A (ETA) present in the vascular smooth muscle cells [4]. ET-1 expression in pulmonary vascular cells is increased in idiopathic pulmonary arterial hypertension (PAH) where it contributes in the pathogenesis by promoting inflammation and fibrosis [5, 6]. The ET-1 gene polymorphisms have been shown to be associated with the development of idiopathic PAH, suggesting their role in the pathogenesis [5, 6]. However, the significance of ET-1 in the pathogenesis of PH associated with rheumatic mitral valve disease (PH-MVD) has not been studied. We hypothesized that the development of pulmonary hypertension in RHD is influenced by genetic predisposition as only few patients develop PH despite having severe valvular heart disease. Since genetic studies are not available in such patients, we aimed to study the role of ET-1 and ETA gene polymorphisms in PH-MVD.
Methods
In this cross-sectional study, 246 subjects, aged ≥ 18 years were enrolled from the outpatient Department of Cardiology, 123 consecutive PH-MVD subjects (Group A) and 123 age- and sex-matched healthy controls (Group B). Group A consisted of subjects having isolated chronic rheumatic mitral valve stenosis with associated PH (right ventricular systolic pressure (RVSP) ≥ 36 mm Hg). They were on rheumatic prophylaxis either with injection benzathine penicillin 1.2 million units every three weekly or tablet erythromycin 250 mg twice daily. Subjects having acute rheumatic fever in the last 1 year, other valvular lesions, and coexisting cardiac or pulmonary disease were excluded. The Institutional Ethics Committee approved the study and each participant gave written informed consent.
Transthoracic two-dimensional echocardiography, M-mode and Doppler examination for the assessment of valvular heart disease and ventricular function were performed in a resting, non-sedated state in the left lateral decubitus position. Mitral valve area was calculated by planimetry and pressure-half time method [7]. RVSP was calculated from tricuspid regurgitation (TR) jet obtained under color flow imaging guidance. RVSP was obtained using simplified Bernoulli formula from peak TR velocity; RVSP = 4(VTR)2 + RAP, where VTR is peak velocity of TR jet and RAP is estimated right atrial pressure. Peak end-diastolic velocity (VED) of pulmonary regurgitation jet continuous wave Doppler trace was used to calculate pulmonary artery end-diastolic pressure (PADP); PADP = 4(VED)2 + RAP [1]. An average of 5 readings was taken.
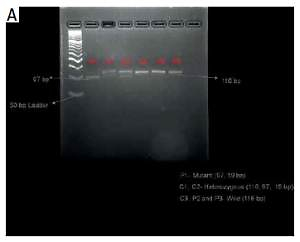
Fifteen milliliters of fasting blood sample was drawn from peripheral vein for hematology, biochemistry tests and DNA extraction. Genomic DNA was extracted from peripheral blood leukocytes using DNA extraction kit (Gene Aid, India) following the manufacturer’s protocol. DNA quantitation was done using Quantus fluorometer (Promega, USA) and the quality of DNA was determined by ethidium bromide stained 1% agarose gel electrophoresis. Three polymorphisms, Lys198Asn (rs5370), 3A/4A (rs10478694) on the ET-1 gene and His323His (rs5333) on the ETA gene, were studied and analyzed by polymerase chain reaction restriction fragment length polymorphism (PCR RFLP). The primers and restriction enzymes used for ET-1 and ETA gene polymorphisms were as previously reported [8–10] and were as follows: Lys198Asn, forward: 5’-ATGATCCCAAGCTGAAAGGCTA-3’, reverse: 5’-CAGGGCTCTCCGTGGAGGCTAT-3’. The cycling conditions were: initial denaturation 93°C for 3 min, followed by 34 cycles of 93°C denaturation for 50 s, 52°C annealing for 50 s, 72°C extension for 50 s, and finally 72°C for 10 min for final extension. PCR product was a 116 base pair (bp) fragment, 3A/4A, forward: 5’-GCTGCTTTTCTCCCCGTTAA-3, reverse: 5’-CAAGCCACAAACAGCAGAGA-3’. The cycling conditions were: initial denaturation 95°C for 10 min, followed by 39 cycles of 95°C, denaturation for 40 s, 57.3°C annealing for 40 s, 72°C extension for 1 min, and finally 72°C for 10 min for final extension. PCR product was a 195 bp fragment. His323His, forward: 5’-TTTCTCACTTTCCTTTAGCG-3’, reverse: 5’-ACCTAAGTAATTCACATCGG-3’. The cycling conditions were: initial denaturation 95°C for 3 min, followed by 33 cycles of 94°C, denaturation for 30 s, 53.2°C annealing for 30 s, 72°C extension for 30s, and finally 72°C for 10 min for final extension. PCR product was a 154 bp fragment. PCR was performed in 25 μl of total reaction volume. The PCR amplicons on 3% agarose gel electrophoresis containing ethidium bromide showed amplified fragments. This was followed by restriction digestion of the PCR amplicons at 37°C for 15 min and heat inactivation at 65°C for 5 min with fast digest restriction enzymes NheI, BselI and BspTI (Thermo Scientific, USA) for study of Lys198Asn, 3A/4A and His323His polymorphisms respectively. The Lys and Asn alleles of Lys198Asn polymorphism correspond to 116 bp and 97 bp + 19 bp sized fragments (Figure 1 A), in 3A/4A polymorphism the fragment sizes for 3A and 4A alleles were 195 bp and 176 bp + 19 bp respectively (Figure 1 B) and in His323His (C/T) polymorphism, the alleles C and T correspond to 154 bp and 87 bp + 67 bp sized fragments respectively (Figure 1 C). The digested products were visualized on 5% agarose gel electrophoresis after staining with ethidium bromide under gel documentation system (Bio Rad, USA). Serum endothelin-1 levels were measured by ELISA using human endothelin-1 ELISA kit (Bioassay Technology Laboratory, China).
Figure 1
A – Analysis of the Lys198Asn polymorphism in the endothelin-1 (ET-1) gene. Restriction fragments are shown after digestion with NheI, (B) Analysis of the 3A/4A polymorphism in the ET-1 gene. Restriction fragments are shown after digestion with BselI, and (C) Analysis of the His323His polymorphism in the endothelin receptor A (ETA) gene. Restriction fragments are shown after digestion with BspTI
P – patients, C – controls.

Results
The baseline characteristics are given in Table I. The subjects in Group A had significantly lower body weight and body mass index (p < 0.0001) because of chronic rheumatic heart disease. However, hemoglobin, blood urea, serum creatinine, blood sugar levels and erythrocyte sedimentation rate (ESR) were similar in both the groups (p = NS). Blood anti-streptolysin O titers were < 200 IU and C-reactive protein was non-reactive in both the groups suggesting absence of acute rheumatic activity. Group A subjects had severe mitral stenosis with PH and had NYHA Class II-III dyspnea with 35% of subjects having atrial fibrillation on electrocardiogram. Echocardiography showed enlarged right atrium (RA) with markedly decreased RA fractional area change signifying RA dysfunction (Supplementary Figure S1). RV was enlarged with borderline RV systolic dysfunction (Table I). The subjects in Group B were asymptomatic healthy controls and had normal echocardiography examination.
Table I
Baseline characteristics and echocardiography parameters of subjects in both the study groups
| Baseline parameters | Group An = 123 | Group Bn = 123 | P-value |
|---|---|---|---|
| Age [years] | 34.2 ±9.9 | 35.4 ±9.3 | 0.331 |
| Male : female (%) | 43 (35%) : 80 (65%) | 47 (38%) : 76 (62%) | 0.69 |
| Weight [kg] | 49.0 ±2.6 | 59.6 ±9.3 | < 0.0001* |
| Height [cm] | 156.6 ±6.5 | 159.5 ±5.5 | 0.0002* |
| BMI [kg/m2] | 20.1 ±1.6 | 23.4 ±3.2 | < 0.0001* |
| Heart rate [beats/min] | 79.2 ±4.2 | 79.7 ±5.1 | 0.468 |
| ECG [Sinus rhythm : Atrial fibrillation] (%) | 80 (65%) : 43 (35%) | 123 (100%) : 0 (0%) | < 0.001* |
| Systolic blood pressure [mm Hg] | 127 ±8.5 | 127 ±7.3 | 0.962 |
| Diastolic blood pressure [mm Hg] | 78.1 ±4.3 | 78.7 ±3.1 | 0.176 |
| Temperature [°F] | 98.4 ±0.4 | 98.3 ±0.6 | 0.124 |
| Hemoglobin [gm/dl] | 12.6 ±1.8 | 12.9 ±1.8 | 0.222 |
| ESR [mm/h] | 20.0 ±15.0 | 17.2 ±14.3 | 0.141 |
| Blood urea [mg/dl] | 22.5 ±3.97 | 22.8 ±5.7 | 0.567 |
| Serum creatinine [mg/dl] | 0.77 ±0.10 | 0.75 ±0.09 | 0.055 |
| Blood sugar [mg/dl] | 98.5 ±23.5 | 94.1 ±14.7 | 0.078 |
| Serum endothelin-1 levels [ng/l] | 92.4 ±156 | 118 ±124.2 | 0.158 |
| Left atrial diameter [cm] | 4.91 ±0.95 | 3.05 ±0.47 | < 0.001* |
| LV internal dimension in diastole [cm] (LVIDd) | 4.39 ±0.79 | 4.42 ±0.47 | 0.740 |
| LV internal dimension in systole [cm] (LVIDs) | 2.99 ±0.67 | 2.97 ±0.46 | 0.744 |
| Posterior wall thickness in diastole [cm] | 0.84 ±0.15 | 0.84 ±0.13 | 0.626 |
| IVS thickness in diastole [cm] | 0.85 ±0.41 | 0.84 ±0.11 | 0.859 |
| Right ventricular wall thickness in diastole [cm] | 0.54 ±0.45 | 0.41 ±0.38 | 0.011* |
| Main pulmonary artery diameter [cm] | 2.70 ±0.53 | 2.06 ±0.23 | < 0.001* |
| LV ejection fraction (%) | 56.88 ±6.04 | 58.29 ±4.35 | 0.038* |
| Right atrial major dimension [cm] | 5.66 ±1.35 | 4.16 ±0.46 | < 0.001* |
| Right atrial end-systolic area [cm2] | 17.78 ±8.56 | 11.92 ±2.41 | < 0.001* |
| Right atrial end-diastolic area [cm2] | 13.19 ±8.48 | 6.21 ±1.71 | < 0.001* |
| Right atrial fractional area change (FAC) (%) | 29.76 ±14.94 | 47.90 ±9.58 | < 0.001* |
| IVC diameter (inspiration) [cm] | 0.84 ±0.42 | 0.54 ±0.13 | < 0.001* |
| IVC diameter (expiration) [cm] | 1.60 ±0.46 | 1.38 ±0.29 | < 0.001* |
| RV basal diameter [cm] | 3.93 ±0.91 | 3.18 ±0.45 | < 0.001* |
| RV mid cavity diameter [cm] | 2.89 ±0.77 | 2.22 ±0.39 | < 0.001* |
| TAPSE [cm] | 1.80 ±0.29 | 2.04 ±0.19 | < 0.001* |
| RVOT VTI [cm] (average) | 16.22 ±4.47 | 19.72 ±2.93 | < 0.001* |
| Mitral valve area by planimetry [cm2] | 0.81 ±0.18 | – | – |
| Mitral valve area by pressure half-time [cm2] | 0.80 ±0.22 | – | – |
| Peak diastolic transmitral gradient [mm Hg] | 19.24 ±6.53 | – | – |
| Mean diastolic transmitral gradient [mm Hg] | 11.74 ±4.71 | – | – |
| Right ventricular systolic pressure [mm Hg] | 70.26 ±24.02 | – | – |
| Pulmonary artery end diastolic pressure [mm Hg] | 25.96 ±10.29 | – | – |
| Pulmonary artery mean pressure [mm Hg] | 39 ±14.25 | – | – |
* Significant. BMI – body mass index, ESR – erythrocyte sedimentation rate, IVC – inferior vena cava, IVS – interventricular septum, LV – left ventricular, n – number of study subjects, PH-MVD – pulmonary hypertension associated with rheumatic mitral valve disease, RV – right ventricular, RVOT VTI – right ventricular outflow tract velocity time integral, TAPSE – tricuspid annular plane systolic excursion.
Genotypic frequencies of Lys198Asn and His323His polymorphisms between Group A and B differed significantly, p = 0.009 and p = 0.02 respectively. The frequency of mutant homozygous Asn/Asn in Lys198Asn (p = 0.01) and T/T in His323His polymorphism (p = 0.01) was greater in Group A compared to Group B. The mutant Asn allele was frequent in Group A than in Group B. Further, for Lys198Asn polymorphism, mutant Asn/Asn genotype was significantly associated with an increased risk of PH-MVD with odds ratio (OR) 3.9 (p = 0.002) (Table II). Additionally, presence of either mutant homozygous Asn/Asn or heterozygous Lys/Asn genotypes when compared to wild type Lys/Lys was associated with a higher risk (OR = 1.91; p = 0.03). No significant association of 3A/4A polymorphism with the PH-MVD group was observed.
Table II
Frequency and odds risk estimates of ET-1 and ETA gene polymorphism genotypes in Group A and Group B subjects
| Frequency of ET-1 and ETA gene polymorphism genotypes in Group A and Group B subjects | |||||||
|---|---|---|---|---|---|---|---|
| Subjects | Lys/Lys | Asn/Asn | Lys/Asn | Lys allele | Asn allele | Chi square, χ² | P-value |
| Group A (n = 123) | 24 (19.5%) | 24 (19.5%) | 75 (61.0%) | 0.5 | 0.5 | 9.34 | 0.009* |
| Group B (n = 123) | 39 (31.7%) | 10 (8.1%) | 74 (60.2%) | 0.62 | 0.38 | ||
| Subjects | 3A/3A | 4A/4A | 3A/4A | 3A allele | 4A allele | Chi square, χ² | P-value |
| Group A (n = 123) | 3 (2.4%) | 36 (29.3%) | 84 (68.3%) | 0.37 | 0.63 | 4.86 | 0.09 |
| Group B (n = 123) | 11 (8.9%) | 33 (26.8%) | 79 (64.2%) | 0.41 | 0.59 | ||
| Subjects | C/C | T/T | C/T | C allele | T allele | Chi square, χ² | P-value |
| Group A (n = 123) | 68 (55.3%) | 6 (4.9%) | 49 (39.8%) | 0.75 | 0.25 | 8.4 | 0.02* |
| Group B (n = 123) | 83 (67.5%) | 0 (0%) | 40 (32.5%) | 0.84 | 0.16 | ||
| Odds risk estimates of ET-1 and ETA gene polymorphism genotypes in Group A compared to Group B# | |||||||
| Gene polymorphism/ SNP ID | Genotypes compared | Group An = 123, n (%) | Group Bn = 123, n (%) | Odds ratio (OR) | 95% confidence interval (CI) | P-value | |
| Lys198Asn (rs5370) | Asn/Asn vs. Lys/Lys Lys/Asn vs. Lys/Lys Asn/Asn + Lys/Asn vs. Lys/Lys | 24 (19.5) 75 (61.0) 99 (80.5) | 10 (8.1) 74 (60.2) 84 (68.3) | 3.9 1.65 1.91 | 1.59–9.55 0.90–3.00 1.07–3.44 | 0.002* 0.10 0.03* | |
| Polymorphism | Genotypes compared | Group A, n = 123, n (%) | Group B,n = 123, n (%) | OR | 95% CI | P-value | |
| His323His (C/T)¶ (rs5333) | C/T vs. C/C T/T + C/T vs. C/C | 49 (39.8) 55 (44.7) | 40 (32.5) 40 (32.5) | 1.49 1.67 | 0.88–2.53 0.99–2.81 | 0.13 0.04* | |
* Significant. Lys/Lys – wild-type, Asn/Asn – homozygous variant, Lys/Asn – heterozygous variant of Lys198Asn polymorphism, 3A/3A – wild-type, 4A/4A – homozygous variant, 3A/4A – heterozygous variant of 3A/4A polymorphism, C/C – wild-type, T/T – homozygous variant, C/T – heterozygous variant of His323His polymorphism, n – number of study subjects; PH-MVD – pulmonary hypertension associated with rheumatic mitral valve disease, χ2 – Chi square, ET-1 – endothelin-1, ETA – endothelin receptor type A.
The combined analysis of homozygous variants Asn/Asn, 4A/4A and T/T showed that these variants in combination were more common in Group A compared to Group B (p = 0.021). There was no significant difference in serum endothelin-1 levels between the two groups.
Discussion
In this study recessive genotype Asn/Asn (Lys198Asn) of the ET-1 gene and T/T genotype (His323His) of ETA gene polymorphisms were significantly more prevalent in the PH-MVD group compared to healthy controls. These polymorphisms have been previously reported in idiopathic PAH [5, 6], which has poor prognosis [11] and other cardiovascular disease states [8, 12, 13] suggesting a pathophysiological role of ET-1. Pousada et al. stated that T allele of Lys198Asn increases the susceptibility to idiopathic PAH and affects its progression [5]. As per their study, Lys198Asn polymorphism can cause alterations in both the functionality and expression of the protein favoring the appearance of disease [5]. Although Lys198Asn does not structurally alter the ET-1 protein, it can affect mRNA synthesis, splicing, translation and protein folding [14]. Dzholdasbekova et al. noted that the presence of T allele of Lys198Asn polymorphism increases the susceptibility to systemic arterial hypertension through increased production of ET-1 [8]. These studies show that Lys198Asn polymorphism in association with other ET-1 variants or environmental factors may influence ET-1 expression [15, 16].
The conflicting results have been reported regarding the significance of 3A/4A polymorphism. In an ex vivo study Popowski et al. [17] reported that adenine insertion is related to an increasing endothelin expression (measured as pre-pro-ET-1 mRNA). However, Calabro et al. did not find any association of 3A/4A polymorphism in idiopathic PAH [6]. In the study by Fan et al. no association was found between 3A/4A polymorphism and orthostatic hypotension in both hypertensive and normotensive subjects [18]. We also did not find any association between this polymorphism and PH-MVD. Vadapalli et al. however reported that 3A/4A polymorphism increases the predisposition to idiopathic PAH [15].
Calabro et al. showed a potential link between specific genotypes in the ETA gene and susceptibility to PAH [6]. Similarly in our study, the T/T genotype of the ETA gene was more common in the PH-MVD group. Herrmann et al. stated that His323His polymorphism modulates the influence of ET-1 action on the cardiovascular system [12]. The homozygous variant genotypes of all three polymorphisms together were significantly more apparent in the PH-MVD group implying that the presence of multiple small effect polymorphisms may increase the susceptibility to develop PH.
The ET-1 levels were similar in both the groups. Others studying Lys198Asn polymorphism also reported similar ET-1 levels regardless of presence of this polymorphism. Lys198Asn polymorphism is located in the coding region of the ET-1 gene [16]. Hence it may affect the processing of preproET-1 (precursor of mature ET-1) rather than modifying the gene expression suggesting that the polymorphism effects occur at the molecular level.
This is an initial study exploring ET-1 and ETA receptor gene polymorphisms in PH-MVD patients. Larger studies are required to corroborate our findings and also in other etiologies of PH associated with left heart disease. Further in vitro studies investigating the functional role of these polymorphisms in the pathogenesis of PH are warranted.
In conclusion, our preliminary study for the first time found that ET-1 and ETA gene polymorphisms were more common in PH-MVD suggesting that they may predispose to the development of PH in patients with RHD. These polymorphisms are likely disease modifiers, and their interactions with other genes and environmental factors may influence the development of PH.