Introduction
Diabetic foot ulcer (DFU) is a major complication of diabetes that can result in serious outcomes, including infection, gangrene, amputation, and even death. DFU affects around 18.6 million patients worldwide annually [1]. Moreover, up to about 34% of individuals with type 1 or type 2 diabetes will experience a foot ulcer at some point in their life [2]. Furthermore, it is concerning that around 20% of people with a diabetic foot ulcer may require a lower extremity amputation [3]. Given the increasing prevalence of diabetes and diabetic wounds, addressing the diverse factors that impede healing in diabetic wounds is essential for developing future treatment strategies. First-line therapies for DFUs typically include surgical debridement, offloading pressure from the ulcer, and managing lower extremity ischemia and foot infections [4]. Despite advancements in treatment, nonhealing DFUs remain a persistent clinical challenge. Hence, investigating the pathological mechanisms of DFUs and advancing therapeutic strategies are essential for accelerating ulcer healing and enhancing patient prognosis.
The process of healing chronic wounds in DFU that are resistant to treatment is highly intricate. Chronic inflammation hampers the healing process by affecting the immune cells’ ability to fight bacteria, reducing blood flow to the wound site, damaging the basement membrane of cells, and inhibiting the production of collagen [5]. DFU wounds provide an optimal environment for the formation of biofilms, and both multidrug resistance and biofilm formation are crucial factors in the development of infections in DFU [6]. After blood sugar levels rise, reactive oxygen species (ROS) are subsequently produced, thereby increasing the generation of inflammatory mediators and degeneration of pericytes, thickening the basement membrane, causing endothelial hyperplasia, reducing prostacyclin synthesis, impairing blood vessel dilation, and elevating procoagulant markers. This cascade of events results in the formation of microthrombi, leading to worsened blood flow and oxygen deprivation in diabetic wounds, causing damage to local tissues [7]. Additionally, factors such as the inhibition of growth factors, disturbances in microcirculation, and age-related changes are key factors contributing to DFU [8–10]. The precise mechanism behind the resistance to healing in DFU remains unclear, which poses challenges in diagnosing and treating these conditions effectively.
Necroptosis has been identified as a novel form of genetically controlled cell death. Initially, studies on necroptosis were mainly centered on acute nervous system [11, 12], cancer [13, 14], and cardiovascular diseases [15]. Necroptosis is a self-destructive cellular process that occurs when apoptosis is hindered. Cells undergoing necroptosis display necrotic characteristics such as plasma membrane disruption, organelle swelling, and cytolysis [16]. Necroptosis, initiated by specific stimuli and regulated via caspase-independent pathways, primarily involves the activation of mixed lineage kinase domain-like protein [17], receptor-interacting protein kinase 1 (RIPK1), and RIPK3 [18]. While integrating necroptosis targeting with immunotherapy appears promising in neurological and cancer treatments, our understanding of how necroptosis influences immunogenicity and immunotherapy is still limited. Given the current lack of research, our study aimed to extensively investigate the relationship between necroptosis and immunotherapy in the context of DFU.
Several prior studies have employed the Gene Expression Omnibus (GEO) database to explore targets related to DFU [19, 20], leveraging the advancements in bioinformatics and machine learning [21–23]. Therefore, we propose that necroptosis-associated genes (NRGs) are crucial in the development of DFU.
Material and methods
The study used unsupervised cluster analysis to differentiate two unique clusters in the NRG expression matrix. Subsequently, a machine learning model was developed derived from the key DFU module and two WGCNA clusters [24, 25], with the selection of key models based on diagnostic sensitivity [26]. The study sought to identify necroptosis-associated genes within immune responses and treatment strategies for DFUs [27, 28]. Figure 1 illustrates the study flowchart.
Raw data
We used datasets GSE134431, GSE80178, and GSE68183 from the GEO database. The training set was GSE134431, while GSE80178 and GSE68183 were validation sets. GSE68183 included 3 DFU samples and 3 normal skin samples, while GSE80178 contained 9 DFU samples and 3 normal skin samples [29]. GSE134431 comprised 13 DFU samples and 8 normal skin samples [30]. The NRG dataset was obtained from MSigDB; details are summarized in Table I.
Differentially expressed gene (DEG) analysis
Data processing involved obtaining accurate mRNA data from transcription data using Perl-based matching and sorting techniques. Data normalization was then conducted for GSE134431.
The limma R package (version 3.52.4) was used to process raw gene expression matrices from the GEO database. To adjust for batch variations among GSE134431, GSE68183, and GSE80178, the SVA package was used.
Cluster analysis
By evaluating the cumulative distribution function curve, consensus cluster score and consistency matrix, the ideal cluster number was established, with the maximum cluster count set to k = 9 for this study.
Immune cell infiltration
The analysis of immune cell composition of DFU was conducted using CIBERSORT. Using the limma package, we visualized the immune cell findings through bar plots and correlation plots. Deconvolution p-values for each sample were obtained using Monte Carlo sampling in CIBERSORT. The transcriptional signature matrix representing 22 immune cells was used for the computational simulation, ensuring that the total percentage of these 22 immune cells equaled one for each sample. We conducted 1,000 computational simulations, identifying samples with a p-value < 0.05 as statistically significant.
Enrichment analysis
The Kyoto Encyclopedia of Genes and Genomes (KEGG) and Gene Ontology (GO) databases were used to explore biological functions and pathways. The analysis of how differentially expressed GlnMRGs affect biological processes (BP), molecular functions (MF), and cellular components (CC) was assessed using the Gene Set Variation Analysis (GSVA) method in R. GSVA scores, derived through the limma R package (version 3.52.4), with a |t value| > 2, were deemed significantly altered.
Co-expression gene identification
Weighted gene co-expression network analysis (WGCNA) was employed to identify gene modules and evaluate their associations with clinical traits. The co-expression network was constructed using the top 25% most variable genes from the GSE134431 dataset. Using a dynamic tree-cutting approach with a cutoff of 0.25, modules were merged. The modules showing the highest correlation between the two classification approaches were then identified and mapped.
Developing predictive models using various machine learning techniques
Cluster-specific NRGs were identified by combining WGCNA with the analysis of DEGs within gene clusters. The tool Vnnmap was used to illustrate overlapping genes. The caret R package was used to develop machine learning models for two distinct GlnMRG clusters, employing algorithms such as Generalized Linear Model (GLM), Support Vector Machine (SVM), Extreme Gradient Boosting (XGB), and Random Forest (RF). GLM modeled the expected response through a link function, allowing predictions of relationships from linear variable combinations [31]. XGB operated as a series of parallel trees, enhancing predictions iteratively with each new tree, which helped in aligning predictions closely with actual values [32]. SVM, a form of generalized linear classifier, was particularly effective for binary classification tasks using supervised learning, especially in small datasets and high-dimensional spaces [33]. Furthermore, RF combined multiple independent decision trees to enhance prediction accuracy for classification and regression tasks [34].
To analyze gene correlations in DFU, we used various clusters as response variables and selected differentially expressed genes (DEGs) that were compatible with these clusters as explanatory variables. The DFUs were randomly assigned to the training set and the validation set in a 7 : 3 ratio. The caret R package was used to automatically fine-tune model parameters through grid search, default settings. Next, a 5-fold cross-validation was performed for evaluation. The DALEX package (version 2.4.2) was employed to explain and visualize the four machine learning models. The pROC package (version 1.18.0) was used to display the area under the receiver operating characteristic curve (AUC). The top 5 key variables of gene correlation in DFU depended on the optimal machine learning model.
Developing and independently validating a nomogram model
Using the rms R package (version 6.3.0), a nomogram model was developed to assign scores to each predictor variable. The Total Score was the cumulative sum of the scores for the predictive variables. Calibration curve analysis and decision curve analysis (DCA) were used to evaluate the predictive performance of the nomogram model. The model to differentiate between DFU and normal samples was independently validated with the external datasets GSE134431, GSE68183, and GSE80178.
Interactions between drugs and genes
Advancements in bioinformatics have emphasized the importance of creating biological models and identifying effective biomarkers for disease diagnosis. However, applying these biomarkers in clinical practice was essential. The use of information markers to predict drug response was critical for the prevention and treatment of DFU. The DGIdb database assisted in forecasting drug-gene interactions for key genes identified for the RF model, enhancing drug prediction accuracy and guiding therapeutic strategies.
Results
NRG expression in DFUs
Thirty-seven differentially expressed NRGs (deNRGs) were identified. Of these, compared with a normal control group, in DFU patients, the expression levels of CTPS1, PIPK3, CAMK2A, CAMK2D, PPID, VDAC2, PYGL, PLA2G4A, PLA2G4B, IL1B, CHMP2B, VPS4B, CHMP1B, IL1A, TNFRS10A, IFNA1, STAT5A, STAT5B, and TICAM1 were significantly elevated. Conversely, RNF31, CAMK2B, CAMK2G, SLC25A4, SLC25A6, GLUD1, GLUL, PYGB, PLA2G4F, CHMP2A, CHMP3, VPS4A, FAF1, SRAT3, STAT6, TLR3, SQSTM1, HSP90AB1, and BCL2 showed lower expression levels in testicular tissue of patients with DFU (Figures 2 A, B). Figure 2 C shows the chromosomal locations of the NRGs, presented visually in circular format. Subsequently, correlation analysis was conducted on the genes (Figures 2 D, E), revealing that most exhibited positive interrelationships.
Figure 2
Identification of NRGs in DFU. A – Expression levels of NRGs. B – Heatmap of NRGs C – Location of NRGs on chromosomes. D – Gene relationship network diagram of NRGs. E – Correlation analysis of NRGs. Red and green colors represent positive and negative correlations, respectively. The correlation coefficient was expressed as the area of the pie chart
Immune infiltration analysis
Figure 3 A depicts the distribution of immune cells in different samples, while Figure 3 B highlights the differences between DFU and normal. In DFU samples, activated mast cells and neutrophils were elevated, whereas activated NK cells and CD8 T cells were reduced compared to controls. The correlation between immune cells and NRGs is demonstrated in Figure 3 C.
Cluster analysis
When k was set to 2, the highest within-group correlations emerge, suggesting that NRGs can categorize patients with diabetic foot ulcers into two distinct clusters (Figure 4 A). Figure 4 B highlights notable variations in the principal component analysis (PCA) across clusters. Further, the NRGs across the various clusters were investigated following this cluster analysis. Significant variations were observed in the levels of RNF31, GLUD1, PYGB, CHMP2A, CHMP2B, VPS4A, CHMP1B, STAT3, STAT5A, HSO90AB1, and PARP1 among groups (Figures 4 C, D). Figures 4 E and F illustrates the analysis of immune cell infiltration outcomes according to the identified clusters.
Figure 4
Identification of NRG clusters in DFU. A – Consensus clustering matrix when k = 2. B – PCA visualized the distribution of the two clusters C – Boxplots of NRGs expressed between the two clusters. D – Heatmap of expression patterns of the NRGs between the two clusters E – Relative abundance maps of 22 infiltrating immune cells between the two clusters. F – Boxplots of immune infiltration differences between the two clusters
Functional enrichment study
NRG enrichment was assessed using GSVA. The pathway was significantly enriched in key genes involved in small cell lung cancer, as well as in the functions of arachidonic acid metabolic pathway genes and metabolites (Figure 5 A). The results of the GO analysis showed enzyme substrate adaptation and transportation of compounds containing nucleobases (Figure 5 B).
Identification and development of gene modules within co-expression networks
We used WGCNA to develop co-expression networks for healthy controls and DFU patients, revealing significant gene modules related to DFU. We discovered gene modules that exhibited co-expression under this specific condition (Figure 6 A). Subsequently, the dynamic cut algorithm resulted in 26 unique co-expression components, distinguished with various colors, then created a TOM heat map (Figures 6 B–D). Furthermore, we analyzed the correlation and consistency of co-expression patterns using genes from these 26 modules in relation to clinical characteristics. The red module contained 222 hub genes, had the strongest correlation with DFU (Figure 6 E) and exhibited a positive association (Figure 6 F).
Figure 6
Co-expression network of NRGs in DFU. A – Determination of soft threshold power. B – Cluster tree dendrogram of co-expression modules, shown in different colors. C – Cluster diagram of module eigengenes. D – TOM heatmap of 26 modules E – Heatmap of correlation analysis of module eigengenes with clinical features. Rows and columns represent modules and clinical features, respectively. F – Scatter plot of the genetic significance of genes within the blue module in relation to DFU
Moreover, the pivotal gene modules related to NRGs were identified by WGCNA. A scale-free network was constructed with the soft threshold parameter β = 12 and R2 = 0.9 (Figure 7 A). Twenty-two important modules were analyzed, and a heatmap displayed the TOM of genes associated with these modules (Figures 7 B–D). Analyzing the relationship of modules and clinical picture indicated the significance of the pink module (Figure 7 E). Figure 7 shows the correlation analysis, revealing the strong positive association of the pink module and hub gene.
Figure 7
Co-expression network of DEGs between the two cuproptosis clusters. A – Determination of soft threshold power. B – Cluster tree dendrogram of co-expression modules, shown in different colors. C – Cluster diagram of module eigengenes. D – TOM heatmap of 22 modules E – Heatmap of correlation analysis of module eigengenes with clinical features. Rows and columns represent modules and clinical features, respectively. F – Scatter plot of the genetic significance of genes within the turquoise module in relation to Cluster 1
Modeling
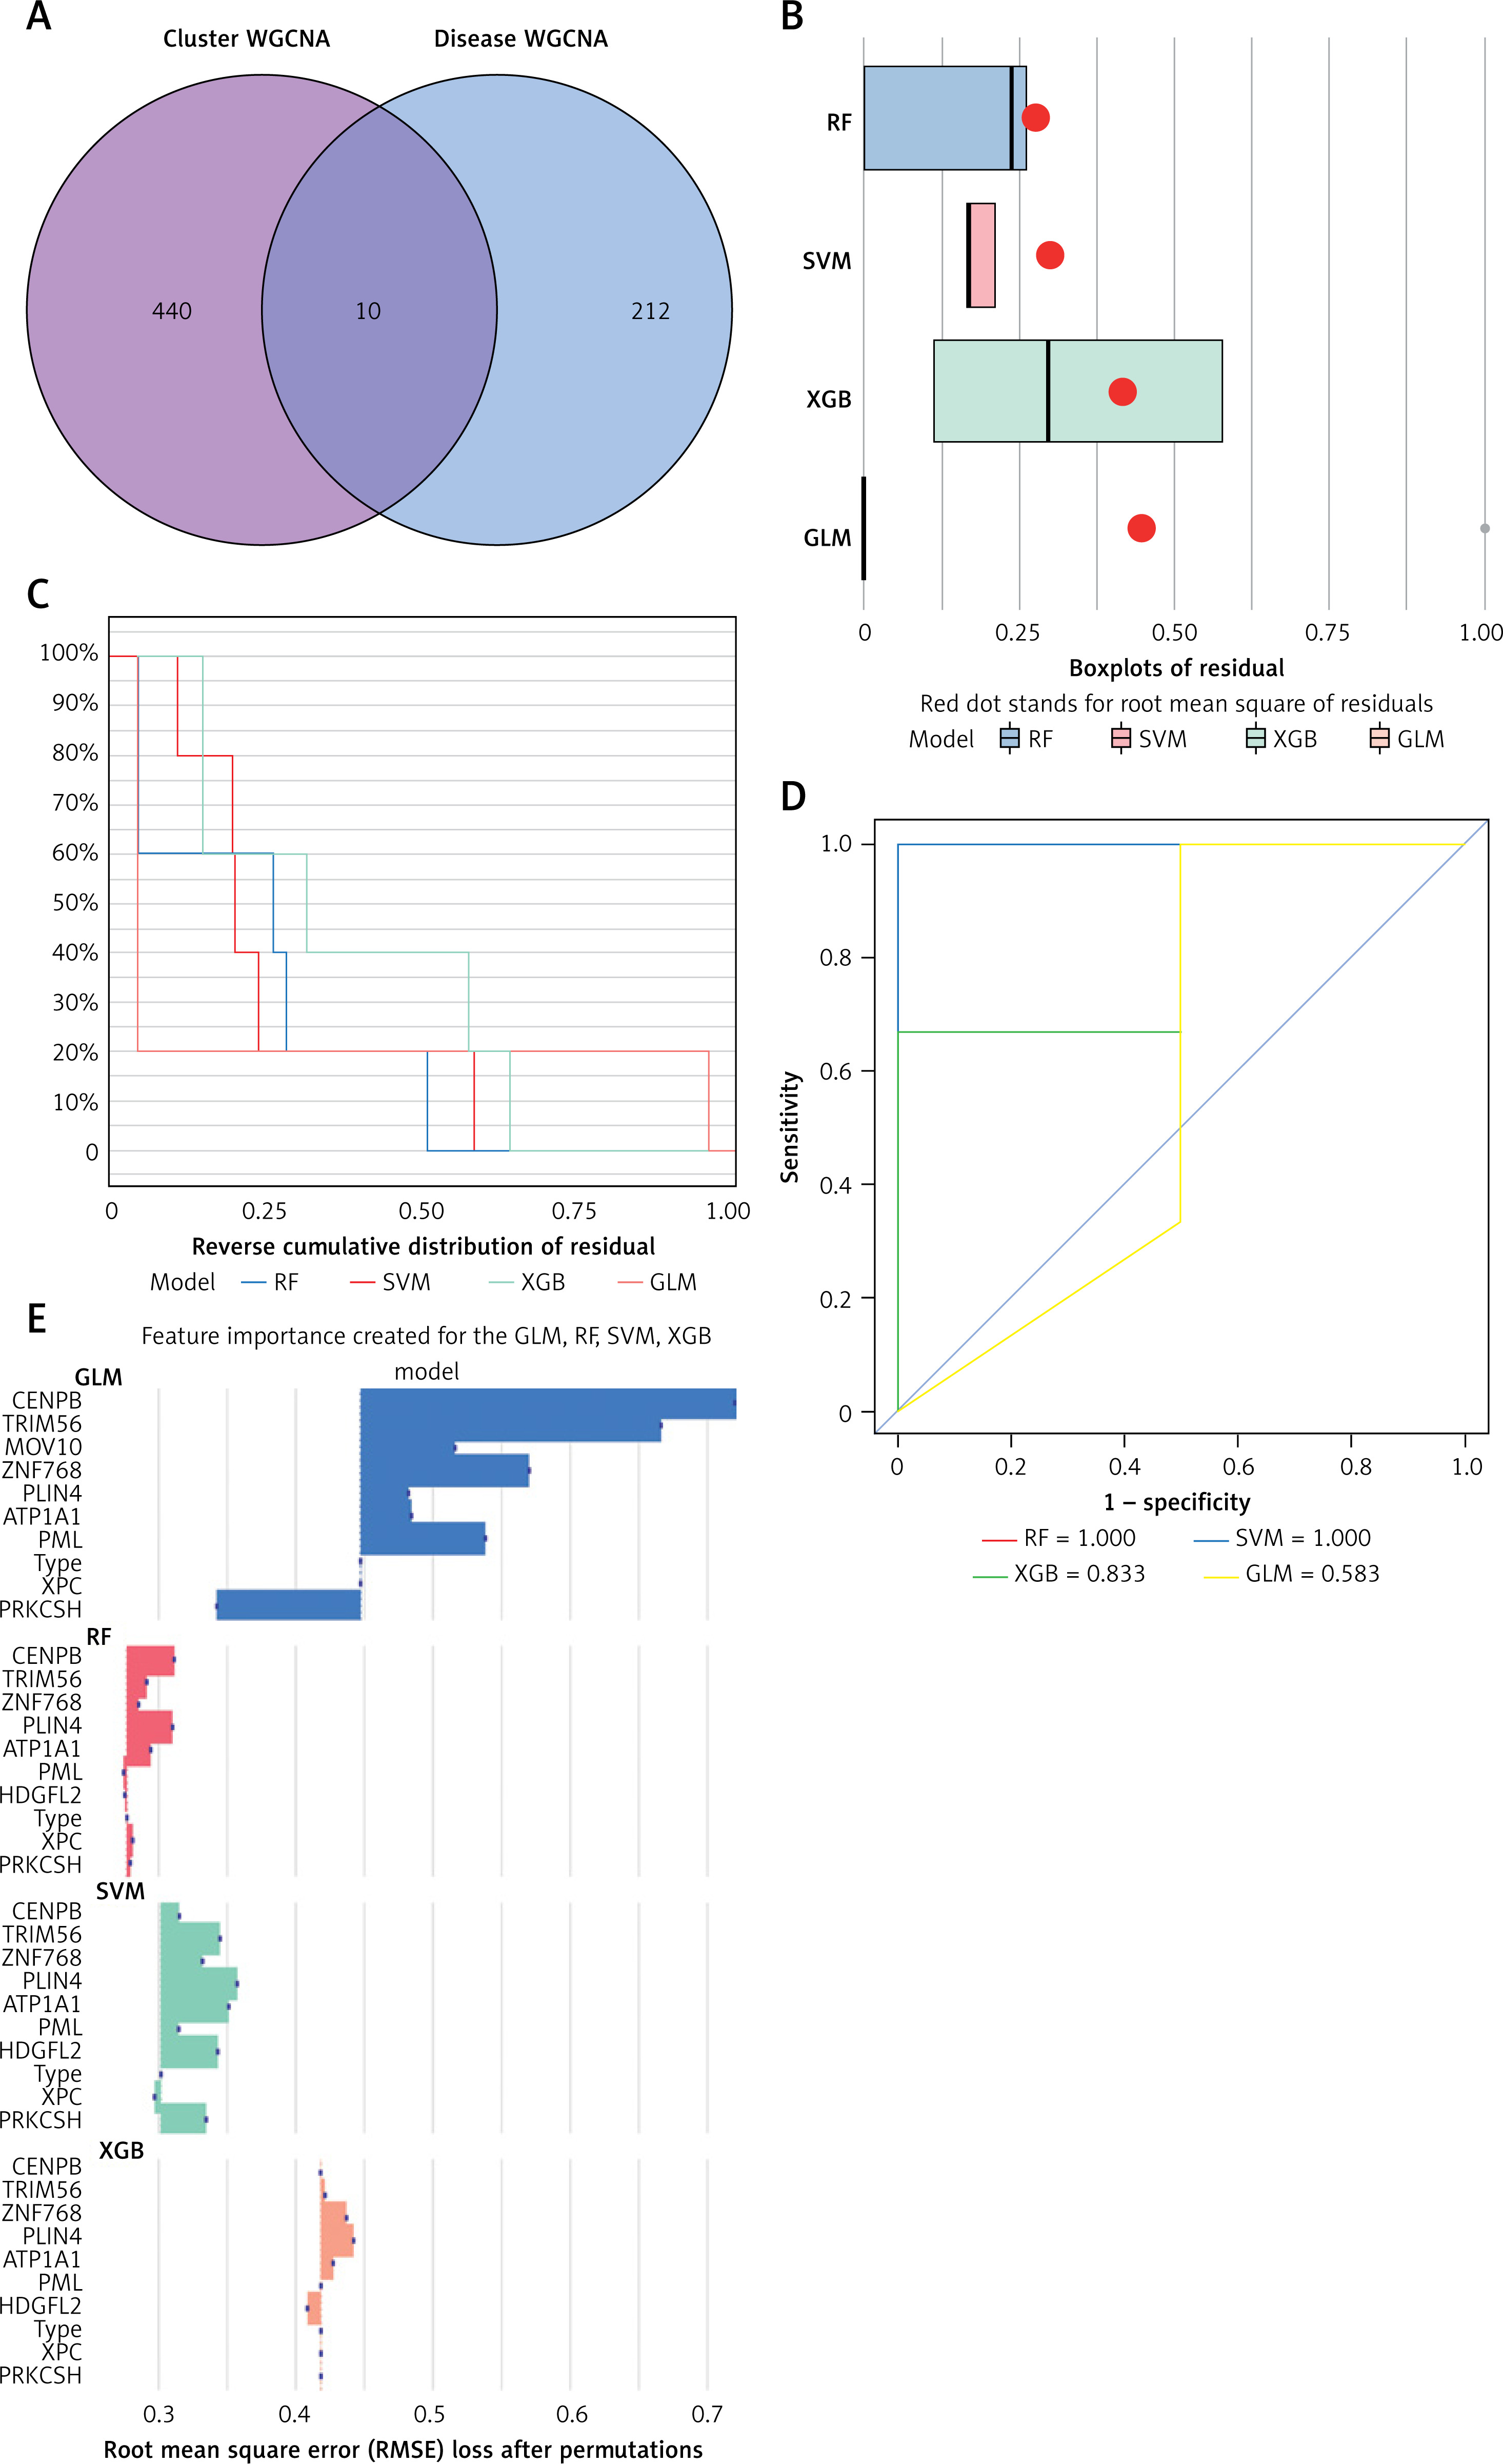
By aligning these genes of the pink module from NRG clusters with those of the red module from DFU, we identified 10 unique NRGs (Additional file 1: Appendix 1) specific to these clusters (Figures 8 A, B). The analysis of residual distributions across the four models indicated that the RF model has the largest residuals (Figure 8 B). Figure 8 C shows the top 10 important characteristics of models. As shown in Figure 8 D, the ROC analysis of the four machine models revealed that the RF model achieved a perfect AUC value of 1.000. As a result, the RF model (CENPB, TRIM56, ZNF768, PLIN4, and ATP1A1) (Figure 8 E) was selected as the most suitable model because it could most clearly distinguish between DFU and normal samples.
Figure 8
Construction of RF, SVM, XGB, and necroptosis models. A – Crossover genes of the cuproptosis cluster module and the DFU module. B – Cumulative residual distribution of the four models. C – Residual boxplots of the four machine learning models, where the red dots indicate the root mean square of the residuals. D – ROC analysis of four machine learning models with 5-fold cross-validation in the test set. E – The important features in RF, SVM, XGB, and GLM
Assessment of machine models
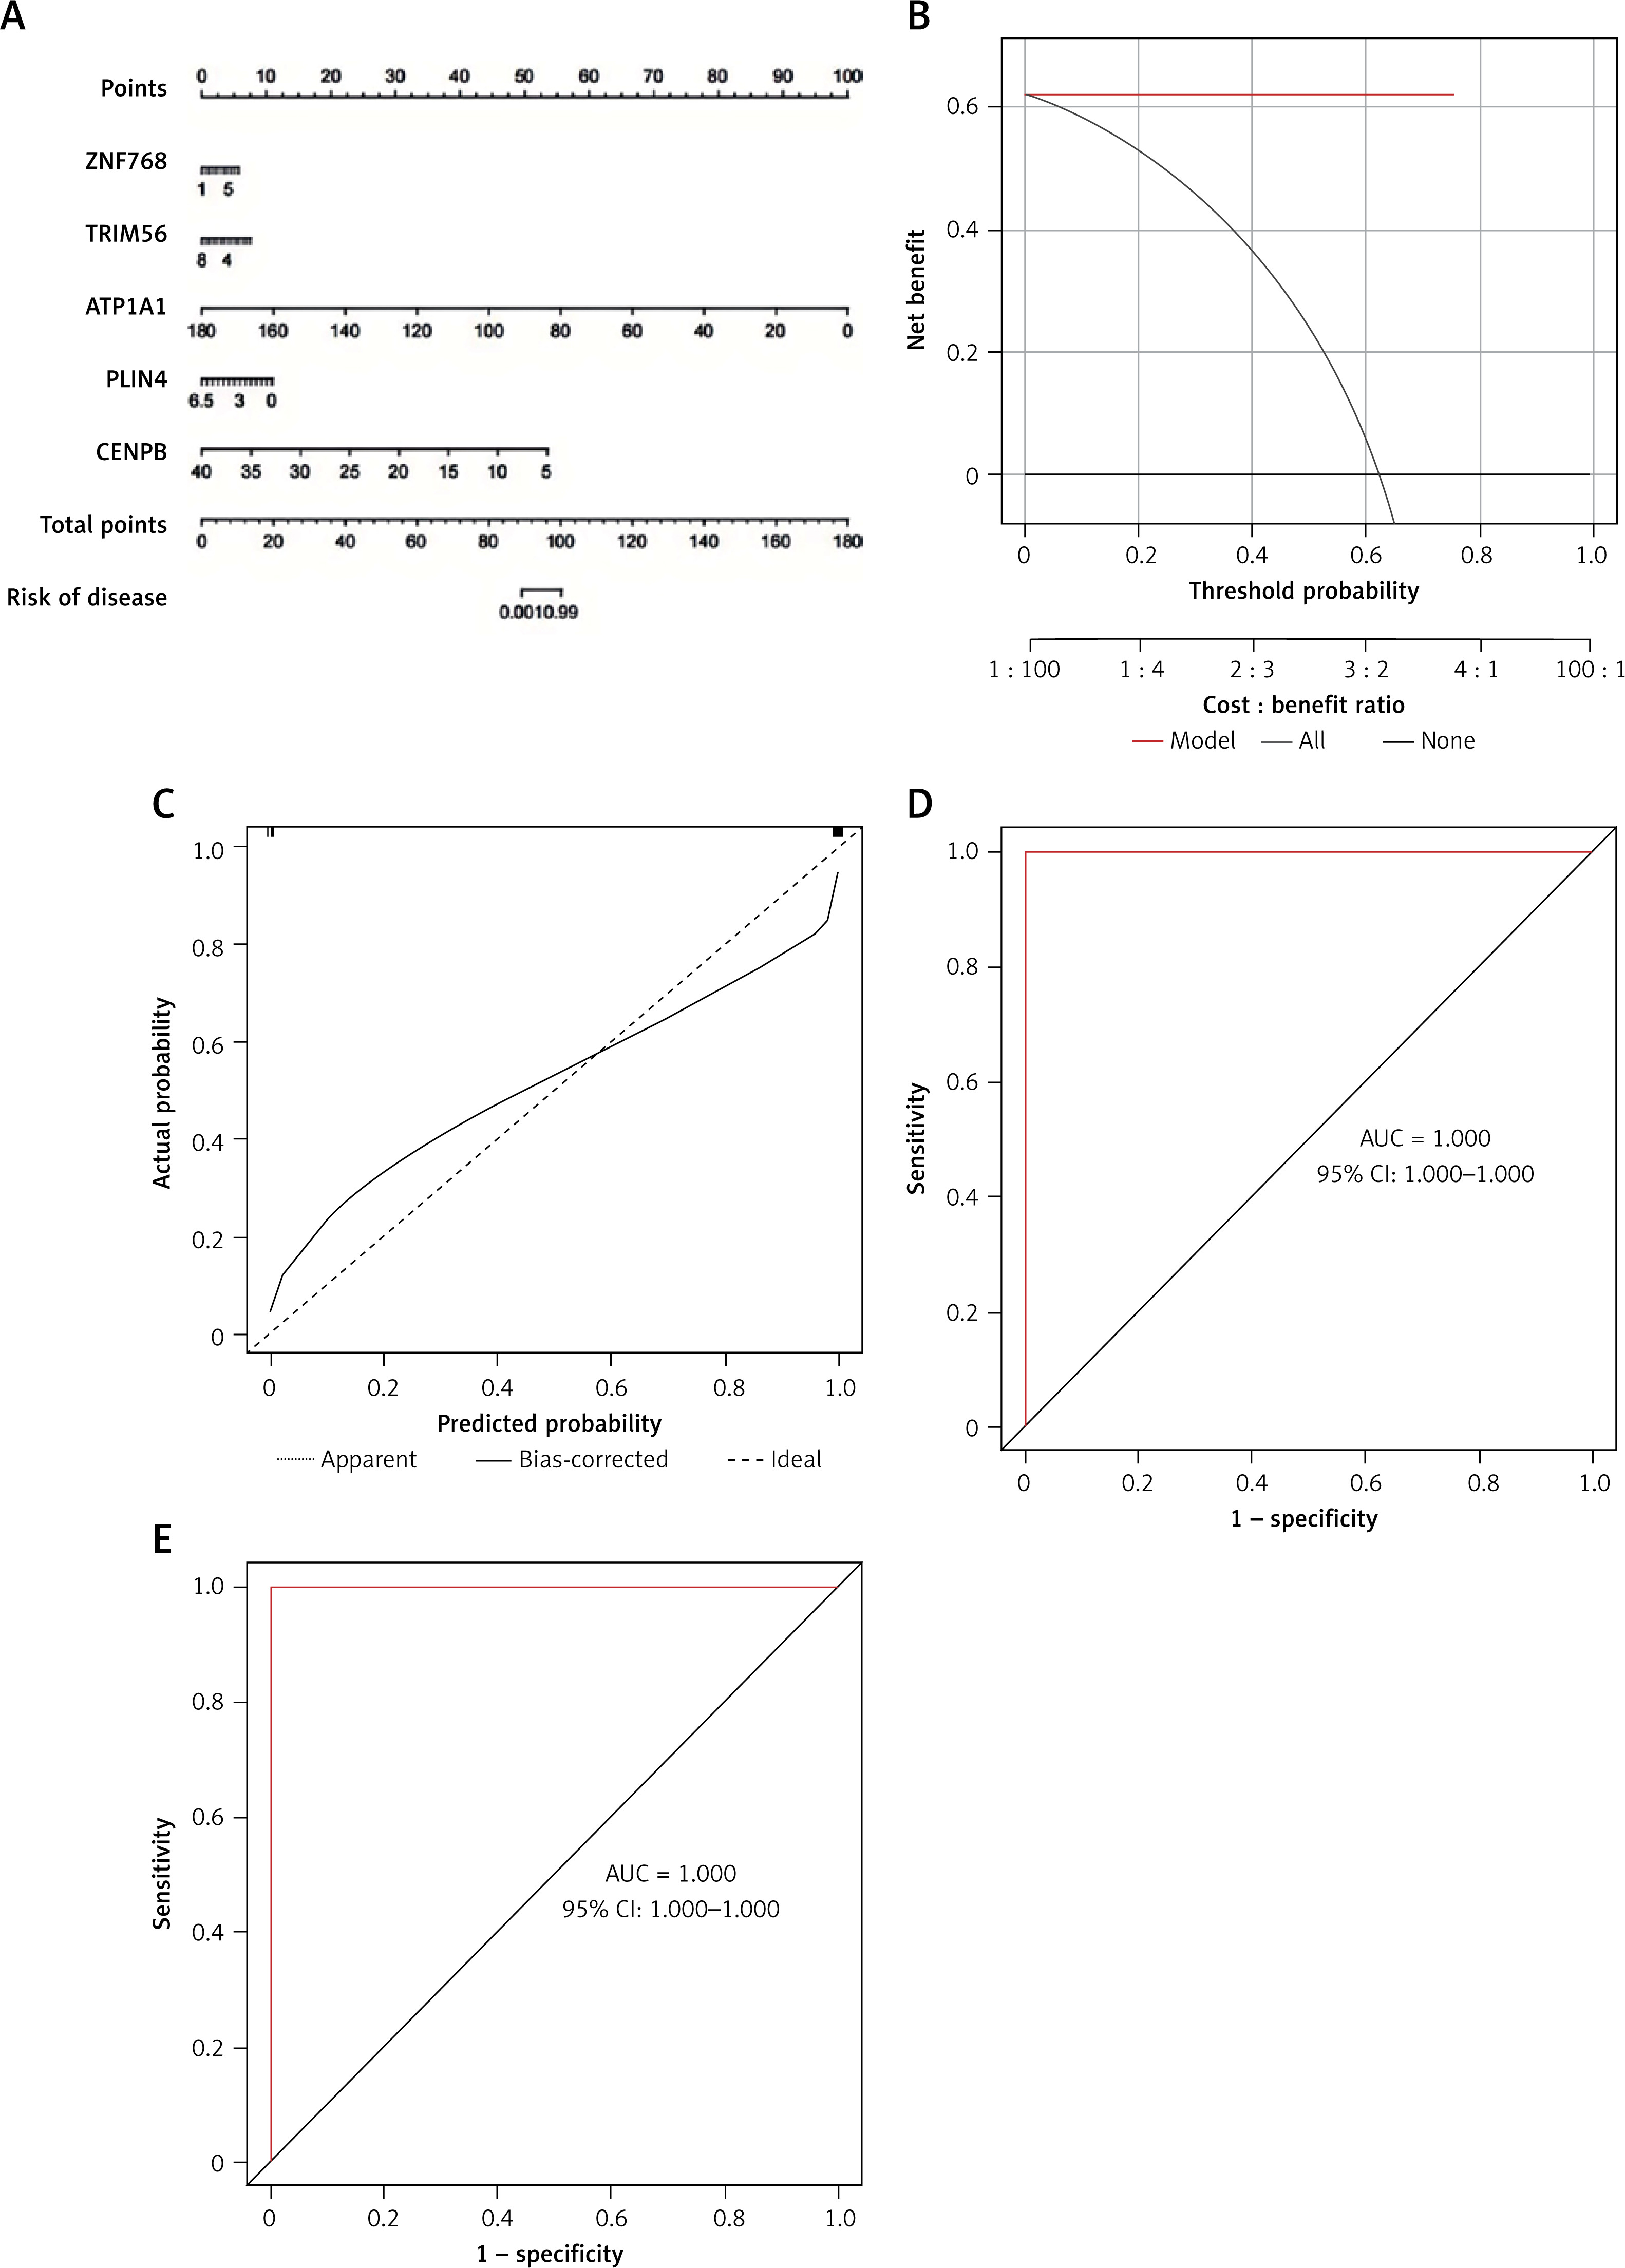
The predictive performance of the RF model was evaluated by line graphs (Figure 9 A). The calibration graph showed the closest alignment between the real and predicted risk of DFU clustering (Figure 9 B). DCA demonstrated that the line graph was highly accurate and provided valuable insights for clinical treatment (Figure 9 C). After validating the model with datasets GSE134431, GSE80178, and GSE68183 (Figure 9 D), ROC analysis showed perfect discrimination, with an AUC of 1.000. Figure 9 shows an immune-correlation analysis of the model genes, highlighting their immune function.
Drug-gene interaction analysis
The identified genes were used to predict potential drug interactions. From the target ATP1A1, we predicted drugs such as istaroxime, digoxin, acetyldigitoxin, artemether, almitrine, deslanoside, bepridil, lumefantrine, digitoxin, ouabain, eplerenone, and chloroprocaine (Additional file 1: Appendix 2).
Discussion
Diabetes is a persistent metabolic disorder that can only be managed [35], not cured. Complications result from long-term poor blood glucose control, including cardiovascular and cerebrovascular diseases, as well as renal failure [36, 37]. DFU is a common complication of diabetes, among other conditions. While nanodressings, bioactive dressings, and 3D printed dressings have been created for DFU treatment [37], current dressings prioritize therapy over real-time monitoring and wound response. Our understanding of the molecular basis of DFU has significantly increased in the last few decades [38, 39]. This highlights the potential of biomarkers for various aspects of treatment, including diagnostics, disease diagnosis, disease prognosis, and new drug research. However, the underlying mechanisms contributing to the development of DFU remain uncertain. Hence, we theorize that there is a complex relationship between NRGs and the development of DFU. We used bioinformatics methods in our study to investigate the potential connection between them [40].
Necroptosis, as a novel therapeutic target, has received increasing attention, is gaining more recognition, and its impact is seen differently in various clinical environments. Necroptosis is a basic physiological phenomenon in the human body; it involves intricate interactions between necrosis and apoptosis, demonstrating distinct regulatory pathways. The initiation of necroptosis involves the activation of specific cell surface receptors including Toll-like receptors, tumor necrosis factor receptor 1, and interferon receptors. This activation leads to the formation of the necrosome genes, involving crucial molecules such as receptor-interacting protein kinases, which are essential for orchestrating the necroptotic process [41–43]. Several research studies have connected interrupted necroptosis with brain damage and the onset of cancer, leading to the approval of medications targeting necroptosis for the treatment of different neurological conditions and malignant tumors [44]. Naito et al. found that cerebral ischemia-reperfusion injury can rapidly activate necrotic apoptosis, promote cerebral hemorrhage and neuroinflammation, and aggravate brain injury [45]. Necroptosis in triple-negative breast cancer promotes the formation of vasculogenic mimicry through the RIPK1/p-AKT/eIF4E signaling pathway [14]. The exact function of necroptosis in the development of DFU remains unclear, and this could represent a promising field.
This study employed unsupervised clustering analysis to explore distinct patterns of necroptosis regulation using the expression profiles of NRGs, identifying two unique clusters of NRGs. Furthermore, this study innovatively constructed machine learning models using disease characteristics and pivotal genes identified through WGCNA within the two unique NRG clusters. As research evolves, there is a growing trend of using machine learning models for DFU prediction. Unlike conventional univariate analysis, machine learning typically uses a multivariate analysis method, considering the interactions among variables. Hence, machine learning models tend to be more precise and produce more dependable outcomes. The caret R package serves as a comprehensive machine learning toolkit aimed at solving prediction issues. Its main attribute is the rapid setup of essential elements, ultimately completing the model prediction [46]. We evaluated the predictive capabilities of the following models: RF, SVM, XGB, and GLM. The model built using RF demonstrated extremely high accuracy on the test dataset (AUC = 1.000), highlighting a strong predictive level. Furthermore, we developed a bar and line chart model for DFU, employing the following genes: CENPB, TRIM56, ZNF768, PLIN4, and ATP1A1. We found that the model demonstrated strong predictive ability, suggesting its viability for clinical use. Overall, the RF model using five genes to identify DFU subtypes proved to be effective.
Using the RF algorithm, we detected five key NRGs (CENPB, TRIM56, ZNF768, PLIN4, and ATP1A1) and confirmed their diagnostic capabilities through a separate dataset, suggesting their relevance to the mechanism of DFU. The CENPB gene is a critical protein that operates in the centromeric region of chromosomes, ensuring proper chromosome segregation during cell division [47]. CENPB predominantly attaches to a-satellite DNA at the centromere and participates in the formation of kinetochores, which connect chromosomes to the mitotic spindle during cellular division [48]. CENPB plays a role in controlling various cellular functions, such as gene expression, DNA repair mechanisms, and DNA replication [49]. TRIM56, part of the TRIM protein family, acts as an E3 ubiquitin ligase that is inducible by interferons and can increase expression when stimulated by double-stranded DNA. It modulates the stimulator of interferon genes, facilitating the synthesis of type I interferon and boosting innate immune responses [50]. PLIN4 belongs to the PAT protein family involved in lipid storage droplets and serves as a key regulator of lipid storage [51]. Reduced expression of this protein has been linked to weight gain [52]. ATP1A1 causes a range of disorders, impacting the endocrine and neuromuscular systems [53, 54], while also disrupting the renal and central nervous systems [55]. According to a recent study, elevated ATP1A1 expression correlates with unfavorable long-term outcomes in individuals diagnosed with colon cancer and regulates tumor progression [56]. Unfortunately, there are limited studies on CENPB, TRIM56, ZNF768, PLIN4, and ATP1A1 in DFU.
The acute wound healing process comprises four dynamic overlapping and differentiated stages: hemostasis, inflammation, proliferation, and remodeling. This process involves multiple cell types, which are strictly controlled and associated with cell migration and proliferation, ECM deposition, and tissue remodeling. Chronic inflammation is the main culprit of normal wound healing disorder [57]. Chronic inflammation impairs wound healing by altering the bactericidal function of immune cells, reducing vascular perfusion, and disrupting the basement membrane and collagen synthesis. Hyperglycemia leads to the formation of microthrombus through the production of inflammatory mediators mediated by the increase of reactive oxygen species, pericellular degeneration, basement membrane thickening, endothelial hyperplasia, decreased vasodilation, and increased coagulant promoting markers. Microthromboembolism may be more likely to occur in microvessels, thus aggravating the local tissue ischemia and hypoxia of diabetic wound and nerve damage [58].
Research on biomarkers related to DFU remains somewhat scarce. Lately, bioinformatics analysis has emerged as a useful means for investigating the detailed and multifaceted relationships between cell necrosis, cell apoptosis, and DFU [59, 60]. A detailed investigation revealed potential biomarkers for DFU using transcriptomics and proteomics bioinformatics approaches. It highlighted MMP9, FABP5, and ITGAM as central genes, indicating their potential roles as molecular targets in DFU immunotherapy treatments [61]. However, there are only a handful of studies focusing on predictive models related to necroptosis in DFU. By exploring the mechanisms of necroptosis, this study offers valuable insights for the development of effective immunotherapy strategies in DFU. Initially, we gathered extensive data about NRGs from the GEO databases to build on prior study insights. We primarily analyzed GSE134431, supplemented by GSE80178 and GSE68183, to verify the trends observed. The validity of the study was reinforced by GO and KEGG analyses, along with the support of GSVA. Finally, few existing predictive models for NRGs offer targeted suggestions for future immunoinflammatory studies or treatments involving necroptosis interference in DFU. The study employed machine learning techniques to develop a diagnostic framework for necroptosis and DFU, integrating immune cell infiltration analysis. The computational outcomes highlighted the connections between necroptosis, DFU, and the immune responses, broadening the approach to linking gene expression with clinical practice. Moreover, ongoing advances in artificial intelligence provide valuable insights for medical professionals and hold promise for enhancing our understanding of DFU and guiding future therapeutic strategies.
Our model is not without limitations. First of all, depending on data from the GEO database introduces difficulties in evaluating the quality and reliability of statistical data. To mitigate this, GSE134431 was selected as the primary dataset, and model validation was conducted using GSE13443, GSE80178, and GSE68183 due to their well-defined grouping. Secondly, the sample size of this study was not sufficiently large, which may have impacted the robustness of the findings. Future studies with a larger sample size are planned to further validate these results. Thirdly, a significant challenge lies in the limited analysis of genes associated with NRGs and DFU, resulting in a lack of knowledge regarding the underlying mechanisms. Future research should include foundational experiments to enhance validation. Lastly, further exploration of parameter selection within the model, combined with experimental studies, is required to identify the final genes.
In conclusion, necroptosis plays a role in the synthesis of CENPB, TRIM56, ZNF768, PLIN4, and ATP1A1, leading to the construction of a diagnostic model. Future enhancements include expanding data sources and undertaking further research to explore the potential of effective treatments in reducing inflammation in DFUs by targeting necroptosis pathways. Our findings highlight promising biomarkers for the development of DFU treatment strategies. This study examined the possibility of using NRGs as biomarkers for DFU in order to advance treatment of this condition.