Introduction
Gastric carcinoma (GC) is the second most common cancer and the second most common cause of cancer-related death in China [1]. There were approximately 679,100 newly diagnosed and approximately 498,000 deaths in 2015, and the incidence and mortality of GC account for 15.8% and 17.7%, respectively, of all cancer cases in China [1]. However, the molecular mechanisms underlying gastric carcinogenesis have not been completely clarified. Recently, there has been strong interest in exploring the roles of non-coding RNAs, including circular RNAs (circRNAs), long non-coding RNAs (lncRNAs) and microRNAs (miRNAs), in the process of GC [2–4].
CircRNAs are a novel class of endogenous noncoding RNA and are characterized by single-stranded, covalently closed circular molecules without 5′ to 3′ polarity and a polyadenylated tail [5, 6]. CircRNAs are predominantly generated in eukaryotes via four cyclized models: back-spliced exons, circular intronic RNAs, exon-intron circRNAs and intergenic circRNAs [7, 8]. Moreover, circRNAs have four major functions, including as competing endogenous RNAs (ceRNAs) to sponge microRNAs (miRNAs), interaction with RNA binding proteins to regulate the cell cycle and proliferation and the management of gene transcription and protein translation [8, 9]. A growing body of research indicates that numerous circRNAs are deregulated in various tumor tissues and have been implicated in cancer-related processes, including proliferation, migration, invasion and apoptosis [10–13]. Molecular mechanistic investigation has demonstrated that circRNAs mainly function as miRNA sponges to neutralize miRNAs levels and regulate their downstream targets in the tumorigenesis of cancer, including GC [2].
miRNAs are small, non-coding and single-stranded RNAs (approximately 22 nucleotides) and function as post-transcriptional regulators to modulate gene expression by sequence-specific interaction with their 3′-untranslated regions (3′-UTRs) [14]. Many enlightening and forecasting studies highlight the potential of miRNAs as diagnostic and prognostic biomarkers and therapeutic targets for the treatment of malignant tumors [14, 15]. miR-149, as one of the most well-characterized anti-oncomiRs, is reduced in a variety of cancers and cell lines, including bladder cancer, colorectal cancer and breast cancer [16–18]. In GC, lncRNAs as ceRNAs contain conserved miRNA binding sites and recruit miR-149 to the inactivation of their expression and the reinforcement of their downstream targets, which result in the acceleration of cell proliferation and metastasis [19, 20].
miRNAs have been recently identified to regulate the interleukin 6 (IL-6)/signal transducer and activator of transcription 3 (STAT3) signaling pathway in cancer, and the IL-6/STAT3 pathway is considered as the most promising new target for cancer therapy [21]. For example, miR-9 loss of function leads to over-activation of the IL-6/STAT3 pathway through targeting IL-6, resulting in the proliferation, migration and malignant transformation of HeLa cells in vivo and in vitro [22]. miR-34a suppresses IL-6/STAT3-modulated epithelial-to-mesenchymal transition, invasion and metastasis in colorectal cancer [23]. In addition, miR-149 improves the tumor microenvironment in GC by mediating IL-6 signaling [24]. In the present study, we found that IL-6 was a direct target of miR-149, and hsa_circ_0017728 was used as a miRNA sponge to silence the function of miR-149.
The purpose of the present study was to investigate whether hsa_circ_0017728/miR-149/IL-6/STAT3 cascade signaling was associated with the development and progression of GC.
Material and methods
Clinical specimens
Fifty-five pairs of GC tumor and non-cancerous tissues were collected from patients who underwent a surgical operation at the Department of Gastrointestinal Surgery, Sichuan Academy of Medical Sciences & Sichuan Provincial People’s Hospital (Chengdu China). Then the specimens were maintained at –80°C for further analysis. The specimens of GC patients were classified according to the 2004 World Health Organization criteria and TNM staging system. Written informed consent was obtained from all of the participants prior to collection of samples. The study was approved by the Ethics Committee of the Sichuan Academy of Medical Sciences & Sichuan Provincial People’s Hospital (Chengdu China) according to the Helsinki Declaration.
Cell culture and treatment
Human normal gastric epithelial cell line GES-1 and five GC cell lines (AGS, BGC-823, MKN-28, MGC-803 and SGC-7901) were purchased from the Cell Bank of China Academy of Sciences (Shanghai, China). Cells were cultured in Dulbecco’s modified Eagle’s medium (DMEM; Invitrogen, Carlsbad, CA, USA) with 10% fetal bovine serum (Thermo Scientific HyClone, Beijing, China), 100 U/ml penicillin and 100 mg/ml streptomycin in a humidified incubator (Thermo Fisher Scientific, Inc., Waltham, MA, USA), with 5% CO2, 95% air atmosphere.
High-throughput sequencing
Total RNA was extracted using the miRNeasy Mini Kit (Qiagen, Inc., Valencia, CA, USA) and preserved at –80°C until use. NanoDrop ND-2000 (Thermo Fisher Scientific, Wilmington, DE, USA) was used to measure the concentration and purity of RNA. Total RNA (approximately 4 μg) from each sample was subjected to the RiboMinus Eukaryote Kit (Qiagen) to eliminate ribosomal RNA. Purified RNAs were treated with RNase R (Epicenter, 40 U, 37°C, 3 h). Ovation RNA-Seq System V2 (NuGEN, CA, USA) was used to generate the libraries for RNA sequencing, according to the manufacturer’s instructions. Barcoded libraries were then prepared using the NEBNext DNA Library Prep Master Mix Set for Illumina, followed by gel excision and extraction to collect the 250-bp fragments. Fragments were sequenced on the HiSeq2000 platform using paired-end reads, with an average of 30 million reads per sample. Sequence reads were first multiply mapped against the GRCh37/hg19 human reference genome using TopHat 2.1. Unmapped reads were then extracted and mapped onto the relevant reference genome using TopHat-Fusion. Reads that split and aligned on the same chromosome but in noncollinear ordering were extracted as candidate back-spliced junction reads. Back-spliced junction reads were further realigned against existing gene annotations to determine the precise positions of donor or acceptor splice sites for each back-spliced event. Finally, back-spliced junction reads were combined and scaled to RPB (reads per billion mapped reads, including TopHat mapping and TopHat-Fusion mapping) to quantify every back-spliced event. Differentially expressed circRNAs were selected by a p-value less than 0.001 and |Log2fold change| ≥ 1, and the analysis methods were performed as previously described [25, 26].
Cell transfection
MKN-28 and MGC-803 cells were transfected with the corresponding plasmids using Lipofectamine 2000 (Invitrogen, Thermo Fisher Scientific, Inc., Waltham, MA, USA) according to the manufacturer’s protocol. The small interfering RNA (si-RNA) was designed using Circinteractome (https://circinteractome.nia.nih.gov) to silence the function of hsa_circ_0017728. The targeted sequence of the functional si-0017728 was 5′-GGGGTTTCTAGAGTTGATCAT-3′; and si-Control (si-Con) served as a control. miR-Control (miR-Con), miR-149 mimics, Scramble and miR-149 inhibitors were synthesized by RiboBio (Guangzhou, China). The sequence of recombinant human IL-6 (rhIL-6) was obtained from reverse transcription (RT) of total RNA, which was extracted from GC tissues. RhIL-6 and pUC18 plasmid were reconstructed by EcoR I/BamH I double enzyme digestion. Primers used for plasmid construction are listed as follows: forward primer 5′-CGGAATTCATGATTGACAAACAAATTCGG-3′ and reverse primer 5′-CGCGGATCCTTACATTTGCCGAAGAG-3′.
CCK8 assay
MKN-28 and MGC-803 cells were seeded in a 96-well plate for 24, 48 and 72 h transfected with corresponding plasmids. Cell viability was detected using the CCK-8 Cell Proliferation/Viability Assay Kit (Dojindo, Japan). Absorbance was recorded at 450 nm using Elx800 Reader (Bio-Tek Instruments Inc., Winooski, VT, USA).
Wound healing assay
MKN-28 and MGC-803 cells were trypsinized and reseeded in each well of a new 6-well plate. After 24 h incubation, the confluent cell monolayers were scratched with a 10 μl sterile pipette tip. Then the non-adherent cells were washed off with sterilized PBS and serum-free medium was added to the wells. The gap area caused by the scratch was monitored by the inverted microscope (Olympus, Japan). Three random non-overlapping areas in each well were pictured at 24 h post-scratch. Scratch width between the two linear regions was quantitated for assessing the capacity of cell migration.
Flow cytometry
MKN-28 and MGC-803 cells were seeded in the 96-well plate and transfected with corresponding plasmids for 48 h. Cell apoptosis was monitored using an Annexin V-FITC/PI apoptosis detection kit (Carlsbad, Calif., USA) according to the manufacturer’s protocol. Apoptotic cell proportion was analyzed by flow cytometry (FACScan, BD Biosciences, San Jose, CA, USA) and calculated by CELL Quest 3.0 software (BD Biosciences).
Luciferase reporter assay
The wild-type (WT) and mutant-type (Mut) hsa_circ_0017728 and IL-6 were inserted into the multiple cloning sites of the luciferase expressing pMIR-REPORT vector (Ambion; Thermo Fisher Scientific, Inc.). For the luciferase assay, MKN-28 and MGC-803 cells (1 × 10⁵) were seeded into 24 wells and co-transfected with miR-149 mimics or inhibitors using Lipofectamine 2000 (Invitrogen; Thermo Fisher Scientific, Inc.), according to the manufacturer’s protocol. The luciferase activity was measured using a luciferase reporter assay kit (Promega, Madison, WI, USA) according to the manufacturer’s protocol.
Reverse transcription-quantitative polymerase chain reaction (RT-qPCR)
Total RNA was extracted using the miRNeasy Mini Kit (Qiagen, Inc., Valencia, CA, USA). The TaqMan RT kit (Applied Biosystems; Thermo Fisher Scientific, Inc.) and TaqMan MicroRNA assay (Applied Biosystems; Thermo Fisher Scientific, Inc.) were used to perform RT-qPCR of miR-193-3p, according to the manufacturer’s protocol. U6 small nuclear RNA was used as an endogenous control. The following primers were used: miR-149: forward, 5′-GGCTCTGGCTCCGTGTCTT-3′, and reverse, 5′-CAGTGCAGGGTCCGAGGTATT-3′; U6 forward, 5′-CAAATTCGTGAAGCGTTCCATA-3′, and reverse, 5′-AGTGCAGGGTCCGAGGTA TTC-3′. Divergent primers were designed to amplify the head-to-tail splicing of circRNA using ABI7300 System (Applied Biosystems, Foster City, CA, USA) with TaqMan Universal PCR Master Mix (Thermo Fisher Scientific, Inc.). The relative expression levels of circRNAs were calculated using the 2–ΔΔCq method [27] and normalized to the internal control glyceraldehyde 3-phosphate dehydrogenase (GAPDH). The following PCR primers were used: hsa_circ_0103546: forward, 5′-ATCCAGGCAATTGCACCCCA-3′, and reverse, 5′-CTTGGCAA-AGGATGCACGTC-3′; hsa_circ_0101031: forward, 5′-GGCTTTTGAATCTCAGCCAGC-3′, and reverse, 5′-GGCCTTGTCACAAAAATGGCA-3′; hsa_circ_0017-728: forward, 5′-CATGCAATCGTGGTTTGCCA-3′, and reverse, 5′-GGGGTTGATTTTGGCAGCTT-3′; hsa_circ_0103948: forward, 5′-TGGATTACAGCAACAGTT-GTCTTC-3′, and reverse, 5′-ACACTTGAATTTGTTT-TCCTTCCT-3′; hsa_circ_0103942: forward, 5′-AGTCAAAGTGCCACAGAGGTT-3′, and reverse, 5′-GTAGAGGGTTGCTGAACGGG-3′; GAPDH forward, 5′-GCACCGTCAAGCTGAGAAC-3′, and reverse, 5′-TGGTGAAGACGCCAGTGGA-3.
Western blotting
Proteins were extracted with radio immunoprecipitation assay (RIPA) buffer (Beyotime Institute of Biotechnology, Haimen, China). Western blotting assay was performed as previously described [28]. The membranes were incubated with the primary antibody for IL-6 (cat. no. sc-130326; dilution: 1 : 1,000; Santa Cruz Biotechnology, Inc., Dallas, TX, USA), STAT3 (cat. no. sc-8019; dilution: 1 : 1,000; Santa Cruz Biotechnology) and p-STAT3 (cat. no. 9134; dilution: 1 : 1,000; Cell Signaling Technology, Inc., Danvers, MA, USA) at room temperature for 2 h. Then, the membrane was incubated at room temperature for 1 h with the appropriate horseradish peroxidase-conjugated anti-mouse secondary antibody (cat. no. sc-516102; 1 : 10,000; Santa Cruz Biotechnology, Inc.) and visualized using chemiluminescence (Thermo Fisher Scientific, Inc.). β-actin (1 : 2,000; cat. no. sc-130065; Santa Cruz Biotechnology, Inc.) was used as the control antibody. Signals were analyzed with Quantity One software version 4.5 (Bio Rad Laboratories, Inc., Hercules, CA, USA).
Statistical analysis
Data were presented as mean ± SEM. Statistical analysis was performed using IBM SPSS Statistics Version 19.0 (SPSS Inc., Chicago, IL, USA) and GraphPad Prism Version 7.0 (GraphPad Software, Inc., La Jolla, CA, USA). Student’s t-test was used to analyze two-group differences. Inter-group differences were analyzed by one-way analysis of variance, followed by Tukey’s post hoc analysis. Survival analysis was performed using the Kaplan-Meier method with the log-rank test applied for comparison. Spearman’s rank analysis was used to identify the correlation between hsa_circ_0017728 and miR-149. P < 0.05 was considered to indicate a statistically significant difference.
Results
Altered expression profiles of circRNAs in tumor tissues from GC patients
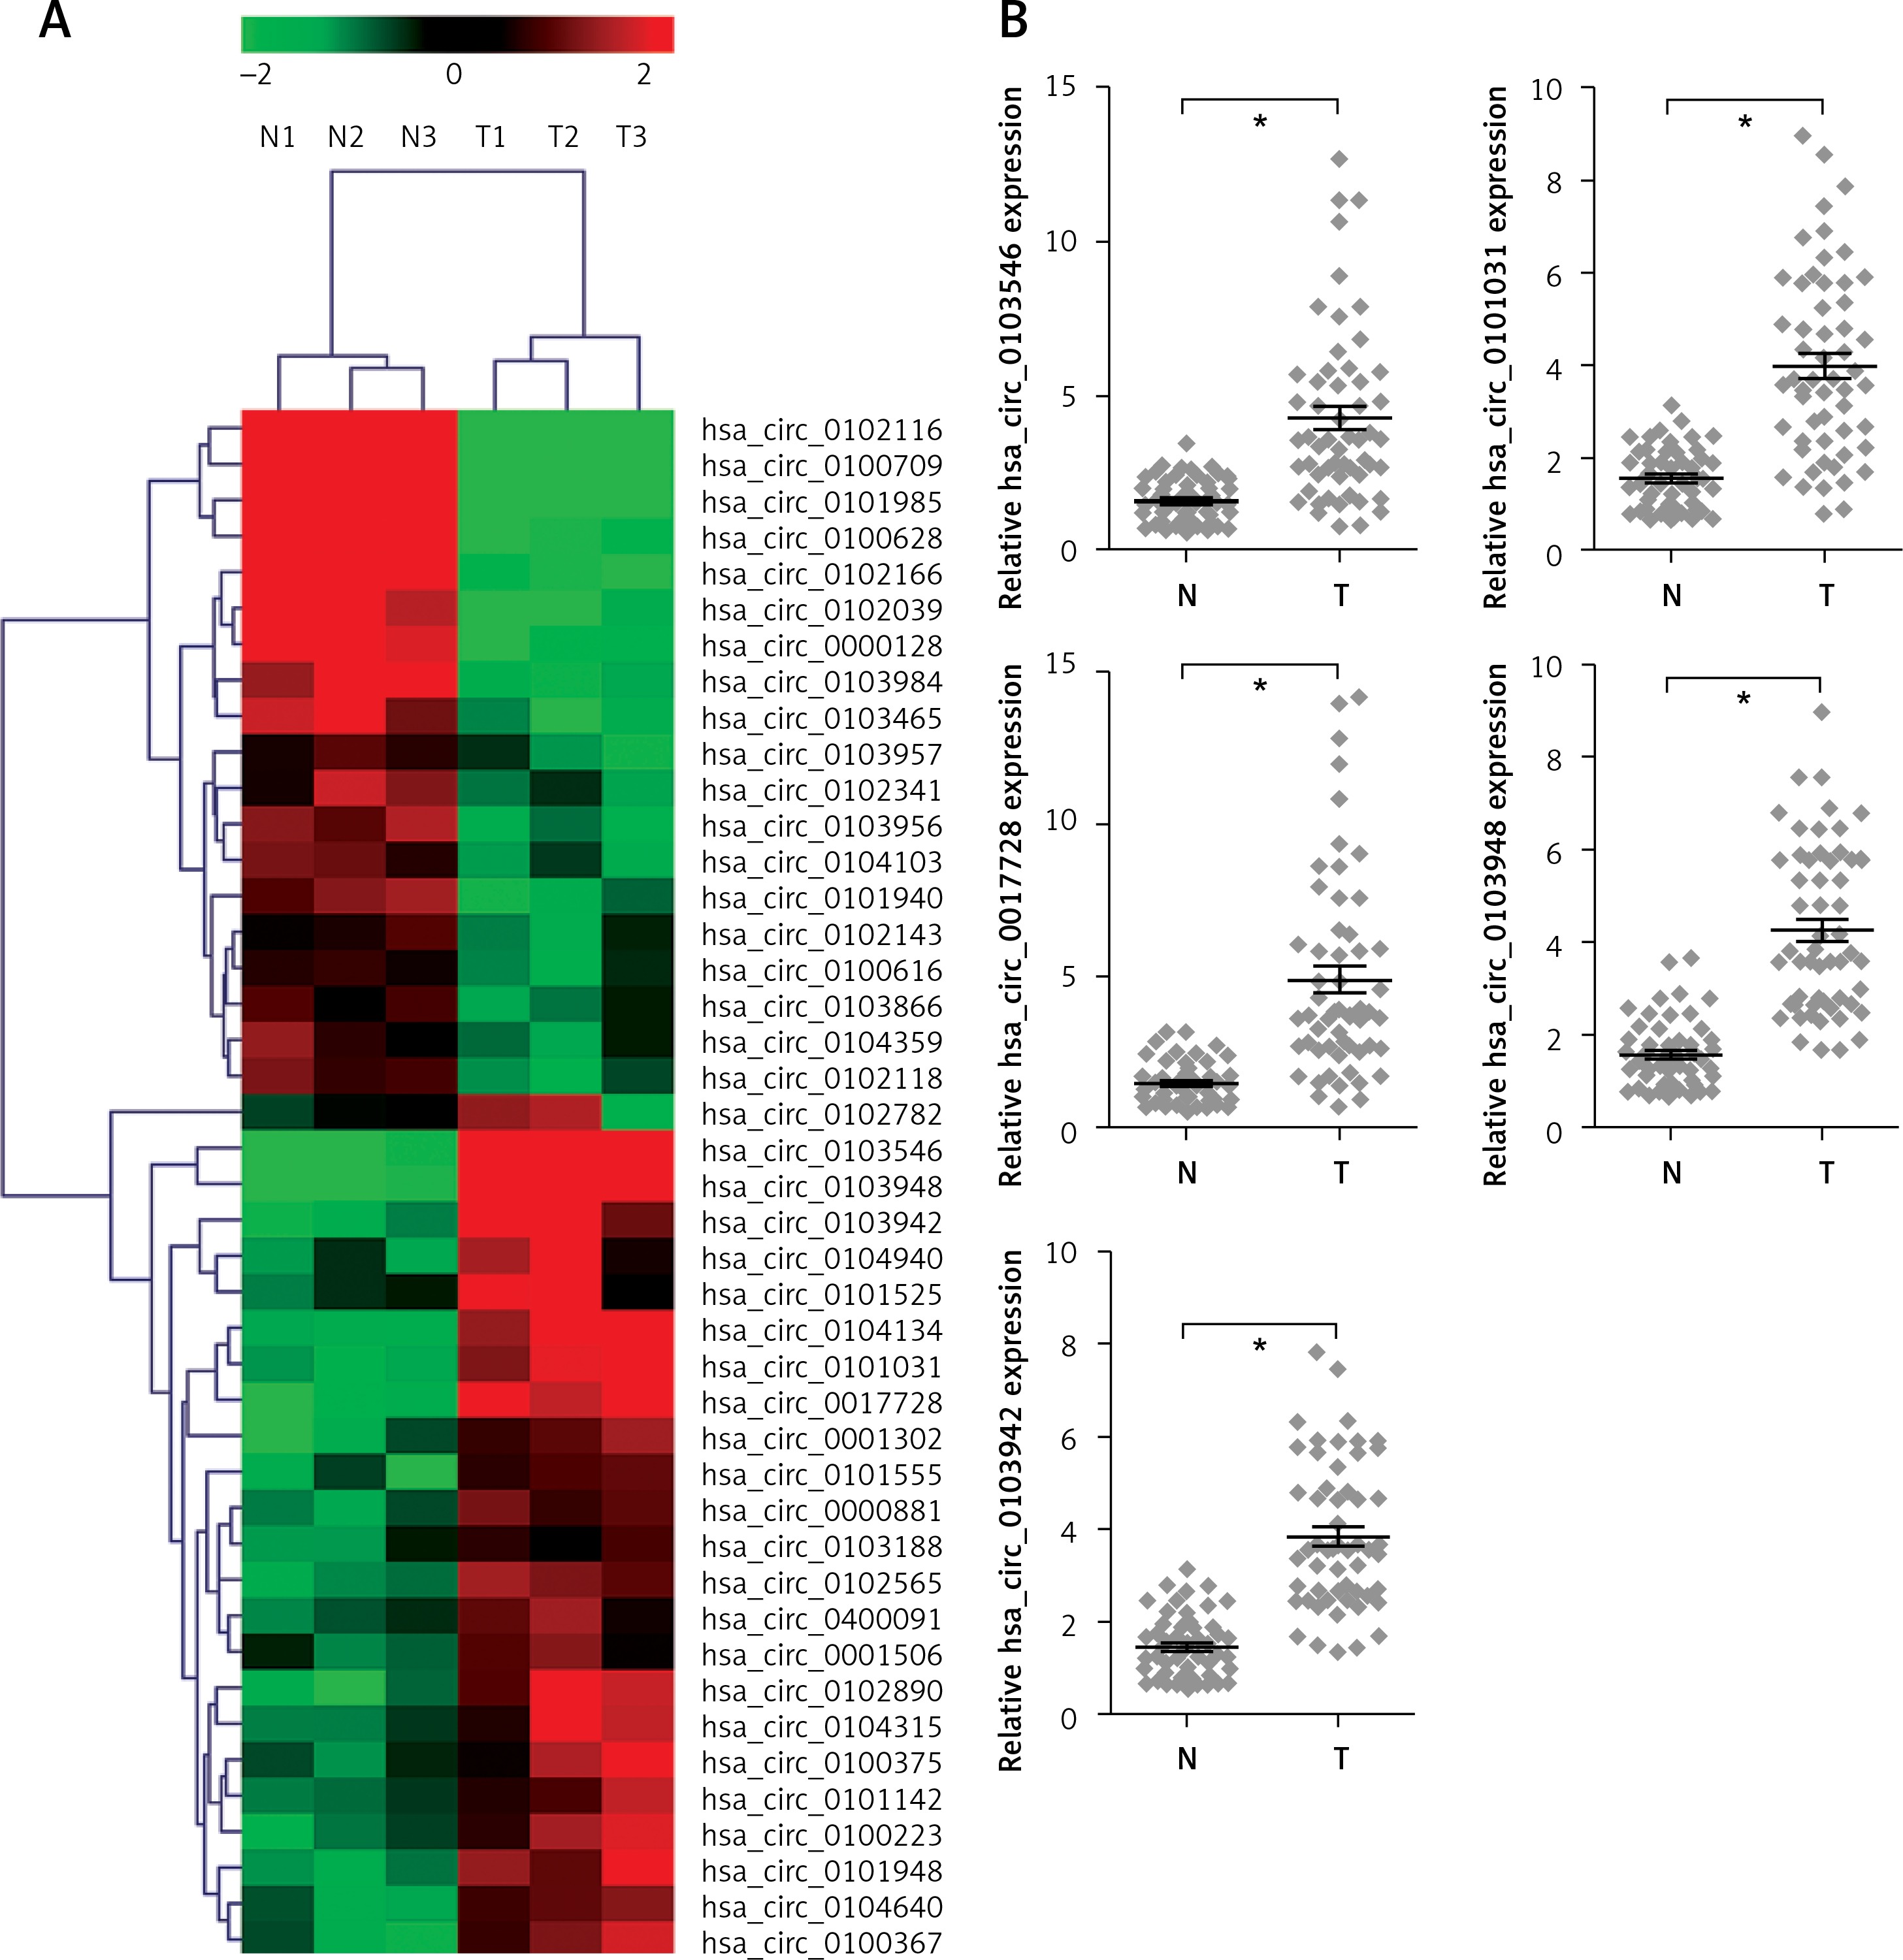
To investigate the roles of circRNAs in gastric carcinogenesis, we selected out differentially expressed circRNAs using high-throughput sequencing. Based on the screening criteria p < 0.001, false discovery rate ≤ 0.001 and |Log2fold change| ≥ 1, 43 circRNAs were significantly and differentially expressed in tumor tissues compared with corresponding non-cancerous tissues. Among them, 19 and 24 circRNAs were down-regulated and up-regulated, respectively (Figure 1 A). To validate the results of high-throughput sequencing, the top 5 upregulated circRNAs (hsa_circ_0103546, hsa_circ_0101031, hsa_circ_0017728, hsa_circ_0103948 and hsa_circ_0103942) were selected according to the fold change, and RT-qPCR assay was performed to verify the expression of 5 upregulated circRNAs in 55 pairs of tumor and non-cancerous tissues from GC patients. RT-qPCR and high-throughput sequencing independently came to the same conclusion of 5 upregulated circRNAs expression (Figure 1 B). In addition, we found that hsa_circ_0017728 expression showed the highest levels among 5 upregulated circRNAs and was selected to focus on our further study (Figure 1 B).
Figure 1
High-throughput sequencing was used to determine differentially expressed circRNAs in GC tissues and corresponding non-cancerous tissues. The cluster heatmap represented the 43 differentially expressed circRNAs in 3 pairs of GC tumor and non-cancerous tissues, which were selected out according to the screening criteria p < 0.001, false discovery rate ≤ 0.001 and |Log2fold change| ≥ 1, and red color and green color indicated high and low expression level, respectively (A). The expression levels of the top 5 up-regulated circRNAs – hsa_circ_0103546, hsa_circ_0101031, hsa_circ_0017728, hsa_circ_0103948 and hsa_circ_0103942 – were selected according to the fold change, and RT-qPCR assay was performed to verify their expression in 55 pairs of tumor and non-cancerous tissues from GC patients (B)
*P < 0.05.
Clinical significance of hsa_circ_0017728 in GC patients
First, we revealed that hsa_circ_0017728 was up-regulated in 87.3% of GC patients (48/55) (Figure 2 A). In addition, high hsa_circ_0017728 expression was closely associated with poorer pathological differentiation (Figure 2 B), higher TNM stage (Figure 2 C) and lymph node metastasis (Figure 2 D) in GC patients. Kaplan-Meier analysis also revealed a significant correlation between high hsa_circ_0017728 expression and poor overall survival/disease-free survival in GC patients (Figure 2 E). High hsa_circ_0017728 expression significantly positively correlated with TNM stage and lymph nodes metastasis, but had no significant correlation with gender, age or tumor size (Table I). Furthermore, hsa_circ_0017728 was significantly increased in five GC cell lines (AGS, BGC-823, MKN-28, MGC-803 and SGC-7901) compared with normal human gastric epithelial cell line GES-1 (Figure 2 F).
Figure 2
The clinical significance of hsa_circ_0017728 in GC patients. Hsa_circ_0017728 was up-regulated in 87.3% of GC patients (A). High Hsa_circ_0017728 expression in GC patients was closely associated with poorer pathological differentiation (B), higher TNM stage (C) and lymph node metastasis (D). Kaplan-Meier analysis was performed to evaluate the correlation between hsa_circ_0017728 expression and overall survival/disease-free survival in GC patients (E). Hsa_circ_0017728 expression level was measured in five GC cell lines (AGS, BGC-823, MKN-28, MGC-803 and SGC-7901) and normal human gastric epithelial cell line GES-1 (F)
*P < 0.05, ***p < 0.001 compared with the normal control group.
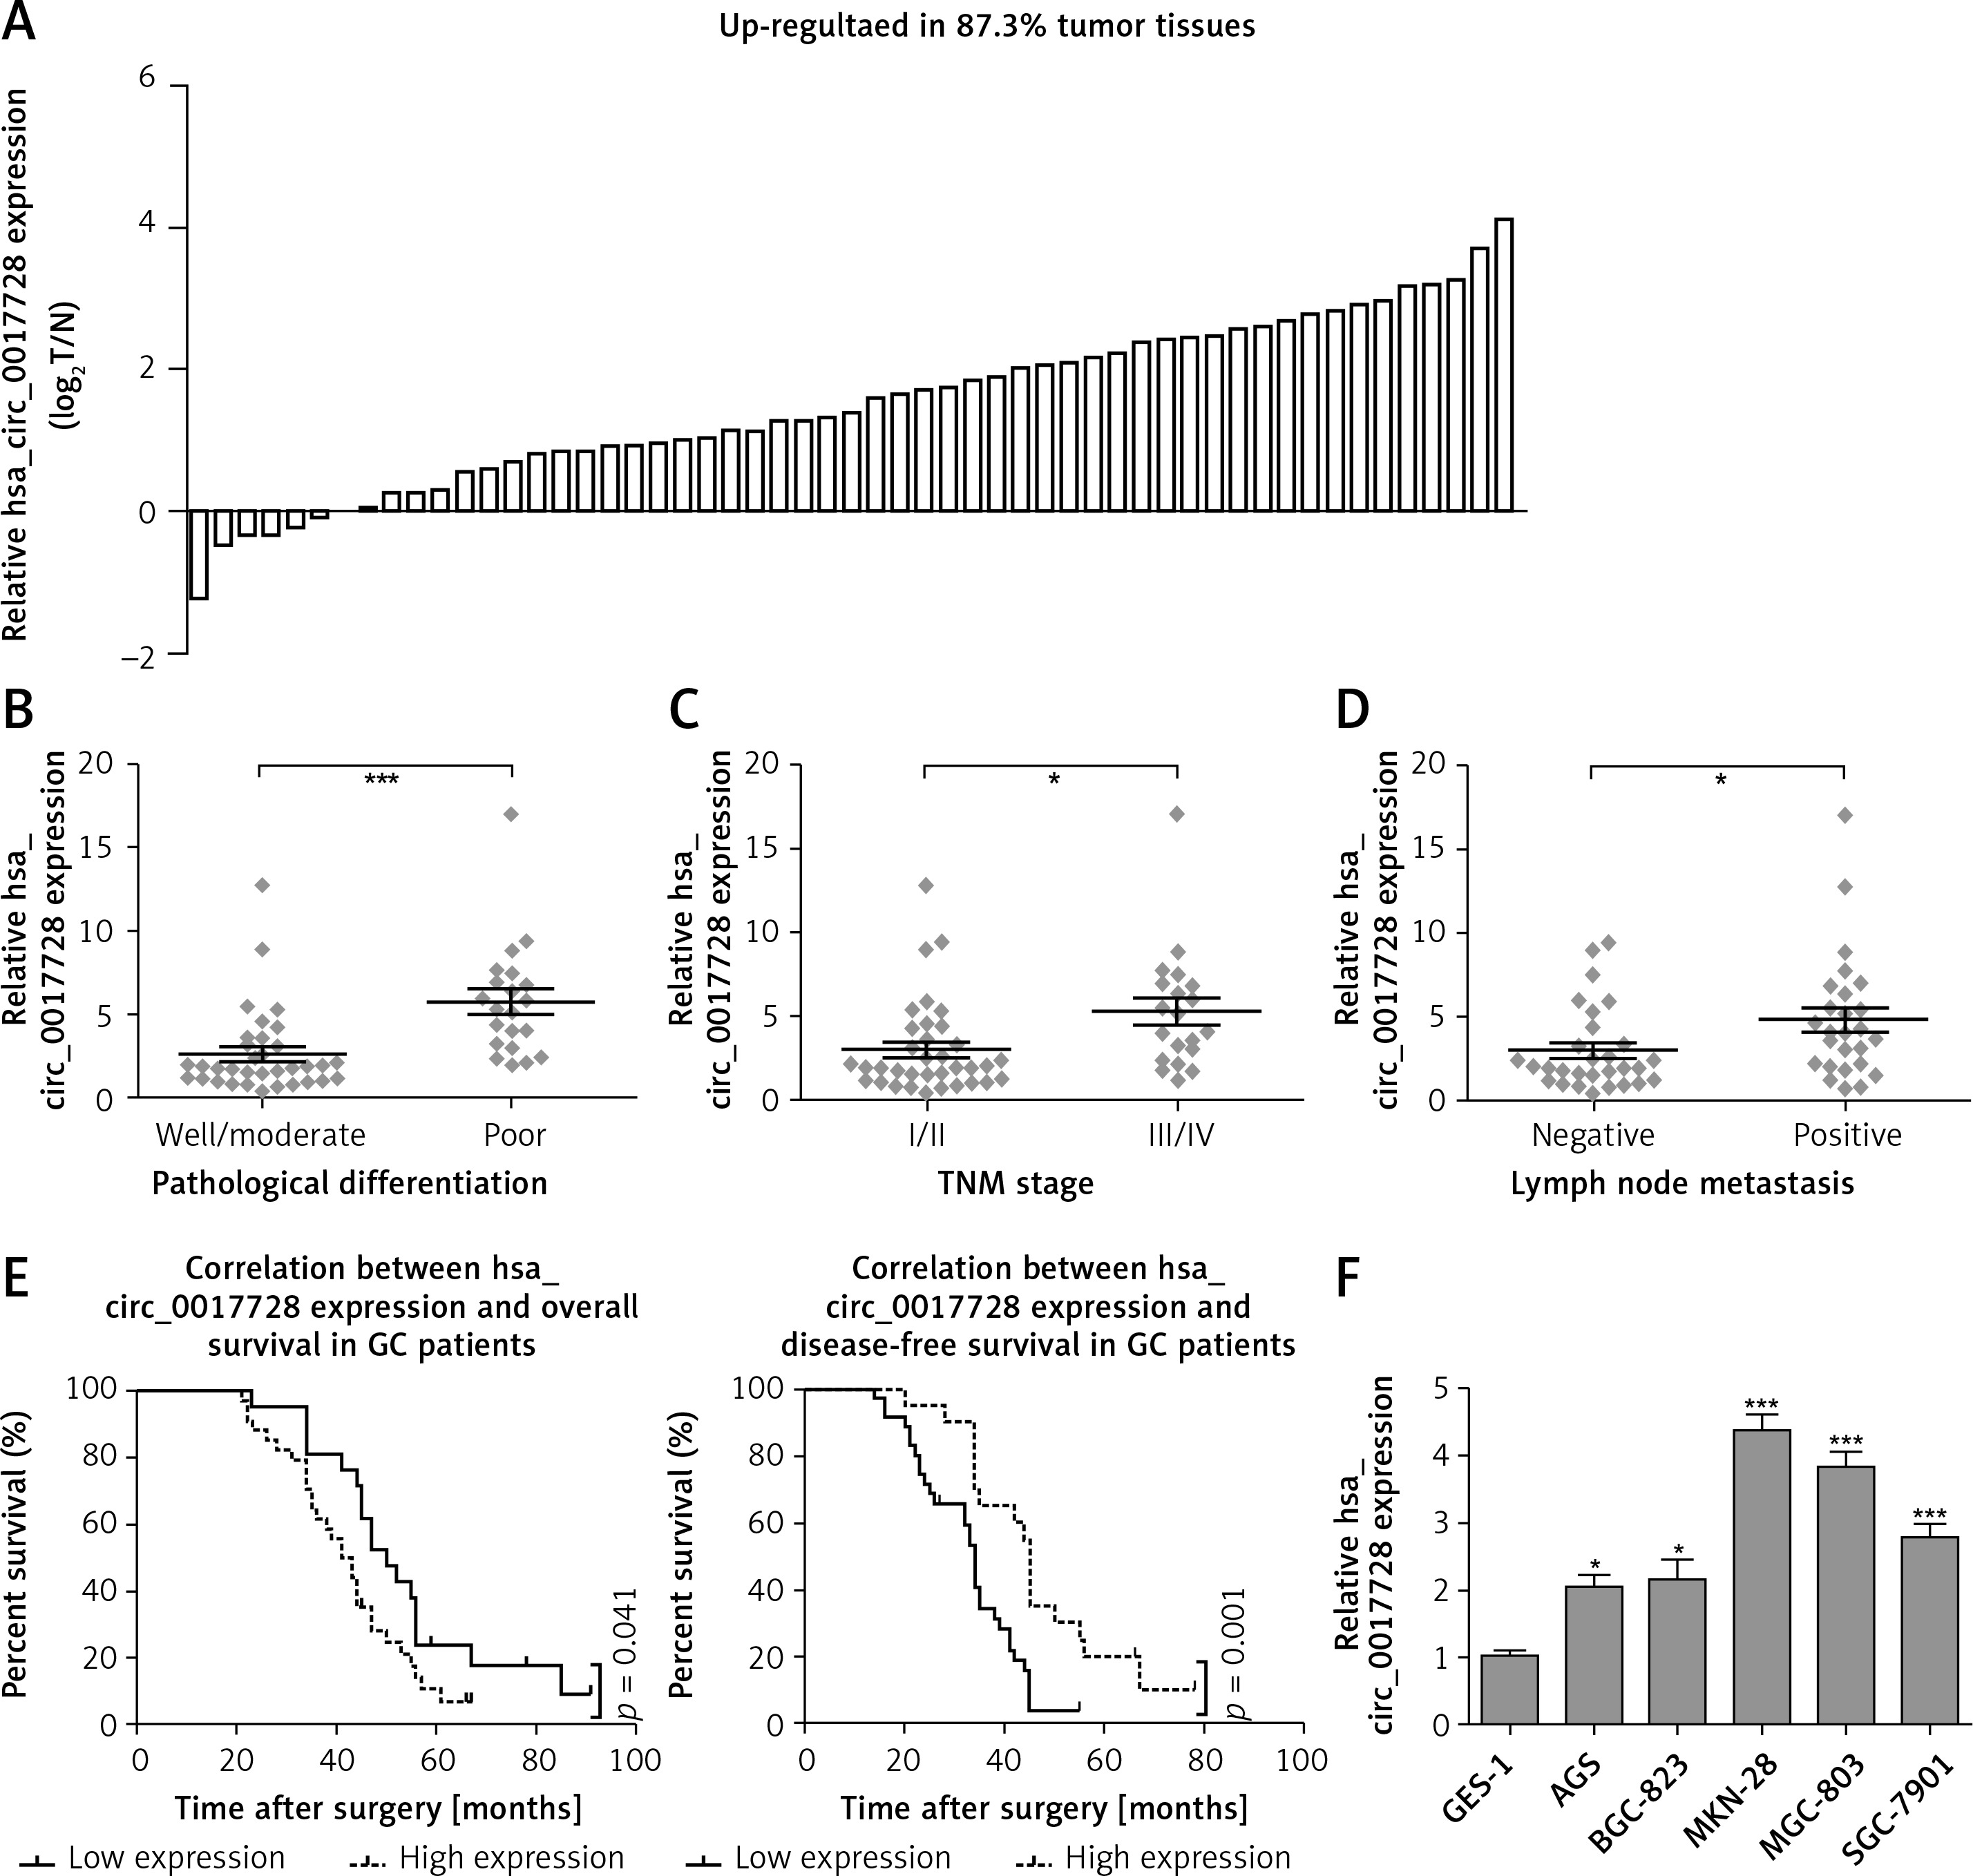
Table I
Correlation between clinicopathological factors and hsa_circ_0017728 expression levels in GC
Hsa_circ_0017728 knockdown suppressed proliferation and migration and induced apoptosis in GC cell lines
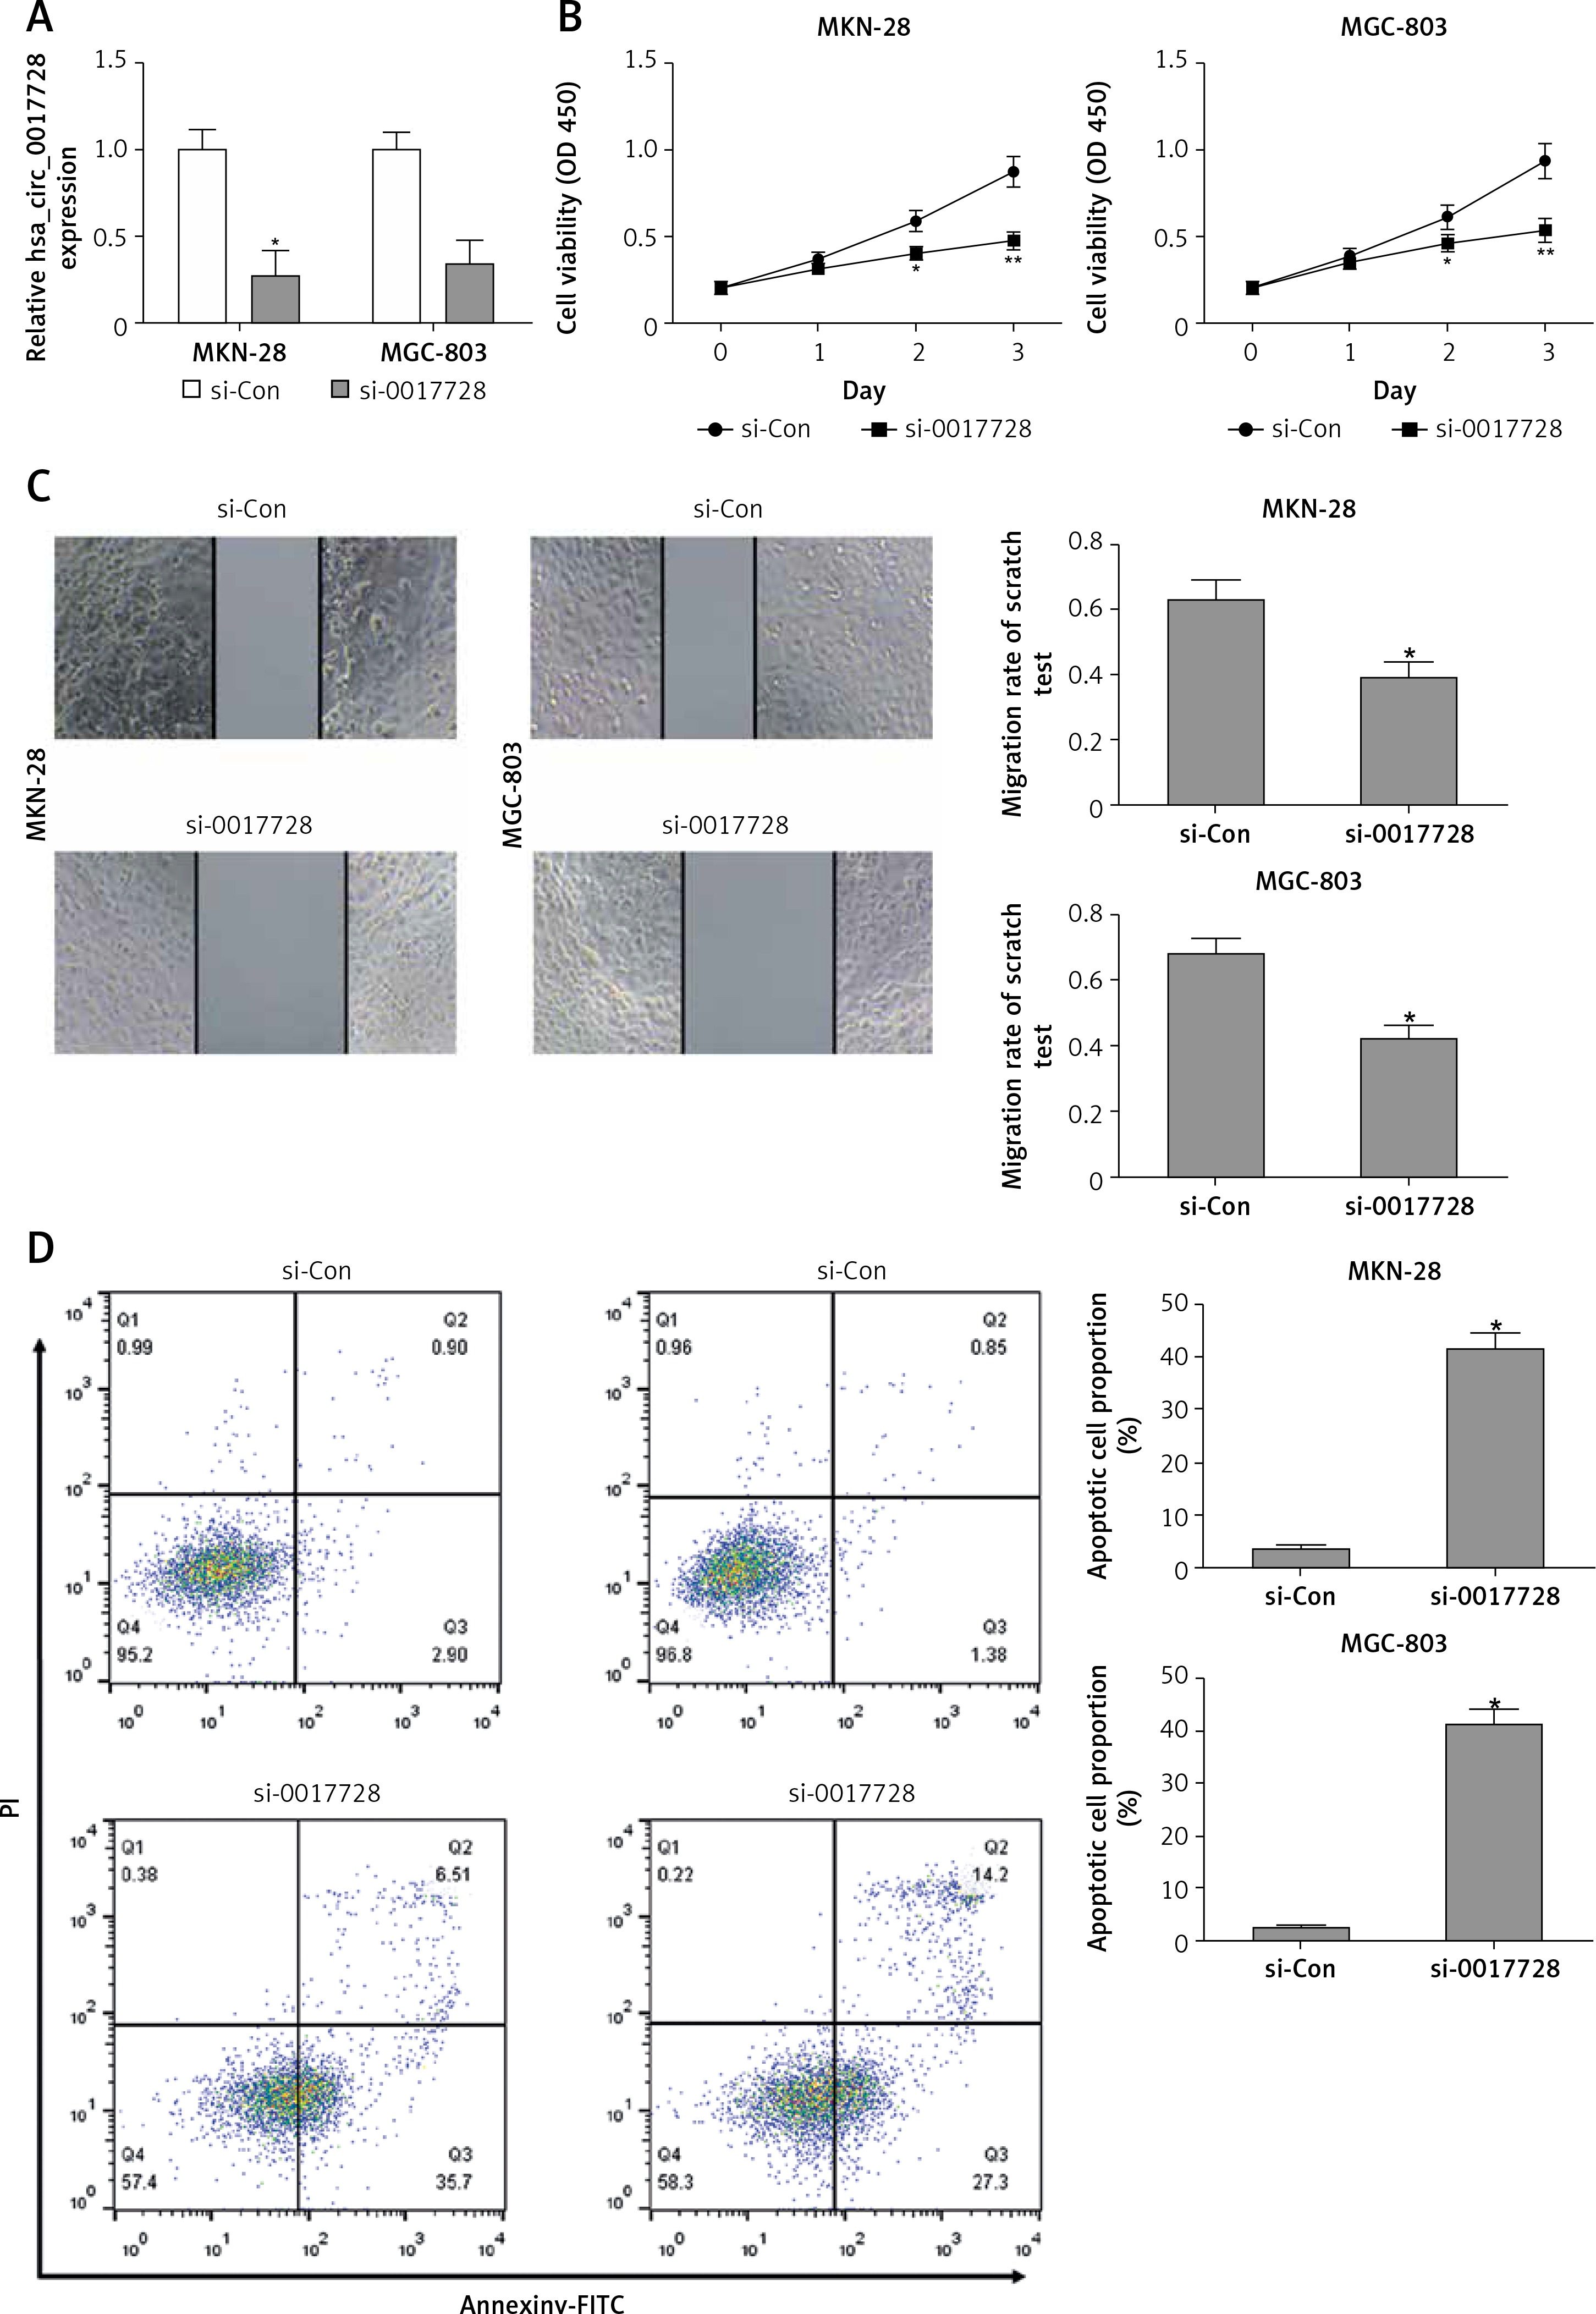
We transfected with specific siRNA targeted hsa_circ_0017728 into MKN-28 and MGC-803 cells, and the results showed significant down-regulation of hsa_circ_0017728 in MKN-28 and MGC-803 cells compared with the control group (Figure 3 A). After transfection with si-0017728 into MKN-28 and MGC-803 cells for 48 h and 72 h, CCK-8 assay indicated a significant reduction of cell viability (Figure 3 B). Scratch test showed that knockdown of hsa_circ_0017728 led to the inhibition of migration in MKN-28 and MGC-803 cells (Figure 3 C). Annexin V-FITC/PI double staining showed an increase of cell apoptosis rate in MKN-28 and MGC-803 cells with hsa_circ_0017728 knockdown (Figure 3 D).
Figure 3
Hsa_circ_0017728 knockdown suppressed proliferation and migration and induced apoptosis in GC cell lines. Transfection with specific siRNA into MKN-28 and MGC-803 cells targeted hsa_circ_0017728; the expression level of hsa_circ_0017728 was measured by RT-qPCR (A); CCK-8 assay, scratch test and Annexin V-FITC/PI staining were performed to detect cell viability (B), migration (C) and apoptosis (D) in MKN-28 and MGC-803 cells, respectively
*P < 0.05, **p < 0.01 compared with control group.
Hsa_circ_0017728 acted as a miRNA sponge for miR-149 in GC cell lines
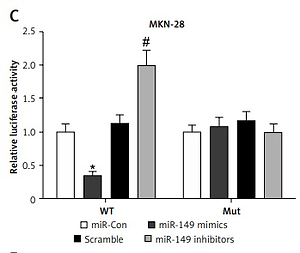
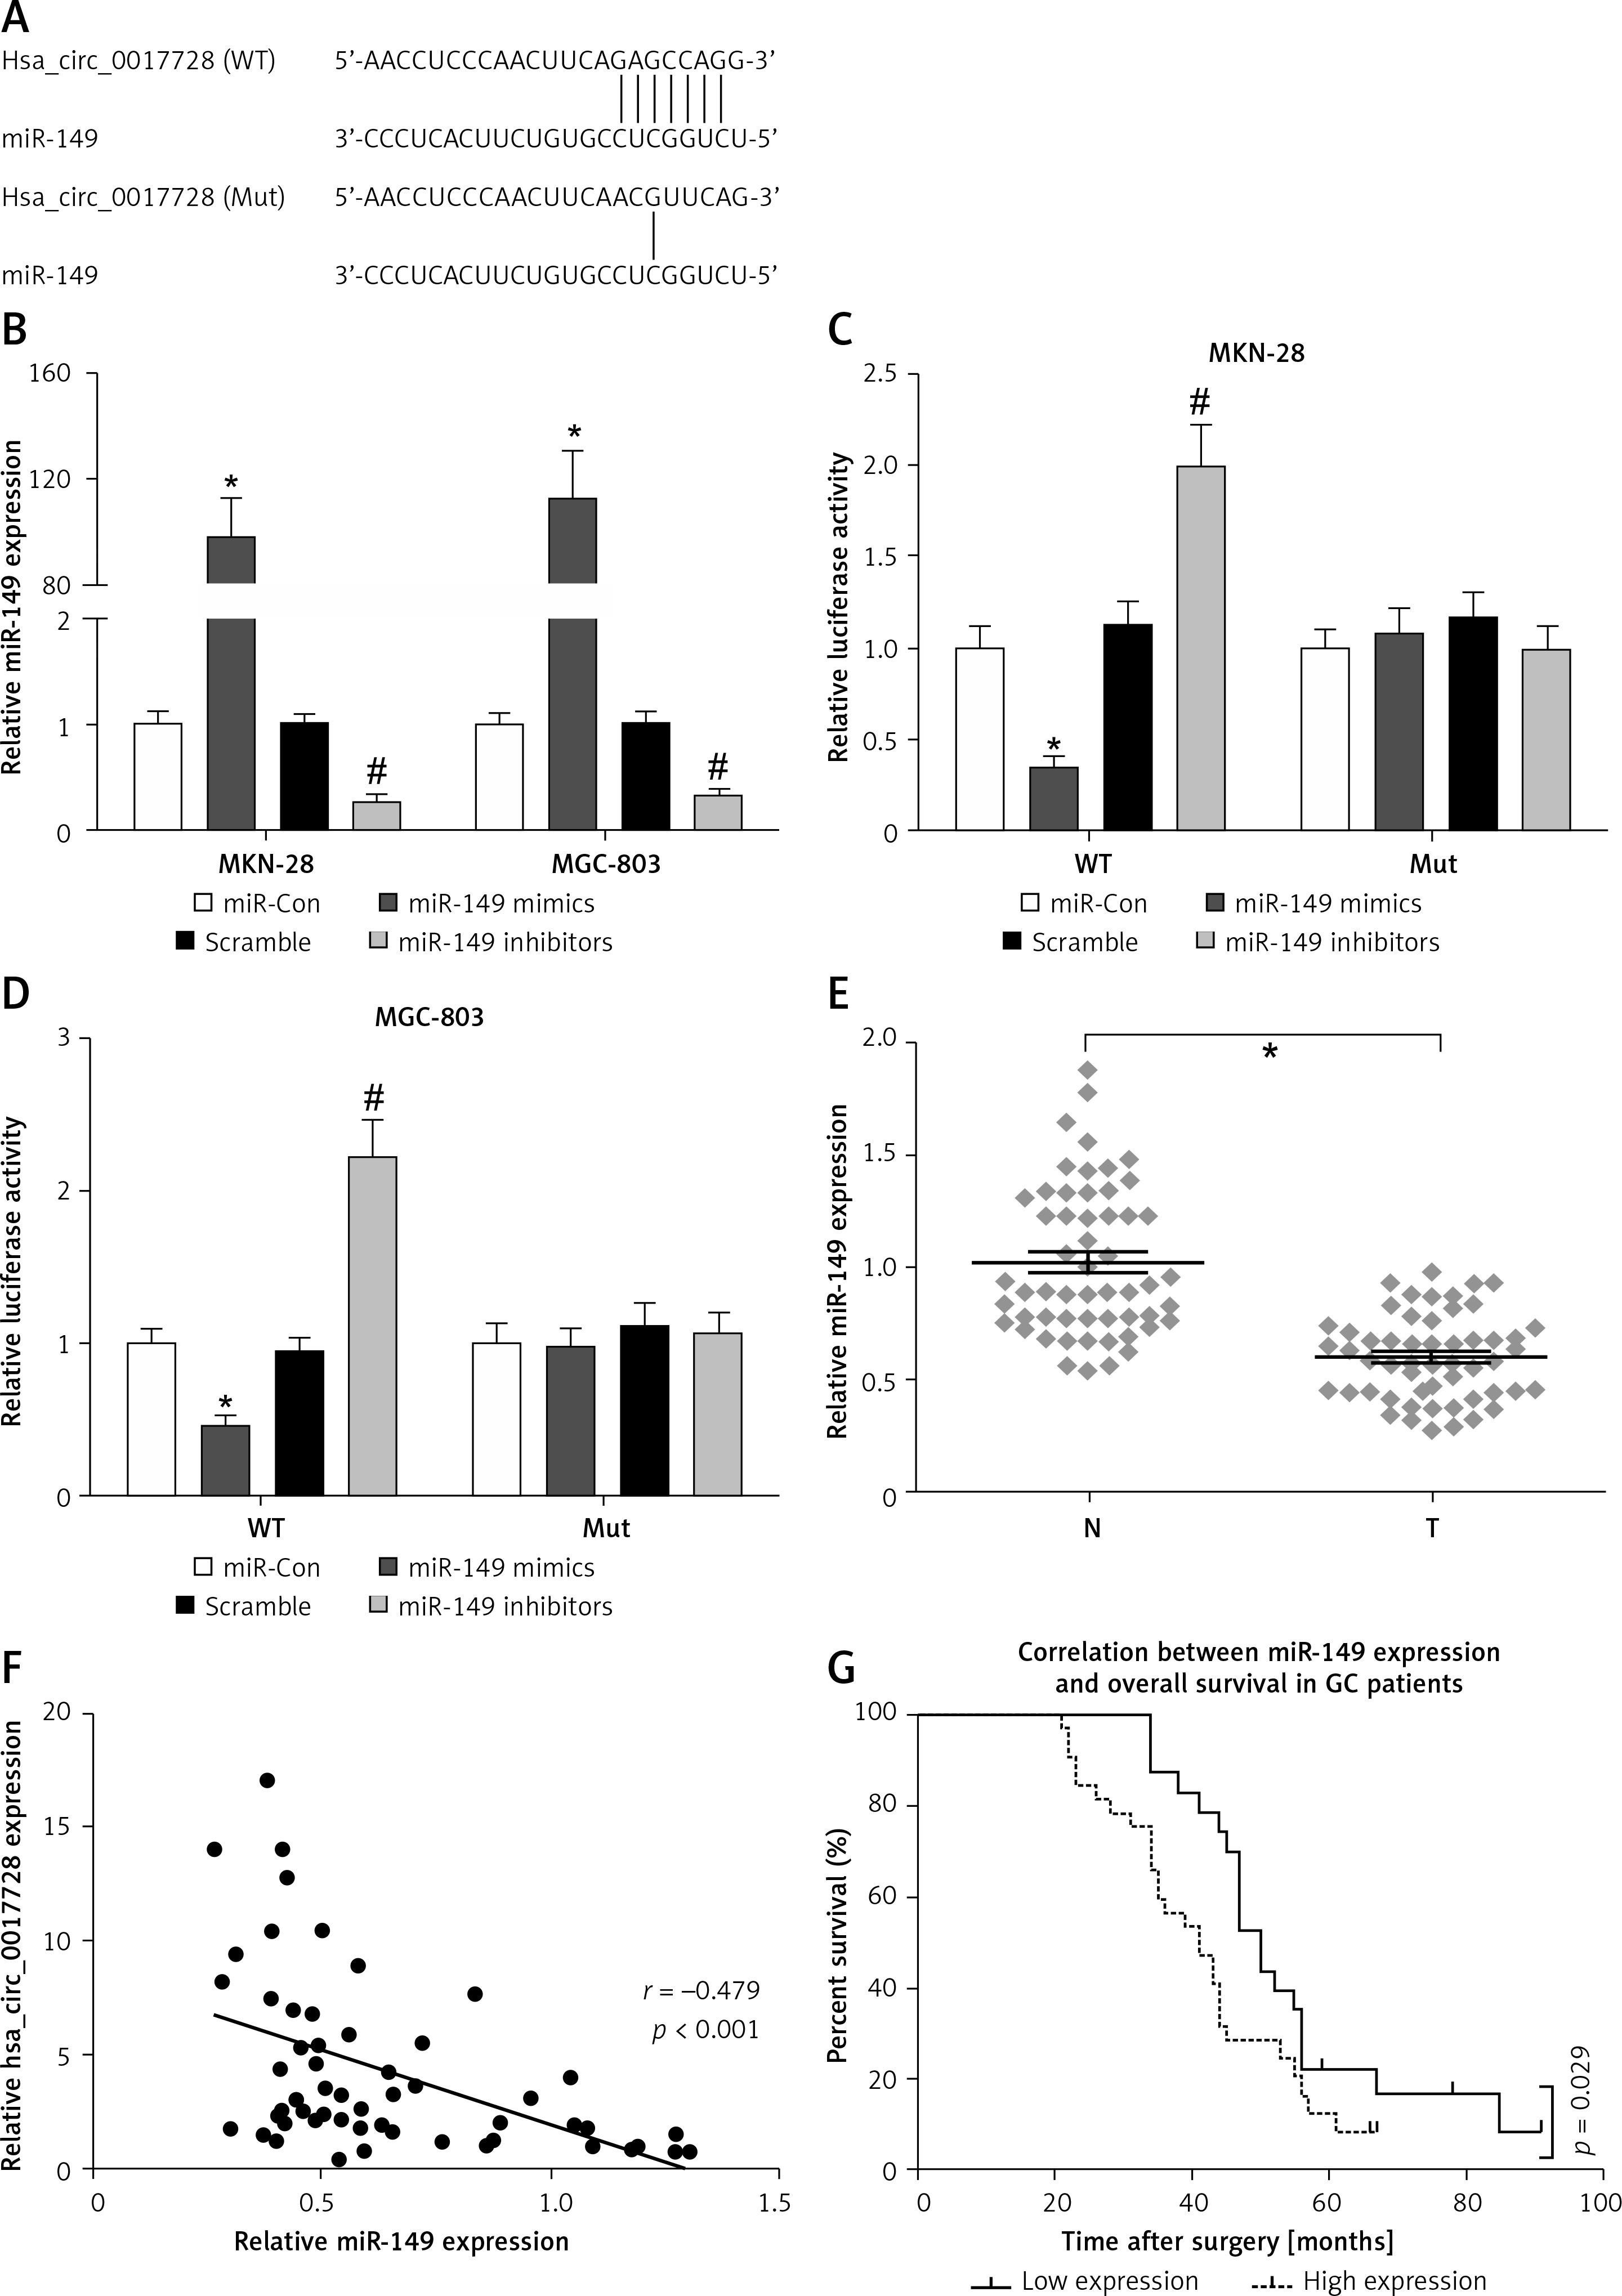
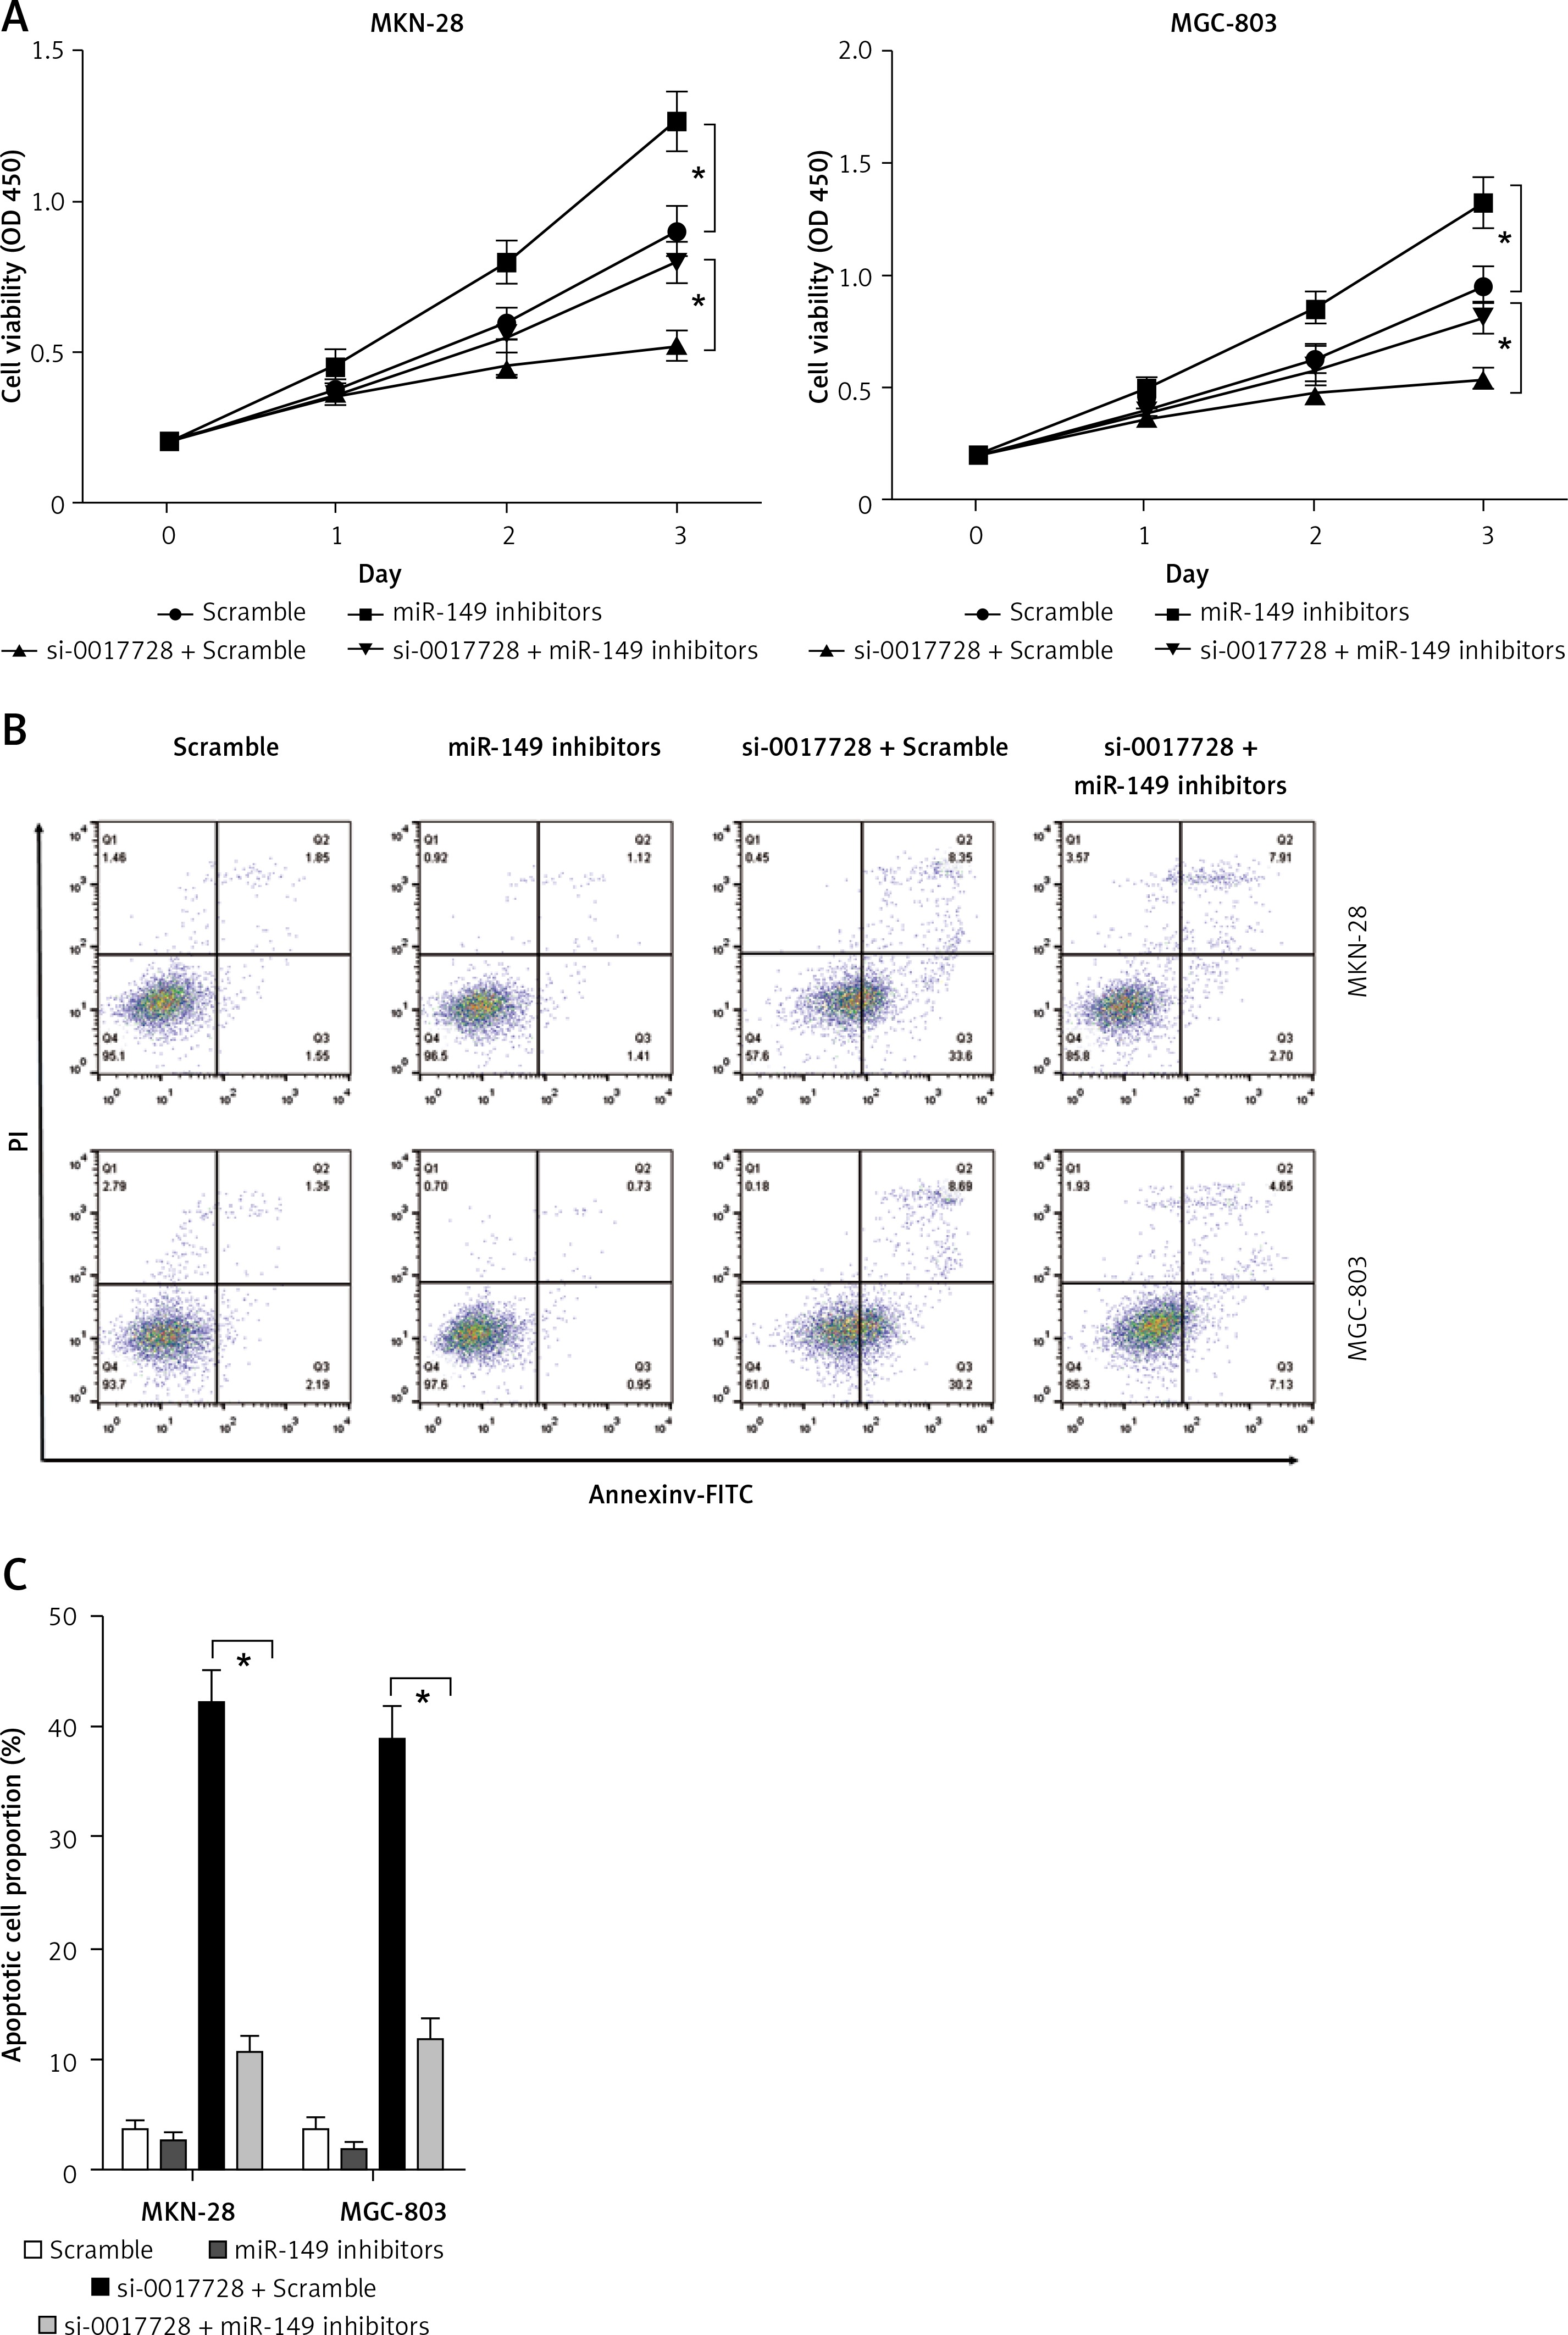
To investigate circRNA-miRNA interaction pathways, Circinteractome bioinformatics databases (https://circinteractome.nia.nih.gov/) were used to predict potential binding sites of miRNAs in hsa_circ_0017728. We found that miR-149 as a candidate miRNA might be a potential target of hsa_circ_0017728, and the putative binding sites of miR-149 on hsa_circ_0017728 was predicted by Circinteractome and highlighted as shown in Figure 4 A. To verify this assumption, luciferase activity reporter assays were performed in MKN-28 and MGC-803 cells after transfection with the WT or Mut sequence of hsa_circ_0017728, and then co-transfection with miR-149 mimics or inhibitors. First, the expression level of miR-149 was dramatically increased or decreased in MKN-28 and MGC-803 cells after transfection with miR-149 mimics or inhibitors, respectively, compared with that of the corresponding control group (Figure 4 B). The luciferase activity was significantly reduced in MKN-28 and MGC-803 cells after co-transfection with miR-149 mimics and hsa_circ_0017728-WT, while the luciferase activity was markedly increased in MKN-28 and MGC-803 cells after co-transfection with miR-149 inhibitors and hsa_circ_0017728-WT, compared with the control group (Figures 4 C, D). However, the luciferase activity had no significant change when the corresponding target sites were mutated in MKN-28 and MGC-803 cells (Figures 4 C, D). In addition, we found that miR-149 was down-regulated in human GC tissues compared with that in the corresponding non-cancerous tissues (Figure 4 E). Spearman’s rank correlation analysis showed that the expression of miR-149 was inversely correlated with hsa_circ_0017728 (Spearman’s r = –0.479; p < 0.001; Figure 4 F) in 55 human GC tissues. Kaplan-Meier analysis found that GC patients with low miR-149 expression showed poorer survival (Figure 4 G). These findings suggested that miR-149 and hsa_circ_0017728 might exert completely different effects in the progression of GC. In vitro experimental measurements indicated that miR-149 loss of function enhanced proliferation of MKN-28 and MGC-803 cells (Figure 5 A) and reversed si-0017728-induced growth inhibition and apoptosis in MKN-28 and MGC-803 cells (Figure 5 B).
Figure 4
Hsa_circ_0017728 acted as a miRNA sponge for miR-149. The putative binding sites between hsa_circ_0017728 and miR-149 were predicted by online software Circinteractome (A). After transfection with miR-149 mimics and inhibitors into MKN-28 and MGC-803 cells, miR-149 expression level was measured by RT-qPCR (B); luciferase reporter assays was performed in MKN-28 (C) and MGC-803 (D) cells co-transfected with WT or Mut hsa_circ_0017728. The expression level of miR-149 was measured using RT-qPCR in 55 pairs of tumor and non-cancerous tissues from GC patients (E). Spearman’s rank correlation analysis showed that the expression of miR-149 was inversely correlated with hsa_circ_0017728 in the 55 human GC tissues (F). Kaplan-Meier analysis was performed to evaluate the correlation between miR-149 expression and overall survival in GC patients (G)
*P < 0.05, #p < 0.05 compared with corresponding control group.
MiR-149 exerted an anti-oncogenic effect in vitro by targeting IL-6/STAT3 signaling
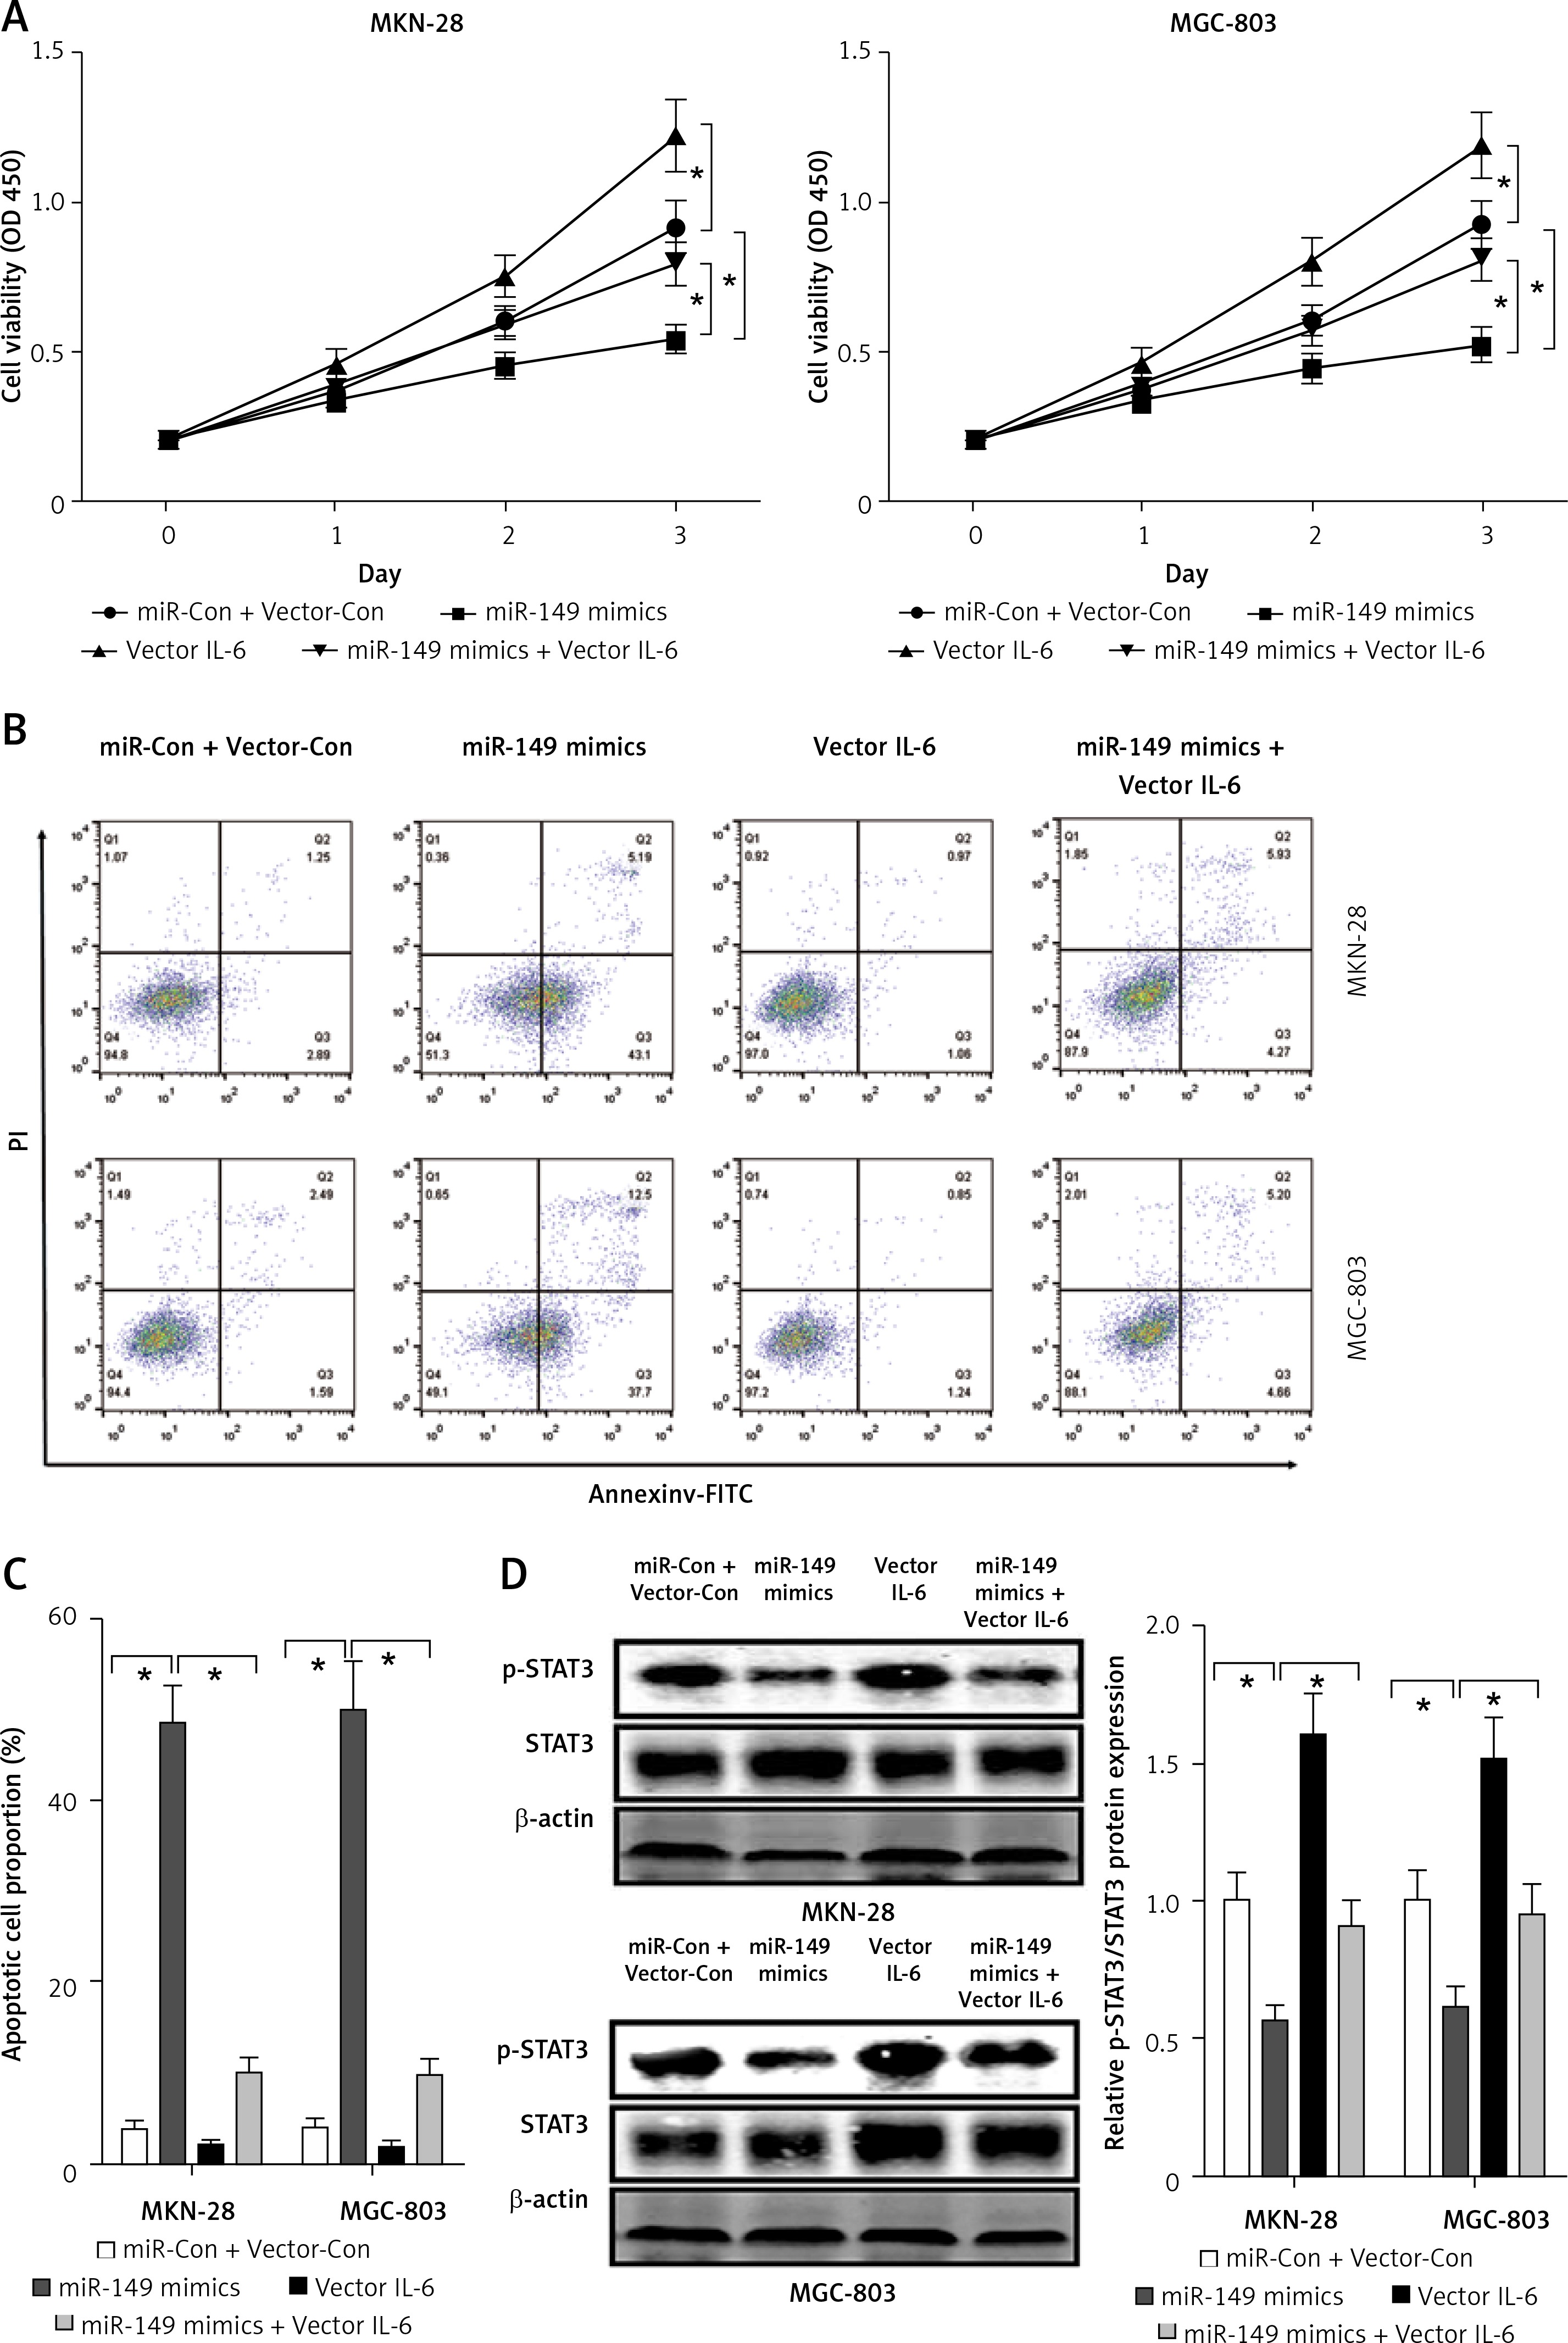
miR-149 as an anti-oncomiR has been reported during GC tumorigenesis [19]. Interestingly, IL-6 is a direct target involved in miR-149-associated oncotherapy [24, 29]. However, the roles of miR-149/IL-6 signaling have not been completely elaborated in gastric carcinogenesis. Using the online bioinformatics algorithm TargetScan (http://www.targetscan.org/), we found that the 3′-untranslated region (3′-UTR) of IL-6 contained one conserved binding site of miR-149, as shown in Figure 6 A. To confirm this finding, luciferase activity reporter assays were performed in MKN-28 and MGC-803 cells after transfection with WT or Mut 3′-UTR of IL-6 combined with miR-149 mimics or inhibitors. The luciferase reporter assay revealed that the luciferase activity of IL-6-WT but not IL-6-MUT was significantly reduced in the miR-149 mimics group, compared with that of the control group. In contrast, the luciferase activity was elevated in the miR-149 inhibitor group with IL-6-WT but not IL-6-MUT (Figures 6 B, C). Furthermore, IL-6 protein expression was significantly reduced in MKN-28 and MGC-803 cells after transfection with miR-149 mimics. In contrast, the opposite results were obtained when cells were transfected with miR-149 inhibitors (Figure 6 D). Functionally, miR-149 overexpression dramatically inhibited cell growth (Figure 7 A) and induced cell apoptosis (Figures 7 B, C) in MKN-28 and MGC-803 cells, as well as reducing the protein levels of p-STAT3 (Figure 7 D). However, overexpression of IL-6 had a tendency to reverse the antineoplastic activity of miR-149 in vitro.
Figure 6
IL-6 was a direct target of miR-149. The putative binding sites between IL-6 and miR-149 were predicted by the bioinformatics algorithm TargetScan (A) and verified by luciferase reporter assays in MKN-28 and MGC-803 cells (B, C). After transfection with miR-149 mimics or inhibitors into MKN-28 and MGC-803 cells, the protein expression of IL-6 was measured by western blotting (D)
*P < 0.05, #p < 0.05 compared with corresponding control group.
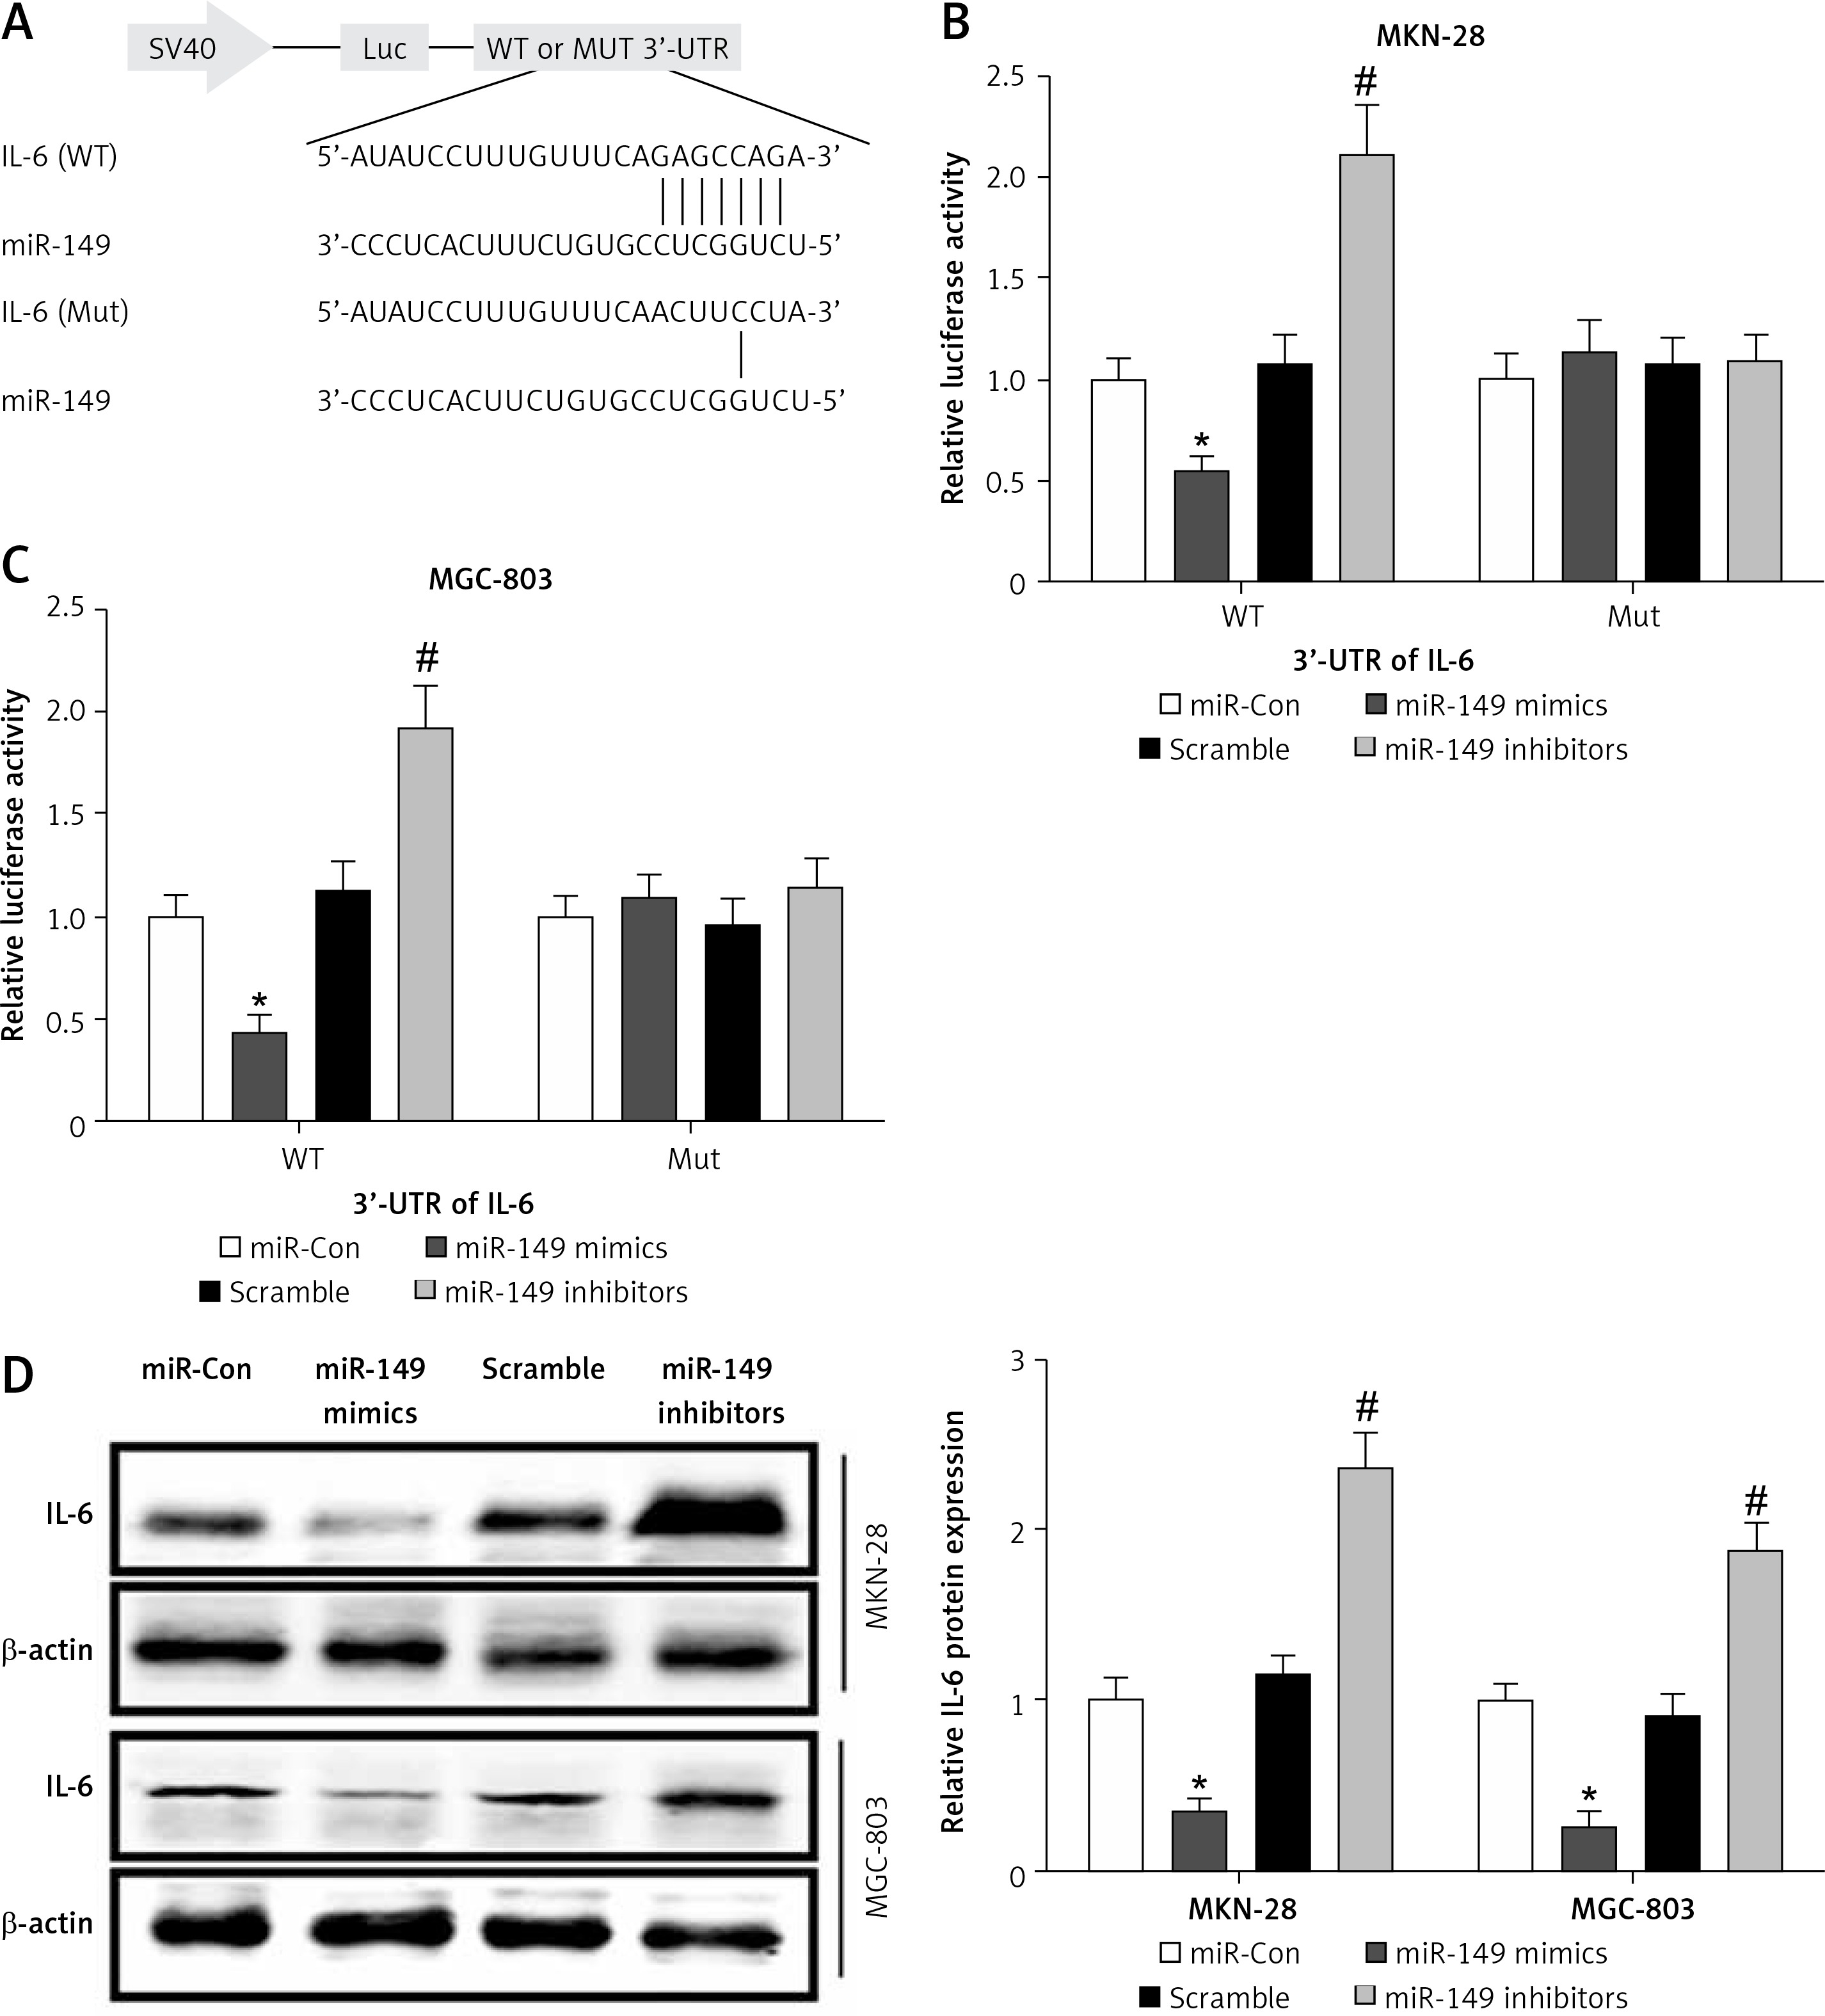
Figure 7
Overexpression of IL-6 reversed the roles of miR-149 mimics in GC cells. After co-transfection with miR-149 mimics and vector IL-6 into MKN-28 and MGC-803, the CCK-8 assay and Annexin V-FITC/PI staining were performed to detect cell viability (A) and apoptosis (B, C); protein expression of STAT3 and p-STAT3 was measured by western blotting (D)
*P < 0.05.
Discussion
In this study, up-regulation of hsa_circ_0017728 and down-regulation of miR-149 were found to be negatively correlated in GC tissues. Knockdown of hsa_circ_0017728 had the ability to induce inhibition of cell proliferation and migration and elevate the cell apoptosis rate in MKN-28 and MGC-803 cells. However, miR-149 loss of function was observed to block the anti-proliferative and pro-apoptotic activity of hsa_circ_0017728 knockdown in vitro. In addition, we found that IL-6 was a direct target of miR-149, and overexpression of miR-149 induced cell growth inhibition and apoptosis in vitro by repressing the IL-6/STAT3 signaling pathway. These findings indicated that hsa_circ_0017728 functioned as a sponge of miR-149 and indirectly regulated IL-6/STAT3 signaling participating in the carcinogenesis of GC.
CircRNAs are widely and aberrantly expressed in tumor tissues and have been reported to regulate tumor invasion and metastasis in a variety of cancers, including oral cancer [10], hepatocellular carcinoma (HCC) [11], bladder cancer [30] and non-small cell lung cancer [31]. In GC, Chen et al. reported that circPVT1 is often upregulated in GC tissues and may promote cell proliferation by acting as a sponge for members of the miR-125 family [32]. Zhang et al. found that circLARP4 inhibits cell proliferation and invasion of gastric cancer by sponging miR-424-5p and regulating LATS1 expression [33]. Synthetic circRNA serves as a miR-21 sponge to inhibit cell proliferation in GC [2]. In our study, hsa_circ_0017728 expression level was elevated in GC tissues and cell lines and closely related to poor overall survival. Experimental measurements, including CCK8 assay, scratch test and Annexin V-FITC/PI double staining, revealed that hsa_circ_0017728 knockdown suppressed cell proliferation and migration and induced apoptosis in vitro, reflecting that hsa_circ_0017728 might function as an oncogenic role in gastric carcinogenesis and might be a potential therapeutic target for the treatment of GC.
Interestingly, we found that hsa_circ_0017728 served as a miRNA sponge interacting with miR-149 and regulated cell proliferation and apoptosis. Inhibition of miR-149 abolished the effect of hsa_circ_0017728 knockdown on anti-proliferation and pro-apoptosis in MKN-28 and MGC-803 cells. We also found that the expression of miR-149 was significantly and negatively correlated with hsa_circ_0017728 in GC tissues, suggesting that miR-149 exerted a negative function with hsa_circ_0017728 in the progression of GC. Previous studies have reported the miR-149 primarily serves as an anti-tumor miRNA, and its expression levels are repressed in multiple types of cancers, including HCC [34], breast cancer [35] and GC [19]. Luo et al. showed that over-expression of miR-149 suppresses HCC cell migration and invasion in vitro [34]. Luo et al. suggested that overexpression of miR-149 impairs the migration and invasion ability of HGC-27 and SGC-7901 cells [19]. Chan et al. stated that overexpression of miR-149 has no effect on cell proliferation in IV2 and Hs578T cells, but suppressed cell migration and invasion in vitro and metastasis in vivo [35]. In our study, we also found that miR-149 played an antineoplastic role in vitro by the inhibition of cell proliferation and the increase of the apoptosis rate in MKN-28 and MGC-803 cells.
Previous studies have frequently reported that over-activation of STAT3, as a transcription factor involved in various biological processes [36], is associated with cell proliferation, migration, advanced TNM stage and poor prognosis in GC and may be a novel therapeutic target for the treatment of GC [37, 38]. IL-6/IL-6 receptor (IL6R) signaling activates the phosphorylation of janus kinase 2, and then enhances the phosphorylation of STAT3 (p-STAT3) [39]. Cancer-associated fibroblasts via the secretion of IL-6 promote epithelial-mesenchymal transition and metastasis of gastric cancer via over-activation of the STAT3 signaling pathway [40]. Moreover, the activation of IL-6/STAT3 signaling is associated with chemotherapy resistance in GC cells [41]. Intriguingly, epigenetic silencing of miR-149 in cancer-associated fibroblasts increases IL-6 secretion in the tumor microenvironment of GC, which results in the acceleration of GC cell proliferation, colony forming ability, migration and invasion [24]. Investigation into the molecular mechanisms of the antineoplastic activity of miR-149 revealed that IL-6 was a direct target of miR-149, and overexpression of miR-149 could inhibit the protein expression of IL-6 and p-STAT3 in MKN-28 and MGC-803 cells. These findings suggested that GC cell proliferation and apoptosis might be affected by miR-149-mediated inhibition of the IL-6/STAT3 signaling pathway.
In conclusion, our results demonstrated that the hsa_circ_0017728 expression level was increased in GC tissues and cell lines. We also found that hsa_circ_0017728 might serve as a ceRNA to sponge miR-149 and indirectly regulate the IL-6/STAT3 signaling pathway in GC cell proliferation and apoptosis. The regulatory network of hsa_circ_0017728/miR-149/IL-6/STAT3 cascade signaling might provide a better understanding of gastric carcinogenesis and progression.