Introduction
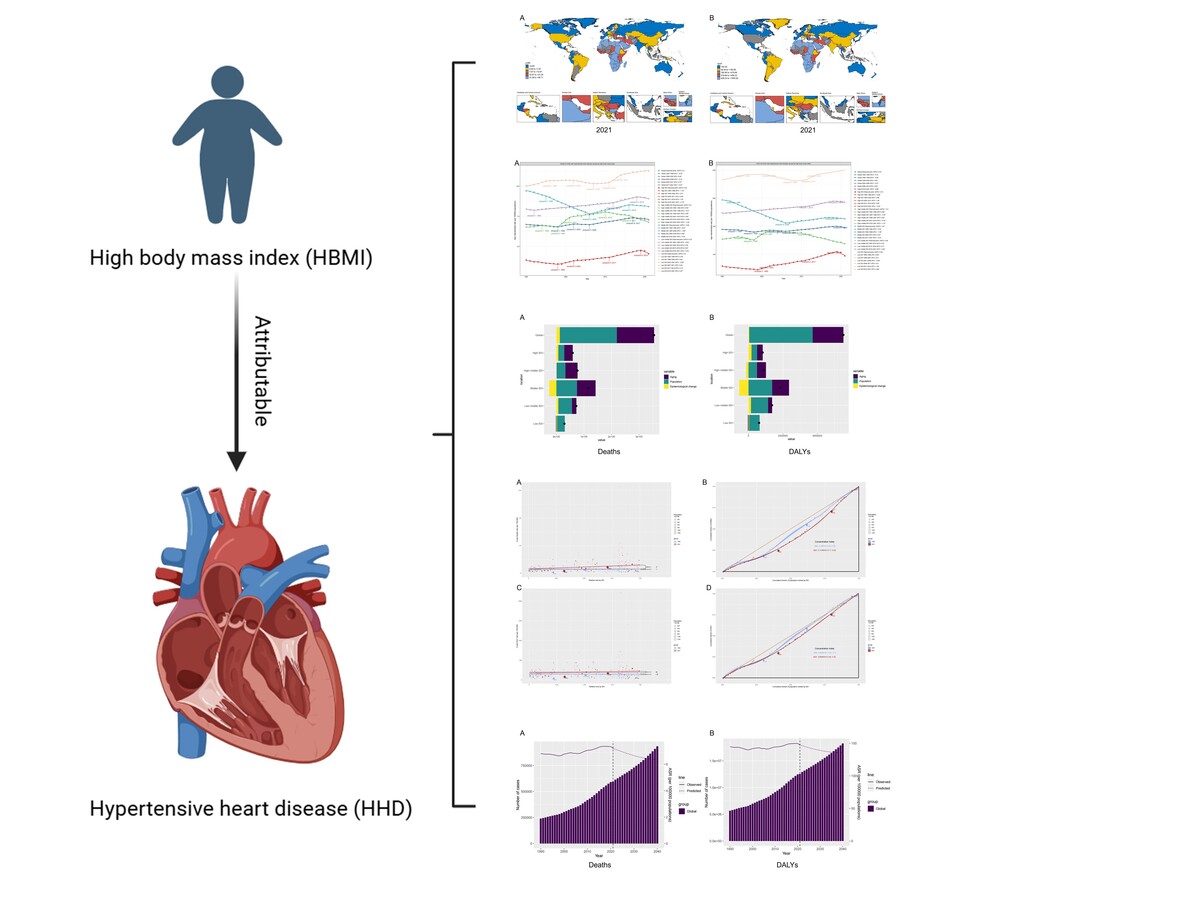
Hypertensive heart disease (HHD) is a cardiovascular condition caused by hypertension, characterized by abnormalities in left ventricular (LV) morphology and function, marked by left ventricular hypertrophy (LVH) [1]. With the continuous increase in the number of people with hypertension and the lack of blood pressure control, the incidence of HHD continues to rise [2, 3]. Notably, left ventricular hypertrophy due to HHD is a major cause of cardiovascular mortality [4]. At the same time, HHD increases the risk of stroke and coronary artery disease, leading to increased all-cause mortality [5, 6]. High body mass index (HBMI) is defined as BMI ≥ 25 kg/m2 [7]. Epidemiological studies indicate that approximately 39–49% of the global population suffer from HBMI [8]. More importantly, HBMI is identified as the leading cause of global disability-adjusted life-years (DALYs) in patients with HHD [9]. A 2019 Global Burden of Disease study estimated the global prevalence of HHD at 18,598,000 cases, reaching 21,508,000 disability-adjusted life years, and that the burden of HHD attributable to HBMI has increased significantly since 1990 [10]. Another study showed that the burden of HHD disease due to HBMI is particularly pronounced in the middle-aged and older Chinese population [11]. Given the significant association between HBMI and HHD, a rising trend in HBMI predicts an increased burden of HHD [11–13].
Although several studies have demonstrated an association between HBMI and the burden of HHD, research on temporal and future trends in HHD mortality due to HBMI is limited [14]. Moreover, previous studies have used relatively old databases [15]. Given the current obesity pandemic, there is a need for a comprehensive description and analysis of the overall disease status and changing trends in HHD attributable to HBMI [16]. To explore the global burden of HHD due to HBMI, we comprehensively analyzed temporal trends in global HHD mortality from 1990 to 2021 based on the Global Burden of Diseases (GBD) 2021 database. We further projected the future burden of disease. These findings not only complement previous studies, but also provide guidance for the design and promotion of targeted prevention strategies for HHD attributable to HBMI.
Material and methods
Data source
DALYs and deaths from HHD attributable to HBMI were sourced from the Global Health Data Exchange (GHDx) query tool (http://ghdx.healthdata.org/gbd-results-tool). We further analyzed annual age-specific data on HHD attributable to HBMI from 1990 to 2021, including crude mortality rates (CMR), crude DALY rates (CDR), and their corresponding age-standardized rates (ASR), such as age-standardized mortality rates (ASMR) and age-standardized DALY rates (ASDR). Since we used the publicly available GBD 2021 database, this study did not require ethical approval or informed consent.
Definitions
HBMI is defined as a BMI ≥ 25 kg/m2 [17]. DALYs are a composite measure quantifying the burden of HBMI-induced HHD, representing the sum of years of life lost (YLL) due to premature death and years lived with disability (YLD) due to HBMI-associated HHD. The sociodemographic index (SDI) is a composite indicator used to measure development in a geographic location. The SDI ranges from 0 to 1, with higher values indicating higher levels of development. The threshold SDI quintile is determined for countries with populations over 1 million. Specifically, 204 countries and regions are categorized into five SDI-based regions: high SDI (0.805 to 1), high-middle SDI (0.690 to < 0.805), middle SDI (0.608 to < 0.690), low-middle SDI (0.455 to < 0.608), and low SDI (0 to < 0.455) [18, 19].
Estimated annual percentage change
To quantify trends in the burden of HHD attributable to HBMI from 1990 to 2021, we calculated the estimated annual percent change (EAPC), reflecting the yearly change over the period. A generalized linear regression model, lnR = α + βT + ε, was used, where R represents the number or rate, and T represents the calendar year. EAPC is calculated as 100 × (exp[β] – 1) with a 95% confidence interval (CI). If both the EAPC value and its 95% CI lower bound are > 0, ASMR and ASDR show an upward trend. If both the EAPC value and the upper limit of its 95% CI are < 0, it indicates a downward trend in ASMR and ASDR.
Joinpoint regression analysis
A connected-point regression model, specifically a linear statistical model, was used to assess temporal trends in the burden of disease from HHD attributable to HBMI. The model estimated changes in mortality and DALY rates using least squares, minimizing subjectivity in trend analysis. The sum of squares of residuals between estimated and actual values was calculated to determine the inflection point of the trend. Joinpoint software was employed to construct this model. We also calculated the average annual percentage change (AAPC) and evaluated the statistical significance of different trend segments by comparing the AAPC to zero. Statistical significance was set at p < 0.05.
Decomposition analysis
To investigate changes in HHD attributable to HBMI deaths and DALYs due to aging, population growth, and epidemiological changes from 1990 to 2021, we performed decomposition analyses of deaths and DALYs. The number of deaths and DALYs at each location could be calculated as follows: Deathsay, py, ey/DALYsay, py, ey = [20].
Deathsay, py, ey/DALYsay, py, ey: the number of deaths/DALYs according to the factors of age structure, population size, and mortality/DALYs rate in year y. ai, y: The proportion of population for the age category i of the n age categories in year y. Py: The total population in year y. ei,y: Mortality/DALY rate for the age category i in year y.
Cross-country inequality analysis
We used the slope index of inequality and the concentration index to assess inequality in the distribution of the burden of HHD attributable to HBMI across countries. The slope index of inequality was determined by regressing national mortality and DALY rates on sociodemographic development-related relative position scales for all age groups. The concentration index was computed by numerically integrating the area under the Lorenz concentration curve, which was constructed using the cumulative fraction of deaths or DALYs and the cumulative relative distribution of populations ranked by the SDI.
Bayesian age-period-cohort (BAPC) model analysis
The Bayesian age-period-cohort (BAPC) model is a sophisticated statistical tool that combines prior information about unknown parameters with sample data to estimate posterior distributions and infer these parameters. It has demonstrated higher accuracy in predicting disease burden [21, 22]. Therefore, we used the BAPC and Integrated Nested Laplace Approximation (INLA) R packages to project the global burden of mortality and DALYs for HHD attributable to HBMI from 2022 to 2040. All analyses were conducted using R software (version 4.3.2).
Results
Temporal trends of ASMR and ASDR for HHD attributable to HBMI at the global level from 1990 to 2021
Table I shows that from 1990 to 2021, the global ASMR of HHD attributable to HBMI increased from 6.83 (4.37–9.32) to 7.21 (4.23–9.94), with an EAPC of 0.33 (95% CI: 0.27–0.39). Similarly, the global ASDR rose from 144.72 (106.21–182.76) to 147.33 (109.06–183.45), with an EAPC of 0.15 (95% CI: 0.1–0.21). Across the five SDI regions, ASMR and ASDR were ranked from high to low in 1990 as low SDI, middle SDI, low-middle SDI, high-middle SDI, and high SDI. In 2021, the trend remained the same: low SDI, low-middle SDI, middle SDI, High-middle SDI, and high SDI. Notably, a decreasing trend in ASMR was observed from 1990 to 2021 for middle SDI (EAPC = –0.44, 95% CI: –0.63 to –0.26) and high-middle SDI (EAPC = –0.11, 95% CI: –0.29–0.06). A similar decrease in ASDR was noted for middle SDI (EAPC = –0.60, 95% CI: –0.77–-0.42) and low SDI (EAPC = –0.03, 95% CI: –0.11–0.05).
Table I
Changing trends of age-standardized mortality rate (ASMR) and age-standardized DALY rate (ASDR) of HHD attributable to HBMI from 1990 to 2021
Global disease burden assessment of HHD attributable to HBMI for different countries in 2021
The world map in Figure 1 illustrates the highly heterogeneous ASMR and ASDR of HHD attributable to HBMI across different countries and regions in 2021. Figure 1 A shows that particularly high ASMR (12.67 to < 59.71) was observed in most African countries and the Middle East. Major populous regions, including China, the United States, and South America, exhibited moderate ASMR levels (4.64 to < 12.67). Low ASMR (< 4.64) was found in Canada, Russia, Australia, and most European nations, suggesting broader public health education in developed countries about BMI-related risks and heightened awareness of cardiovascular harms linked to high BMI. This aligns with previous findings that ASMR correlates closely with SDI, independent of population size. In Figure 2 B, the global distribution of ASDR mirrored ASMR trends, with Africa and the Middle East still showing concerning ASDR levels (279.88 to < 1083.92), while Canada, Russia, Australia, and most European countries maintained low ASDR (< 92.96). Notably, the United States exhibited worse ASDR trends compared to ASMR, likely due to its aging population, where age significantly amplifies mortality risks. Additionally, from 1990 to 2021, most countries experienced varying increases in disease burden, with the most pronounced increases primarily in developed countries (Supplementary Tables SI and SII). Notably, the increases in both ASMR and ASDR were highest in Bulgaria and Estonia.
Figure 1
Global disease burden assessment of HHD attributable to HBMI for different countries in 2021. A – ASMR of HHD attributable to HBMI in 2021. B – ASDR of HHD attributable to HBMI in 2021
HHD – hypertensive heart disease, HBMI – high body mass index, ASMR – age-standardized mortality rates, ASDR – agestandardized DALY rates.
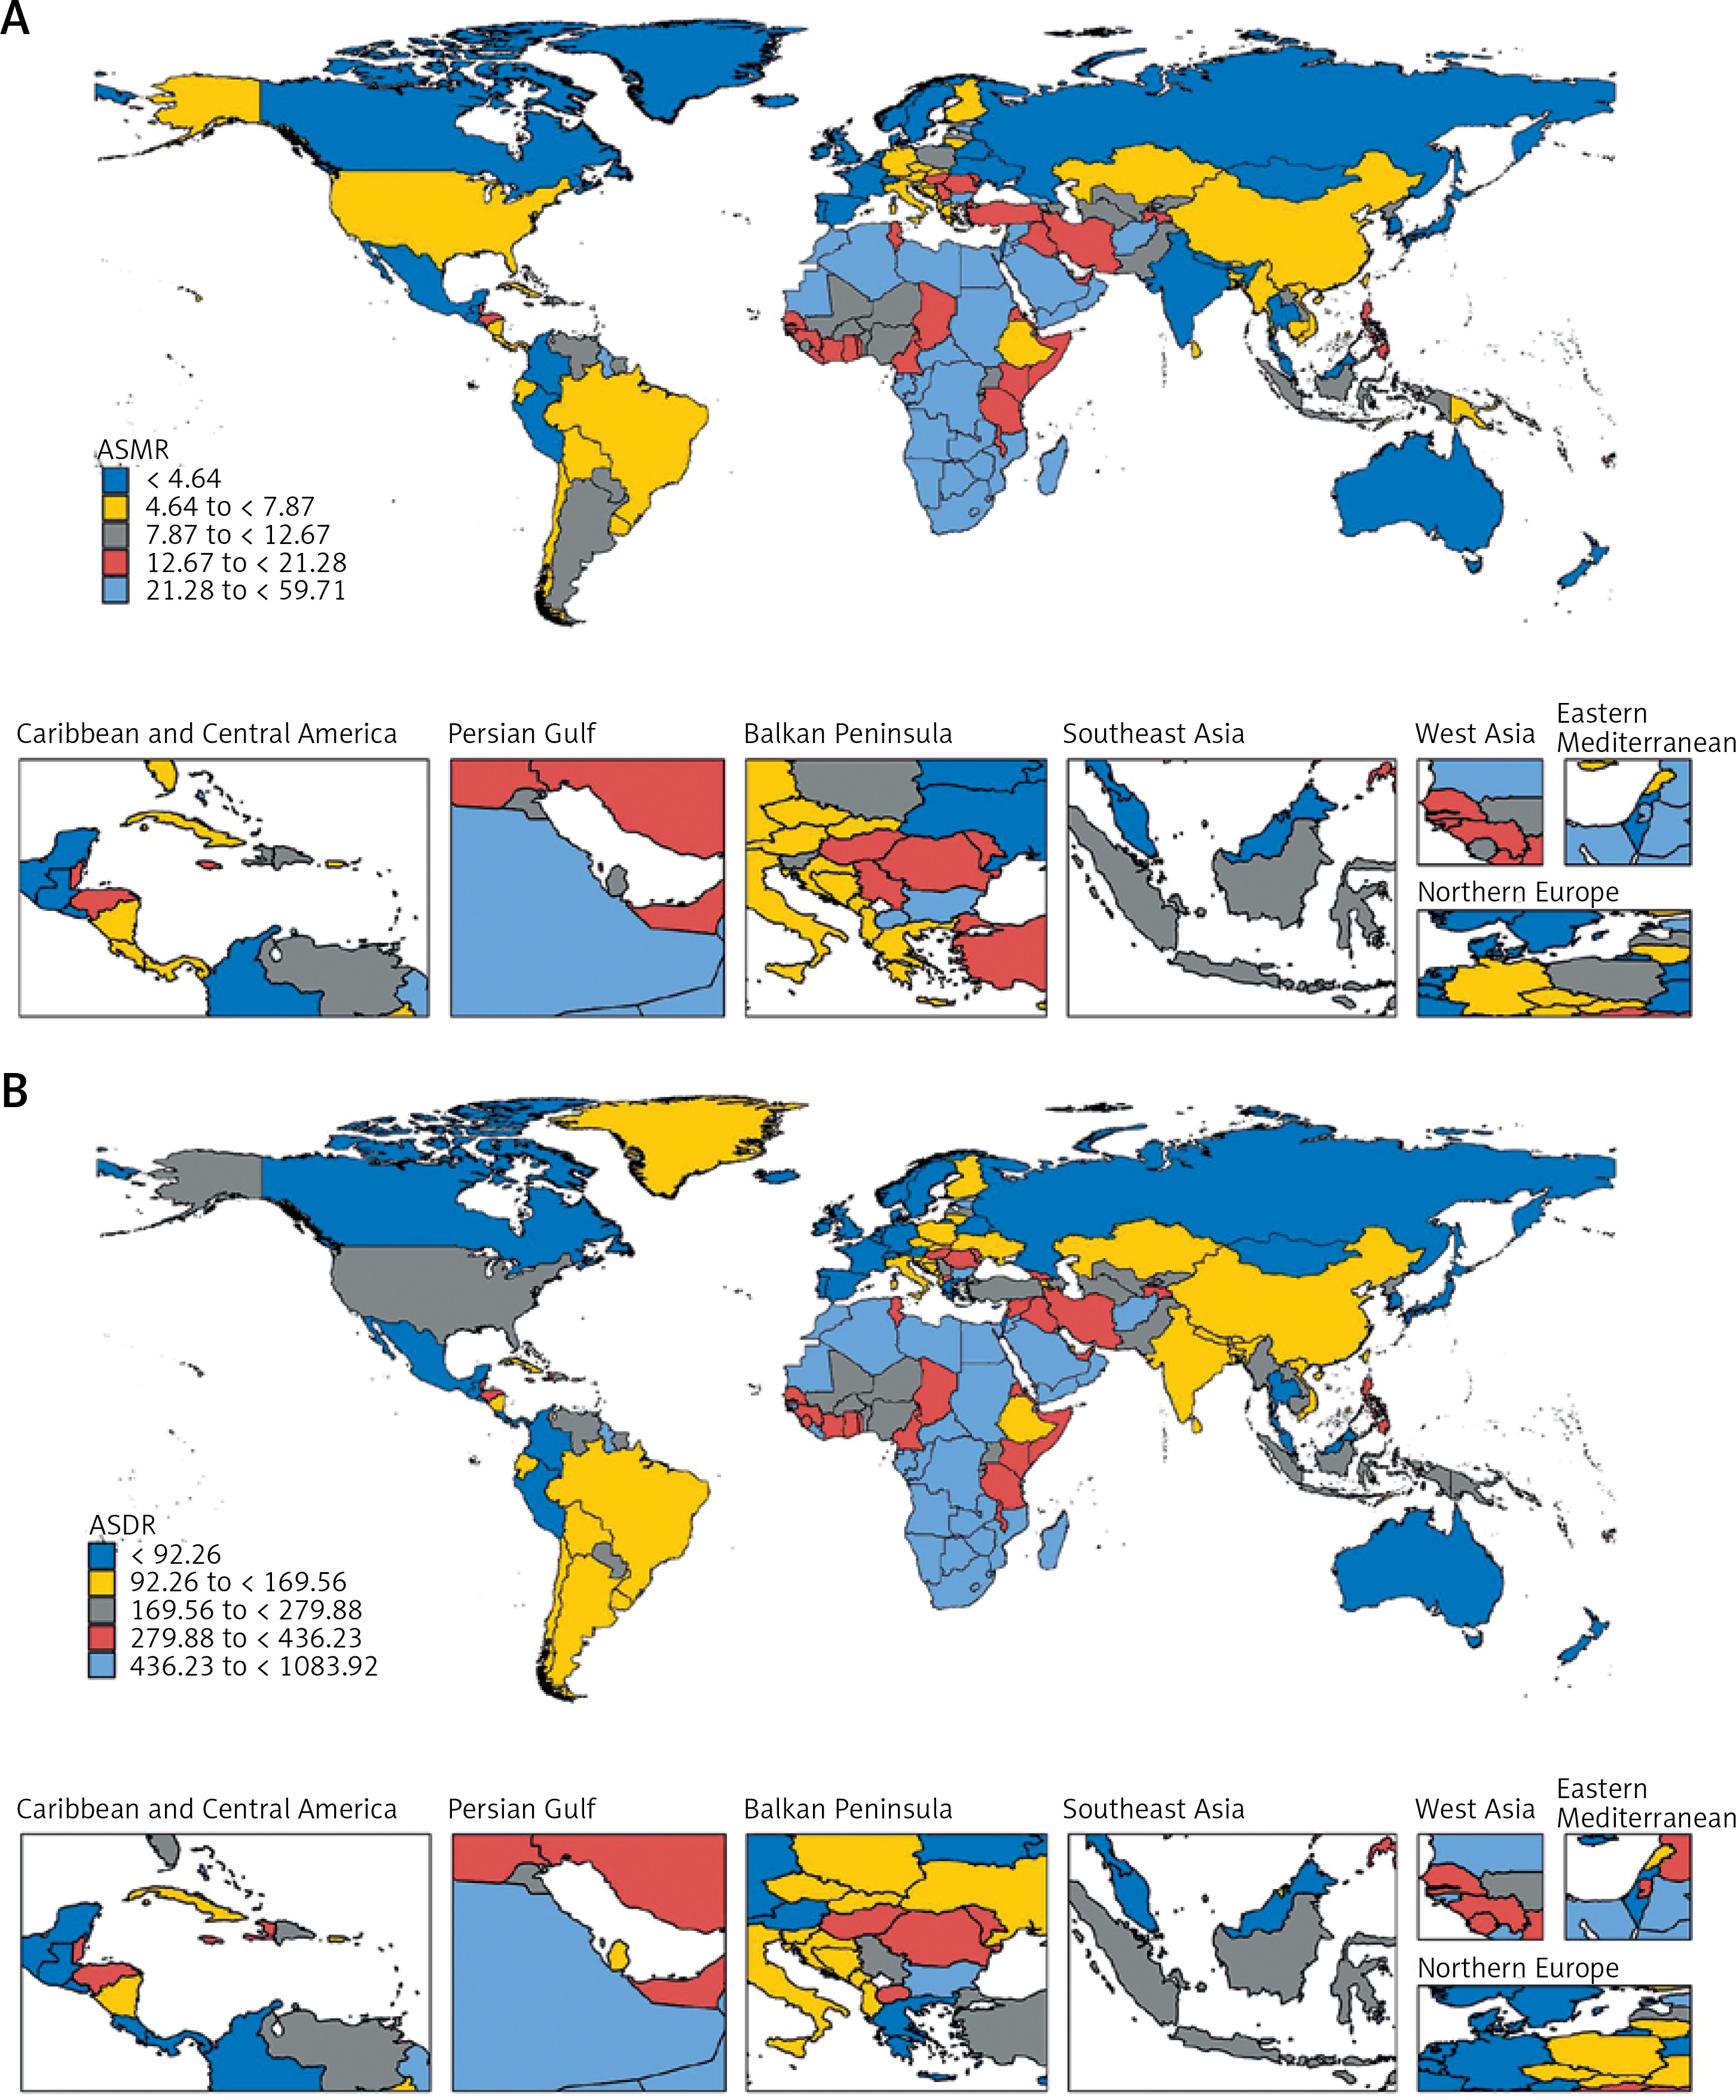
Figure 2
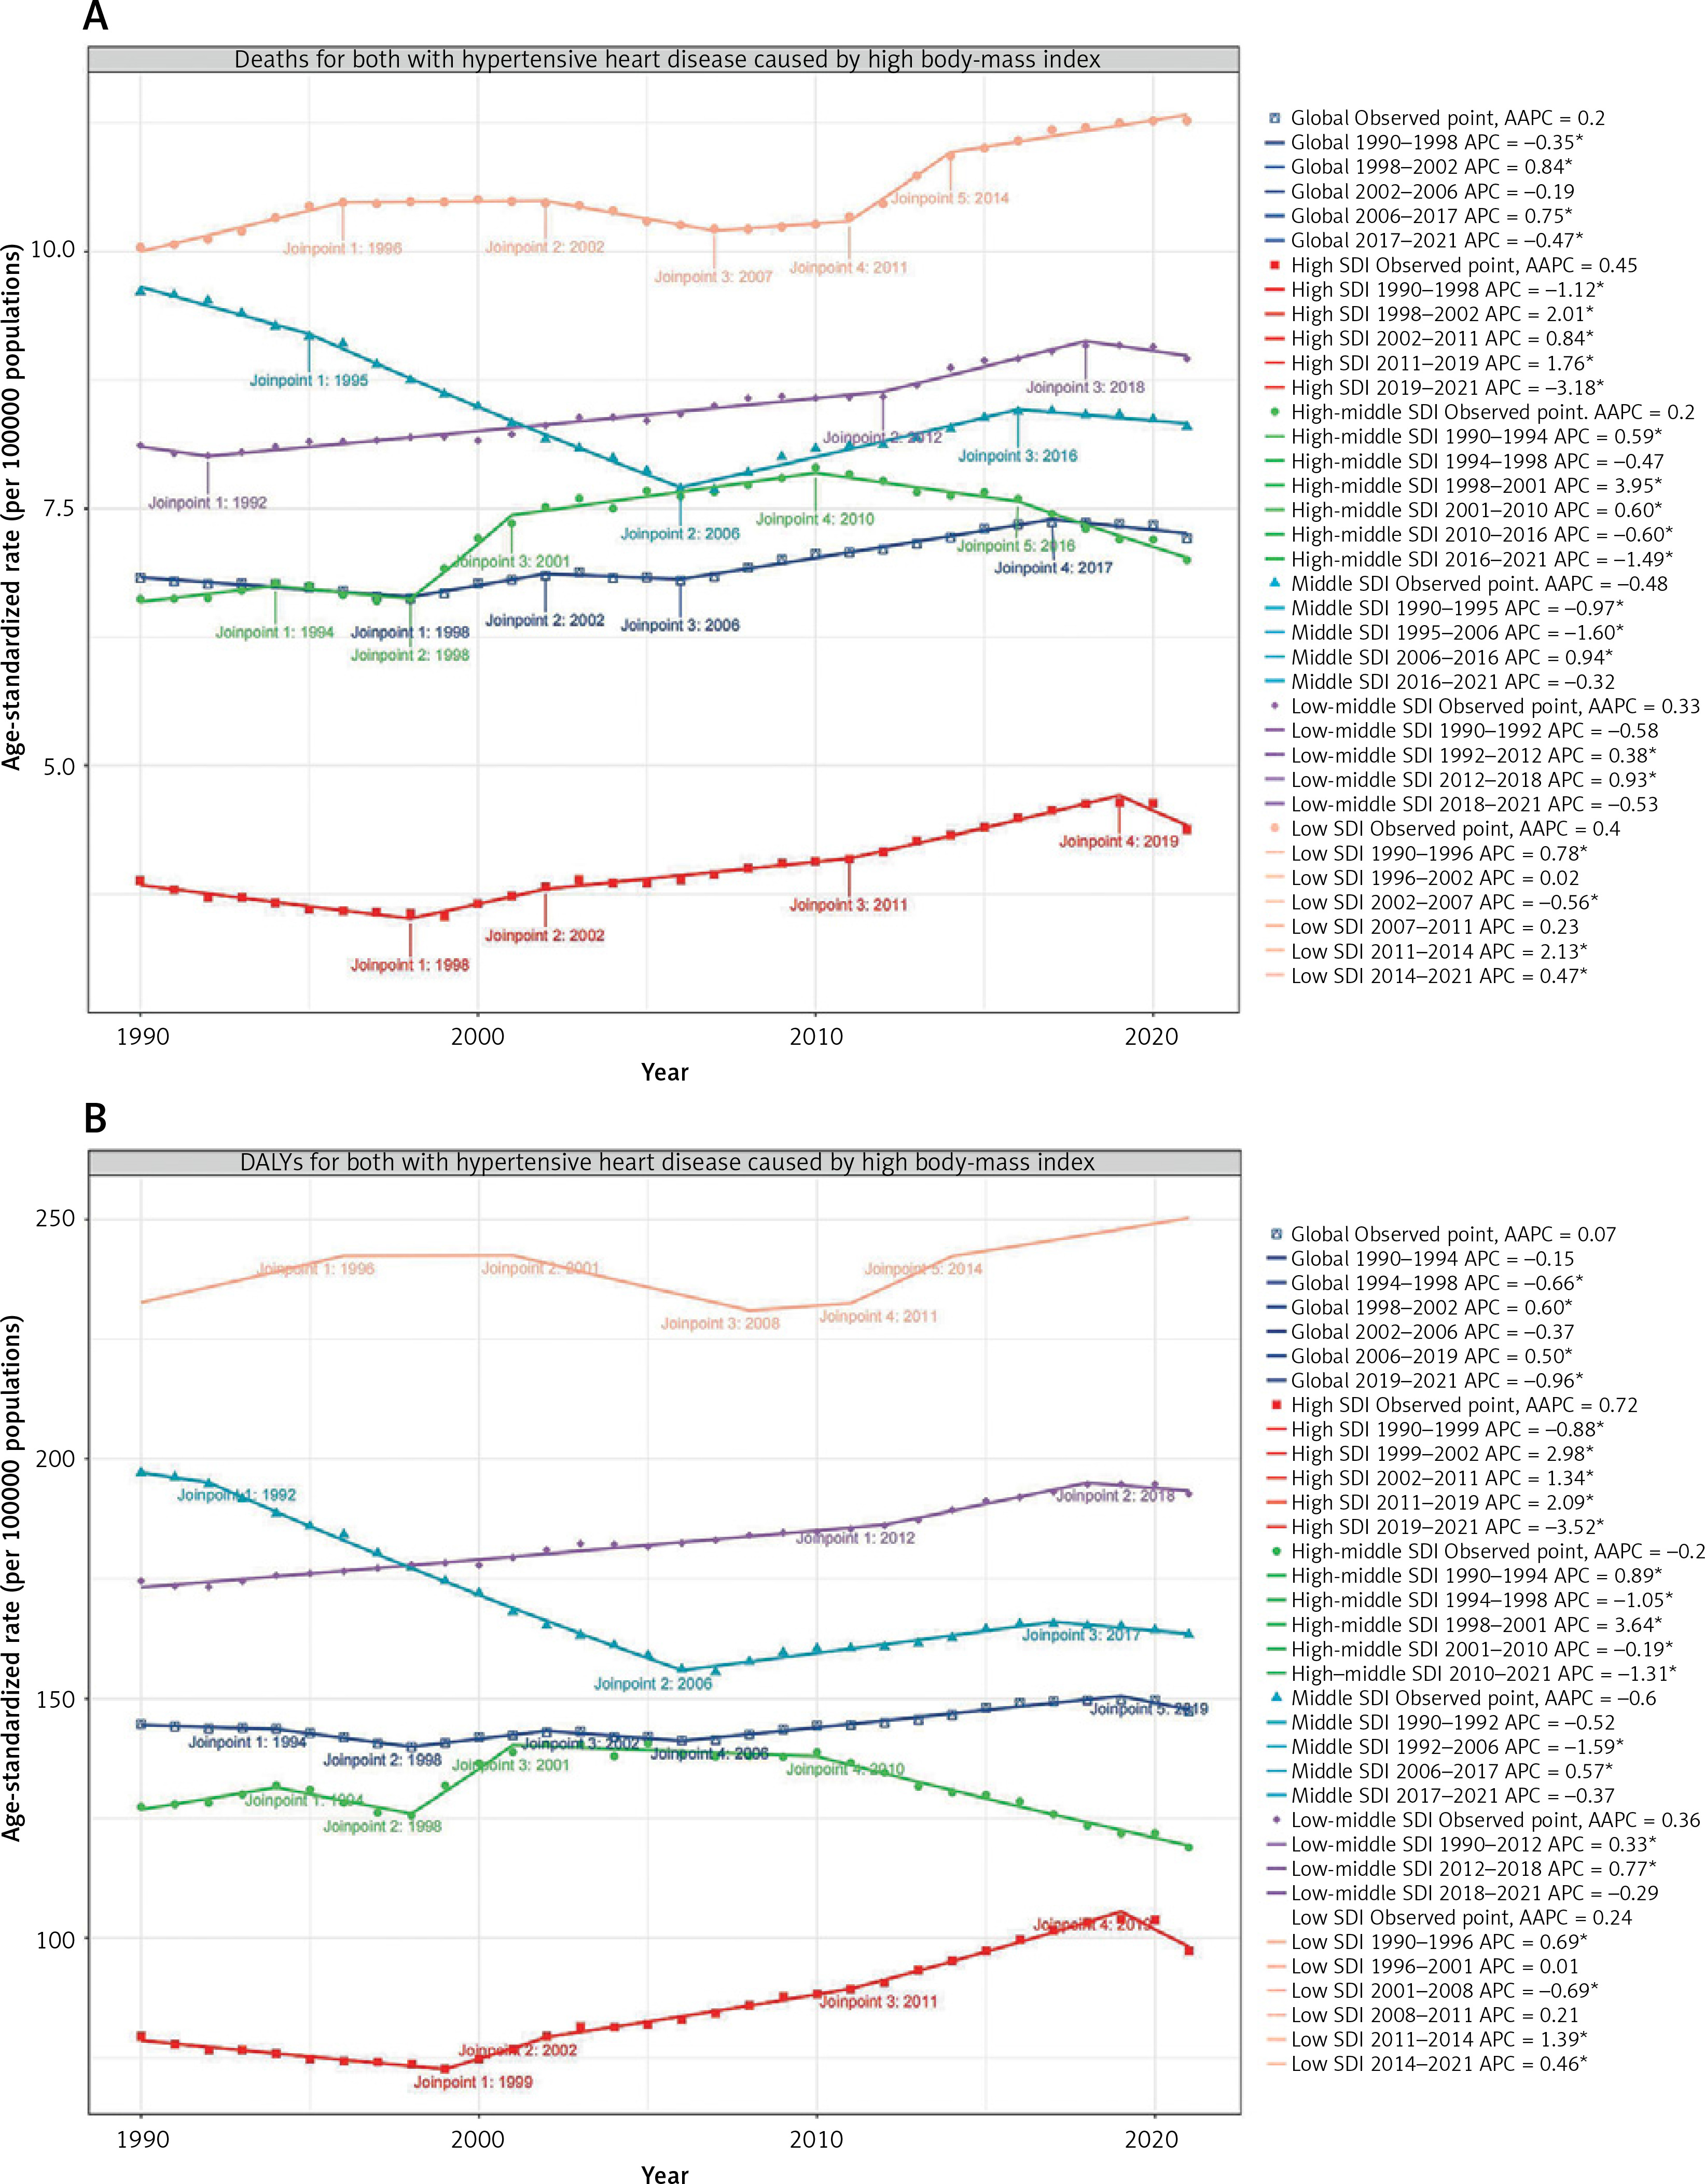
Joinpoint regression analysis. A – Joinpoint regression analysis of ASMR for HHD attributable to HBMI globally and for SDI quintiles from 1990 to 2021. B – Joinpoint regression analysis of ASDR for HHD attributable to HBMI globally and for SDI quintiles from 1990 to 2021
HHD – hypertensive heart disease, HBMI – high body mass index, ASMR – age-standardized mortality rates, ASDR – agestandardized DALY rates, SDI – sociodemographic index
Joinpoint regression analysis
The global ASMR and ASDR APC for HHD attributable to HBMI from 1990 to 2021 and the corresponding data are presented in Figure 2 and Supplementary Tables SIII. Initially, the global ASMR APC showed a significant decrease (1990–1998, APC = –0.35, p < 0.05), followed by a significant increase (1998–2002, APC = 0.84, p < 0.05), and a slight decrease (2002–2006, APC = –0.19, p = 0.485). From 2006 to 2017, there was a significant increase, peaking in 2017 (APC = 0.75, p < 0.05), followed by an overall steady decline (Figure 2 A). Table II indicates an ASMR AAPC of 0.2 (0.08–0.31) for global HHD attributable to HBMI from 1990 to 2021. The ASDR showed a similar trend (Figure 2 B), peaking in 2019 with an AAPC of 0.07 (–0.04–0.18) (Table II). Dividing the region by SDI, middle SDI exhibited the highest fluctuations in ASMR and ASDR, with significant declines from 1990 to 2006 (ASMR: 1990–1995, APC = –0.97, 1995–2006, APC = –1.6. ASDR: 1990–1992, APC = –0.52, 1992–2006, APC = –1.59, p < 0.05), followed by significant increases (ASMR: 2006–2016, APC = 0.94. ASDR: 2006–2017, APC = 0.57, p < 0.05) and a subsequent steady decline. Of the five SDI regions, only low SDI showed an increasing trend in the final joinpoint ASMR and ASDR (ASMR: 2014–2021, APC = 0.47. ASDR: 2014–2021, APC = 0.46, p < 0.05). Table II shows that for ASMR, the AAPC was 0.45 (0.25–0.66) for high SDI, 0.2 (–0.03–0.43) for high-middle SDI, –0.48 (–0.58 to –0.38) for middle SDI, 0.33 (0.2–0.47) for low-middle SDI, and 0.4 (0.29–0.52) for low SDI. For ASDR, the AAPC was 0.72 (0.49–0.95) for high SDI, –0.2 (–0.39–0) for high-middle SDI, –0.6 (–0.71 to –0.49) for middle SDI, 0.36 (0.3–0.42) for low-middle SDI, and 0.24 (0.14–0.33) for low SDI.
Table II
AAPC in deaths and DALYs for HHD attributable to HBMI
Decomposition analysis on HHD attributable to HBMI
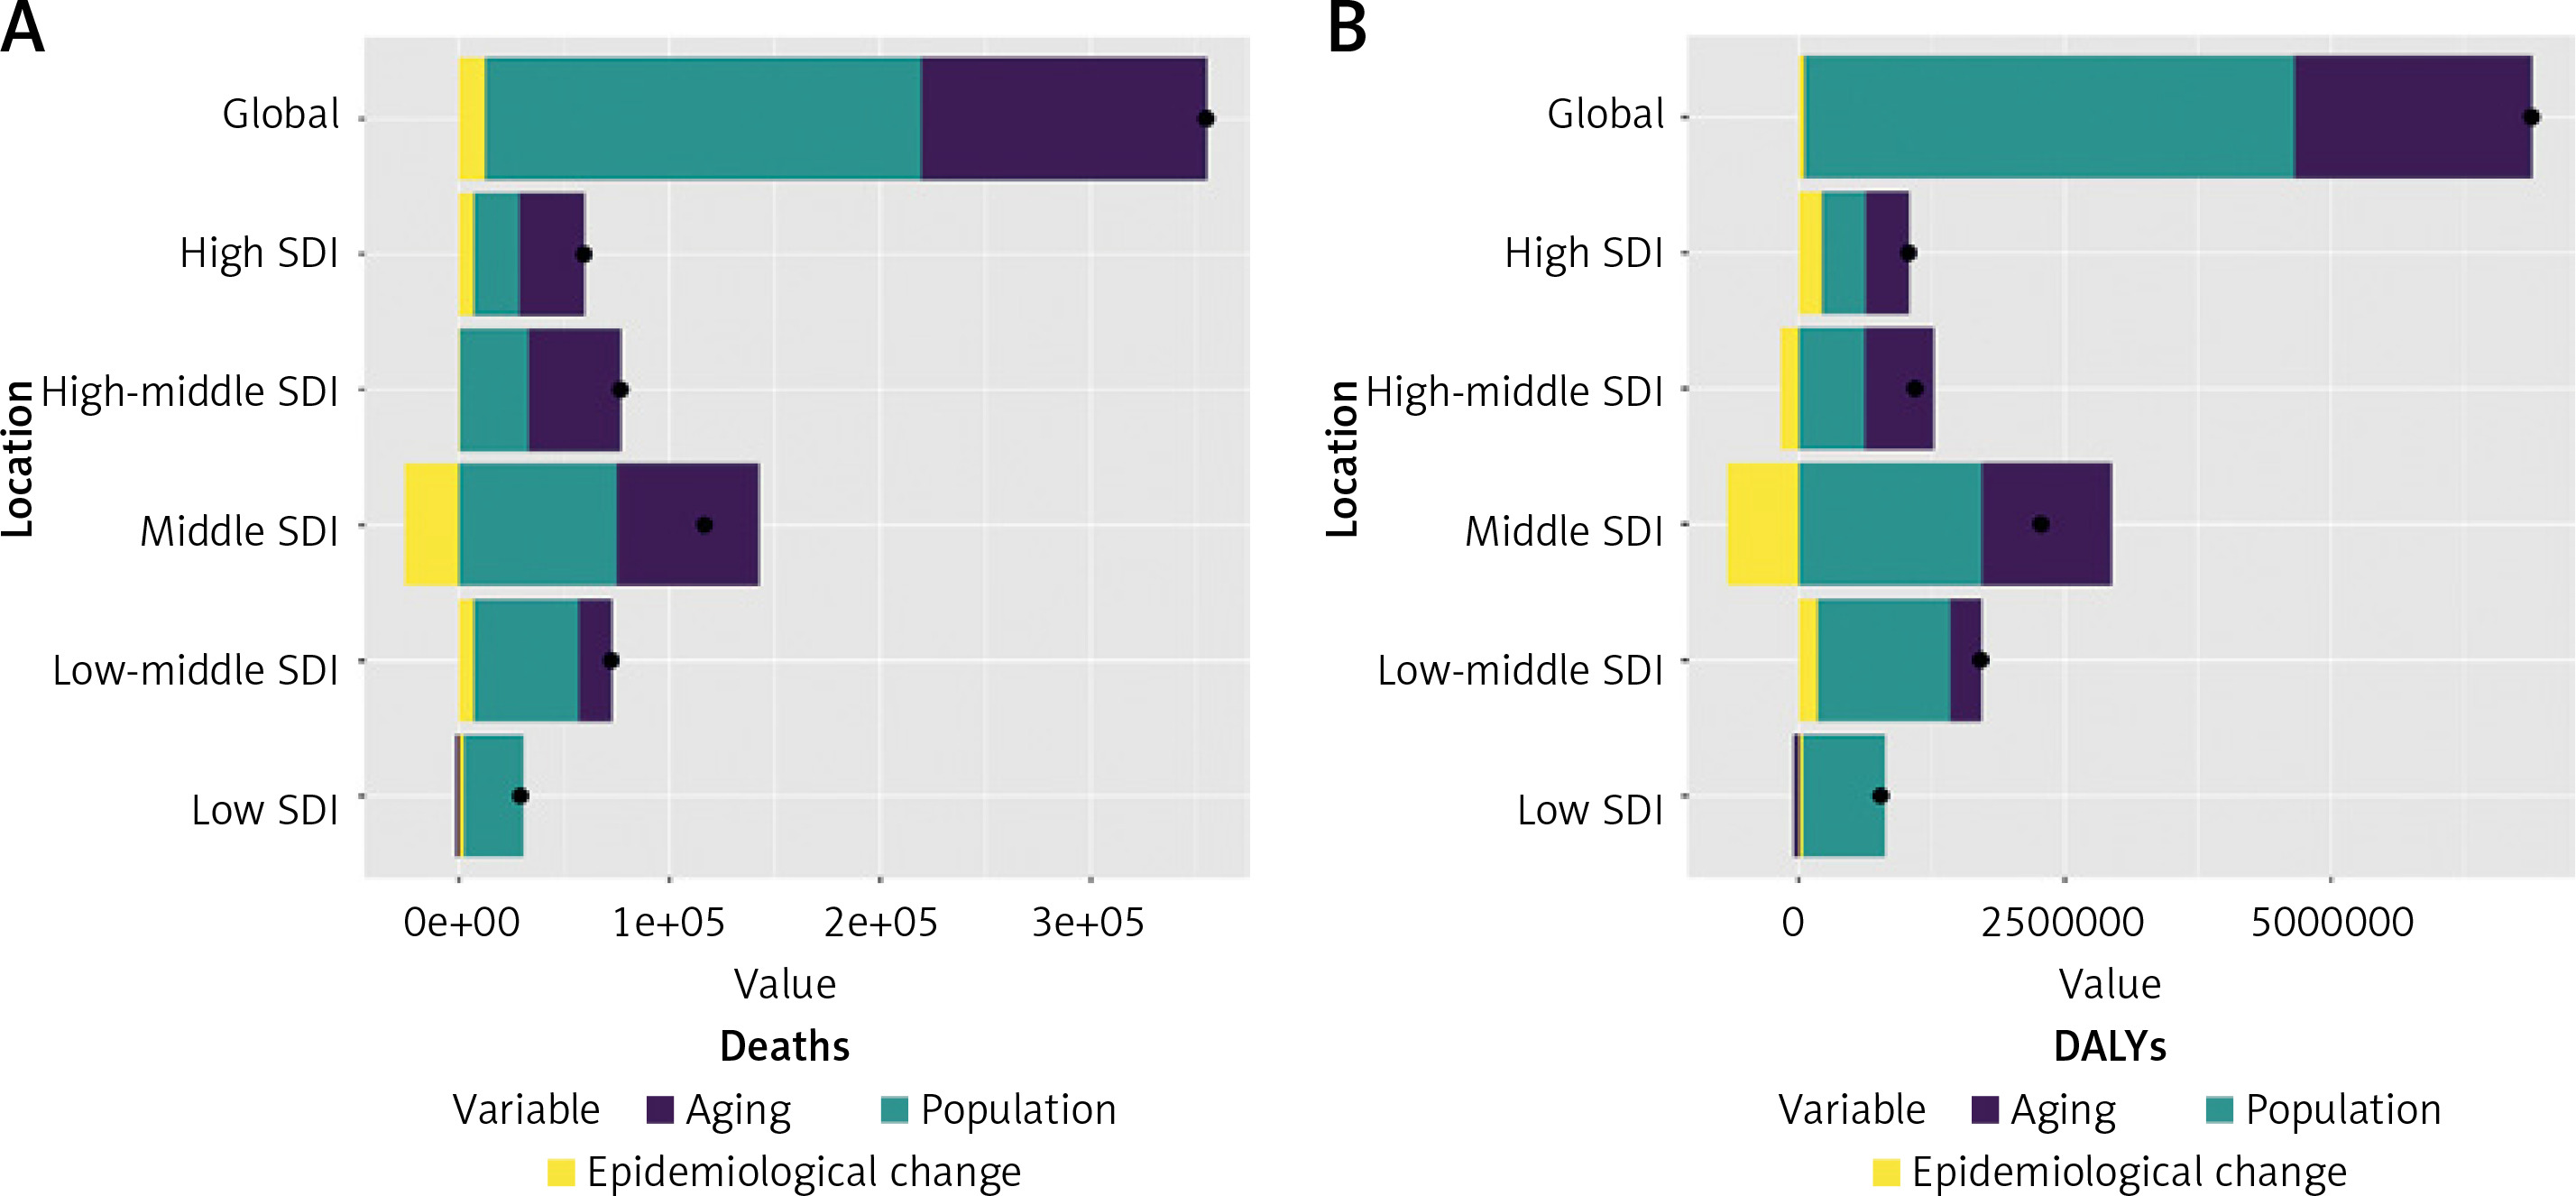
Over the past 32 years, global HHD attributable to HBMI has seen a significant rise in both deaths and DALYs, with middle SDI experiencing the highest increase (Figure 3). Aging, population growth, and epidemiological changes contributed to 38.14%, 58.41%, and 3.45% of the global increase in deaths, respectively, and 32.40%, 66.87%, and 0.73% of the global increase in DALYs. Table III shows that the most significant contributions to deaths were from aging in the high-middle SDI (59.16%), population growth in the low SDI (96.65%), and epidemiological changes in the high SDI (21.21%). For DALYs, the most significant contributions came from aging in the middle SDI (26.99%), population growth in the low SDI (100.46%), and epidemiological changes in the high SDI (20.94%). Population growth had the most pronounced effect on both deaths and DALYs across all SDI quintiles and subgroups. Interestingly, epidemiological changes negatively impacted both deaths and DALYs in middle SDI.
Table III
Decomposition analysis on deaths and DALYs for HHD attributable to HBMI
Figure 3
Changes in mortality and DALYs of HHD attributable to HBMI by SDI quintile, based on global aging, population growth, and epidemiologic changes from 1990 to 2021. Black dots indicate the total value of change attributable to all three components. For each component, a positive value indicates a corresponding increase in deaths and DALYs for that component, while a negative value indicates a corresponding decrease in deaths and DALYs attributable to that component
HHD – hypertensive heart disease, HBMI – high body mass index, DALYs – disability-adjusted life-years, SDI – sociodemographic index.
Cross-country inequality analysis
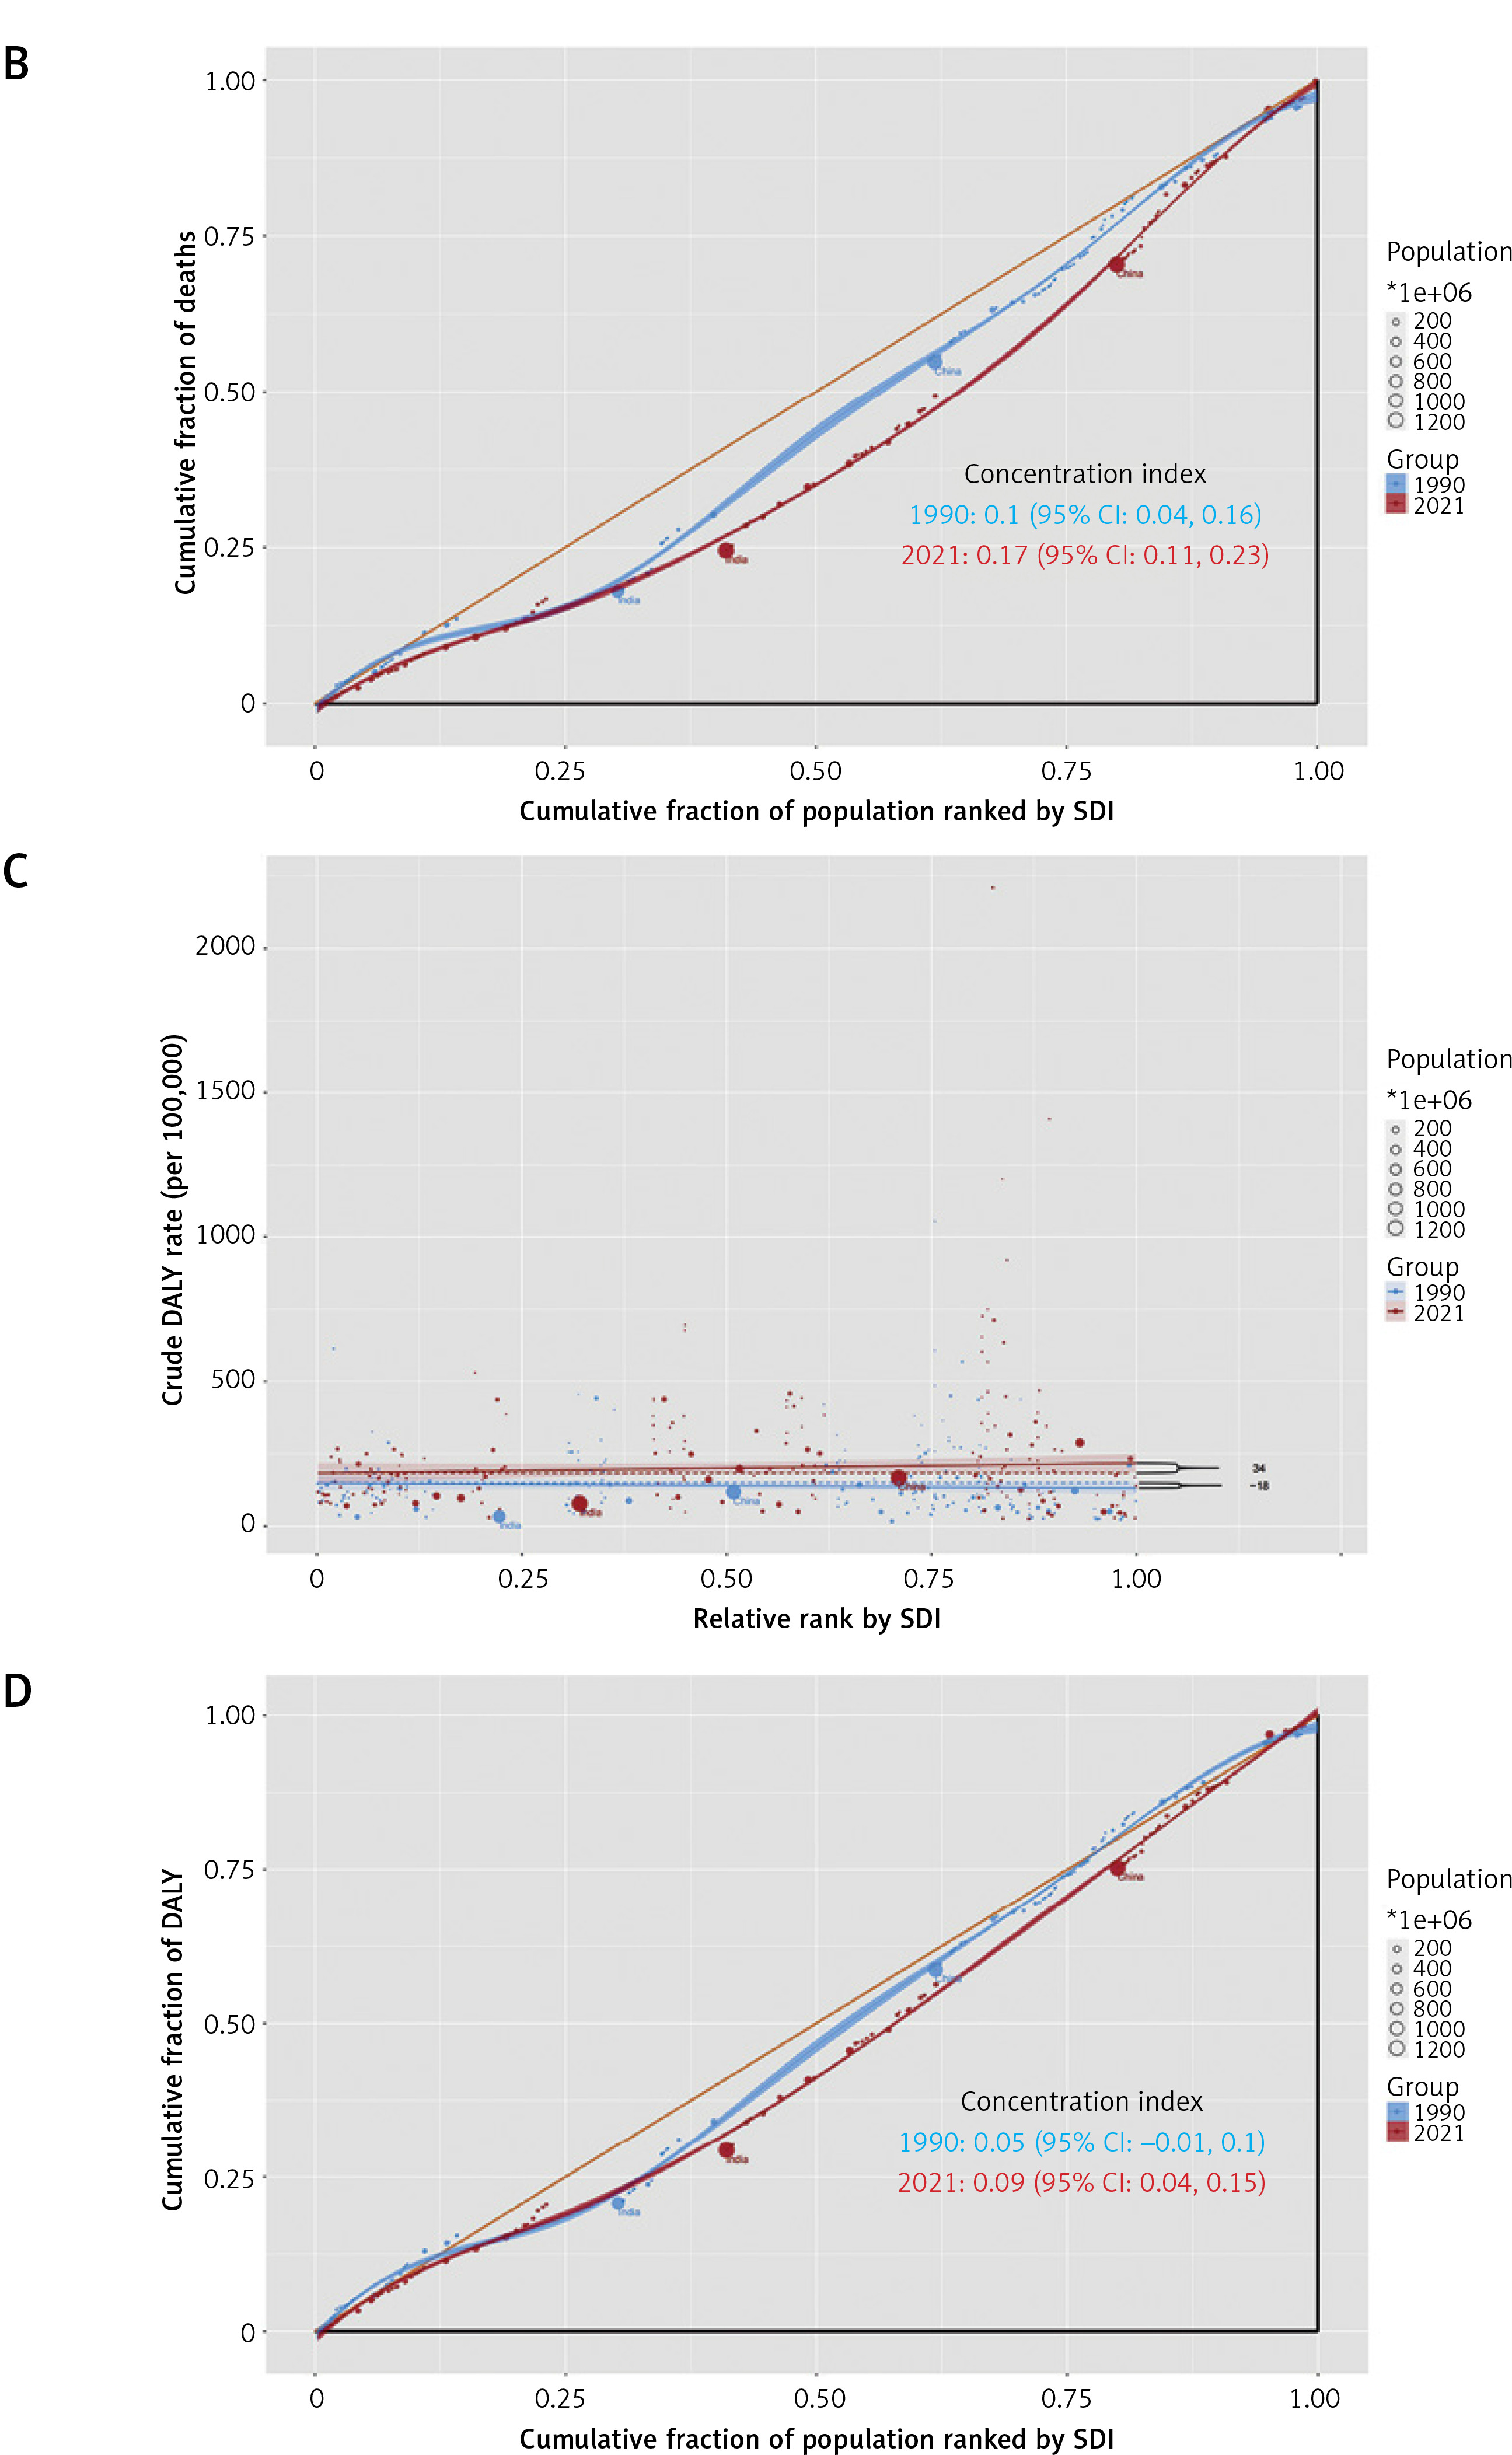
Figure 4 illustrates that the crude death rates and crude DALY rates for HHD attributable to HBMI are significantly correlated with SDI-related inequality, which increases over time. Notably, deaths and DALYs are disproportionately concentrated in countries with higher levels of sociodemographic development. The skewness index indicates that between 1990 and 2021, the rate of crude deaths per 100,000 people in countries with the highest SDIs compared to those with the lowest increased from 1 to 6. Similarly, the crude DALY rate per 100,000 people rose from -18 to 34. Additionally, as a measure of relative gradient inequality, the cumulative fraction of deaths was 0.10 (95% CI: 0.04–0.16) in 1990 and increased to 0.17 (95% CI: 0.11–0.23) in 2021. The cumulative fraction of DALYs rose from 0.05 (95% CI: –0.01–0.10) in 1990 to 0.09 (95% CI: 0.04–0.15) in 2021, suggesting an uneven distribution of the burden among different SDI countries.
Figure 4
SDI-related health inequality regression (A) and concentration (B) curves for the deaths due to HHD attributable to HBMI worldwide, 1990 and 2019. SDI-related health inequality regression (C) and concentration (D) curves for the DALYs of HHD attributable to HBMI worldwide, 1990 and 2019
HHD – hypertensive heart disease, HBMI – high body mass index, SDI – sociodemographic index, DALYs – disability-adjusted life-years.
Global disease burden prediction for HHD attributable to HBMI
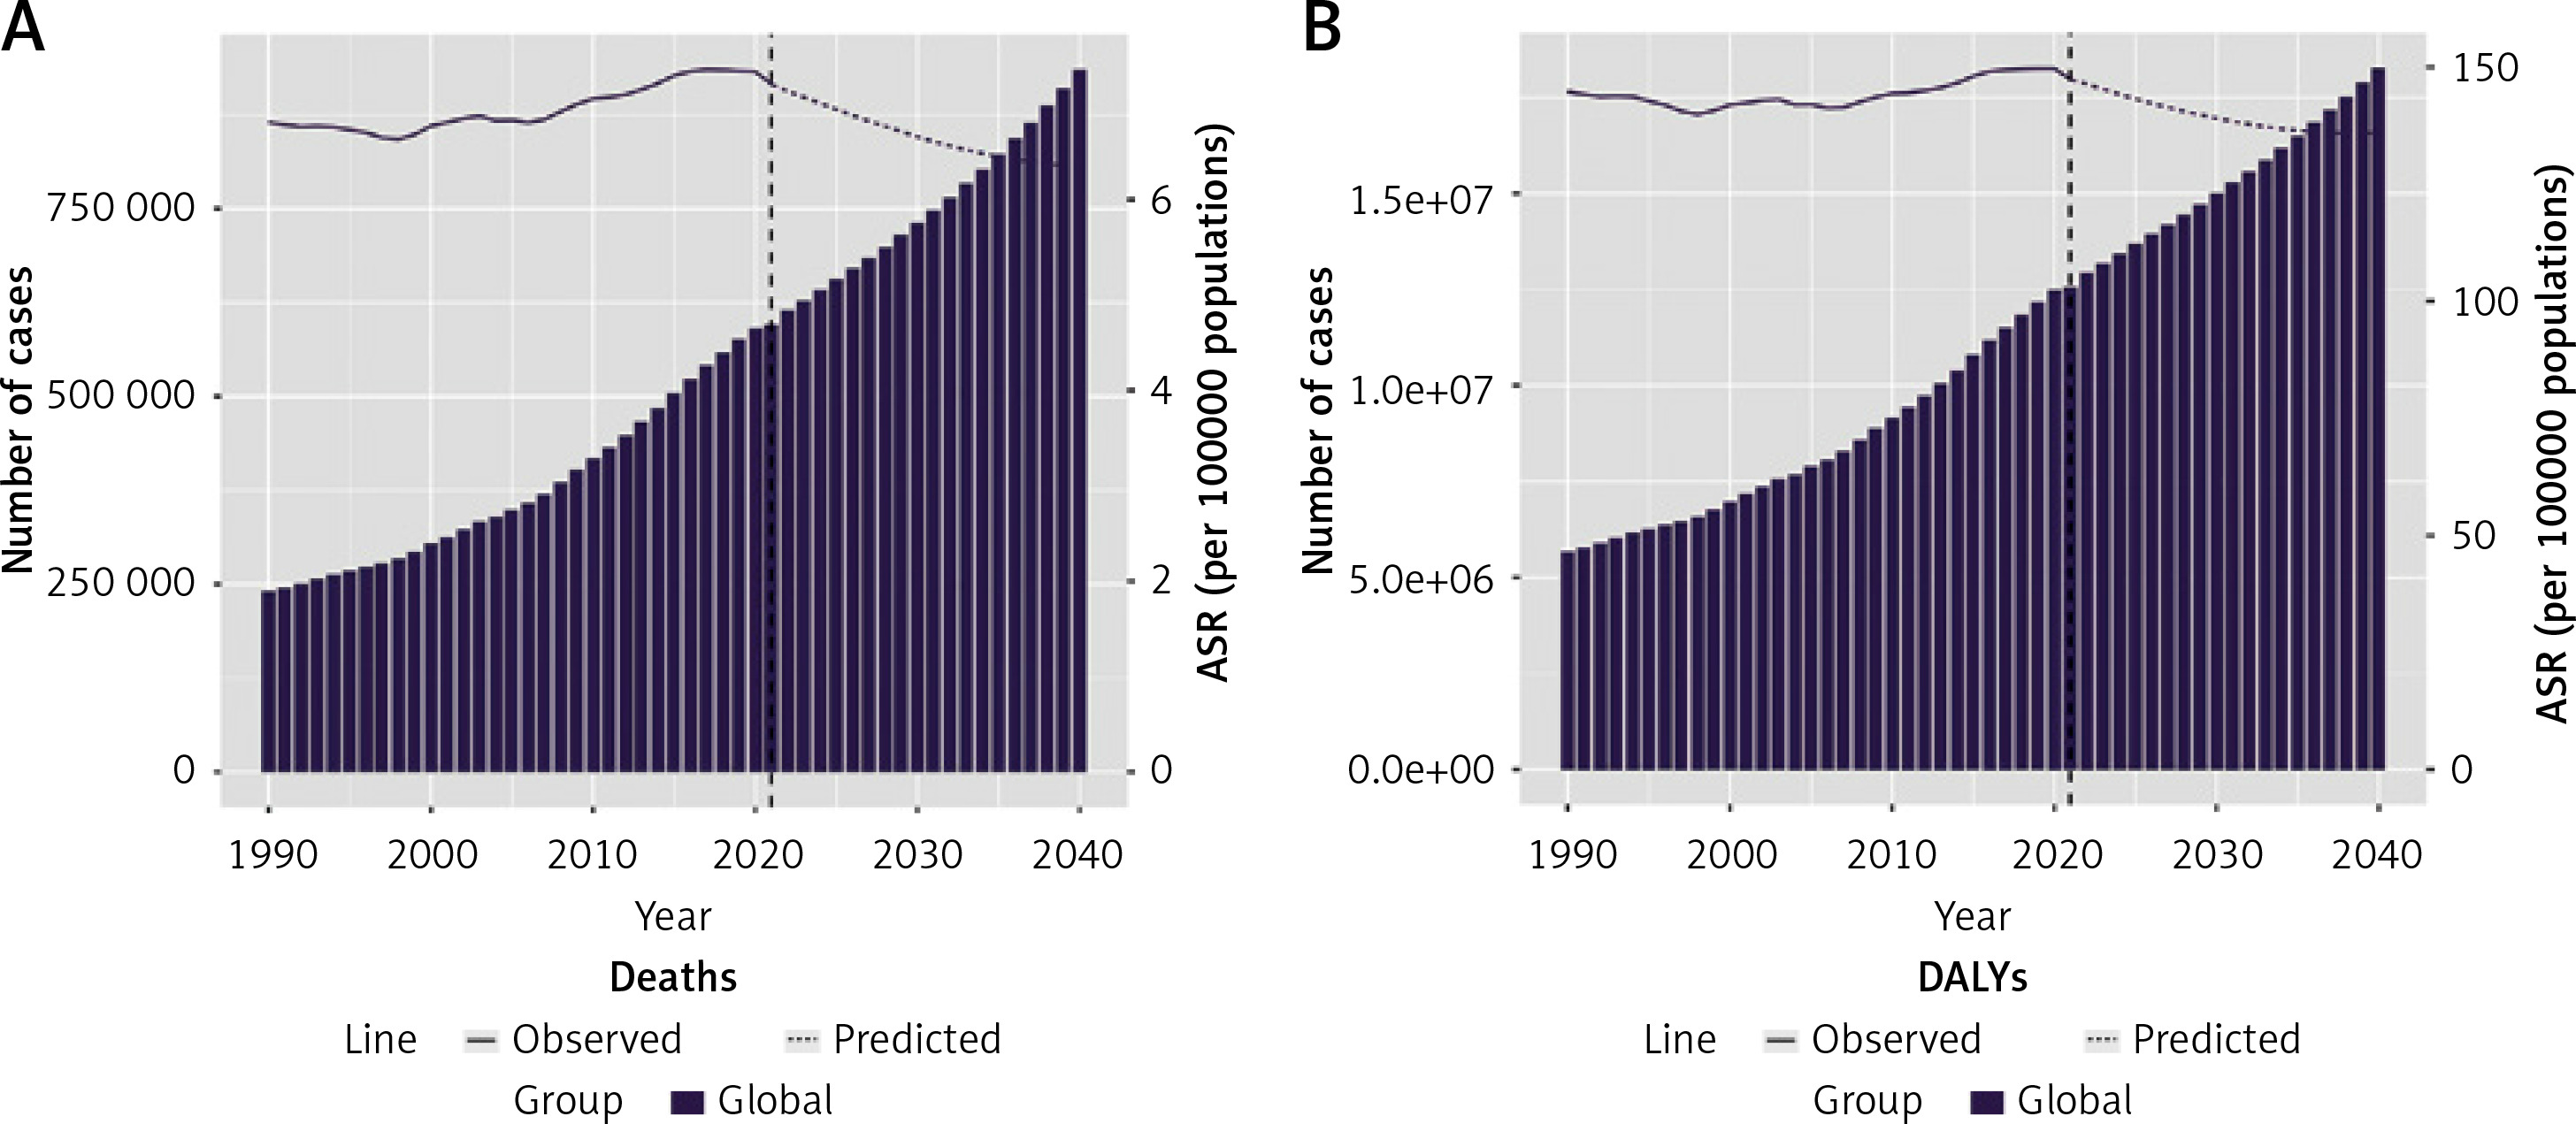
In this study, we used GBD 2021 data from 1990 to 2021 and applied the BAPC model to predict trends in the global burden of disease for HHD attributable to HBMI from 2022 to 2040. The results, presented in Figure 5 and Supplementary Tables SIV, suggest that the number of deaths and DALYs from HHD attributable to HBMI will continue to rise globally over the next 19 years. Both ASMR and ASDR for HHD attributable to HBMI show a similar, gradual, and moderate upward trend.
Figure 5
A – Predicted number of deaths and ASMR for HHD attributable to HBMI by 2040. B – The predicted case number of DALYs and ASDR for HHD attributable to HBMI by 2040. Bar graphs represent the quantity, while line graphs represent ASR
HHD – hypertensive heart disease, HBMI – high body mass index, DALYs – disability-adjusted life-years, ASR – age-standardized rates, ASMR – age-standardized mortality rates, ASDR – age-standardized DALY rates.
Discussion
Obesity is a significant risk factor for cardiovascular disease, a major contributor to HHD, and it increases the risk of death from HHD [23, 24]. Obesity causes chronic hypoxia in visceral fat, resulting in the formation of reactive oxygen species (ROS), which triggers an inflammatory response that damages the heart, contributing to HHD and accelerating cardiac damage [25–27]. It is well known that both obesity and HHD are pro-inflammatory disease states [16]. Additionally, adipocytes release factors such as leptin, which stimulate aldosterone secretion and cause sympathetic dysregulation [28]. Elevated leptin and aldosterone levels lead to endothelial dysfunction and cardiac fibrosis [29, 30]. Notably, endothelial dysfunction and cardiac fibrosis are key pathological features of HHD [31, 32]. More importantly, a high-calorie diet in obese patients induces angiotensinogen production, which upregulates renin-angiotensin-aldosterone system (RAAS) activation [33]. The role of RAAS in the concurrent development of obesity and HHD is significant [34]. These findings highlight the pathogenesis of HHD associated with obesity or HBMI [35].
In this study, we demonstrated an increasing trend in the global burden of HHD deaths attributable to HBMI from 1990 to 2021, consistent with previous research. A previous study indicated that in 1990, the global age-standardized burden of HHD was primarily associated with HBMI (25.5%), a high-sodium diet (20.8%), and lead exposure (9.3%). By 2019, the leading contributors had shifted to HBMI (40.5%), a high-sodium diet (16.3%), and alcohol consumption (9.5%). These findings underscore the growing impact of HBMI on the burden of HHD over time [10]. Higher SDI regions exhibit lower ASMR and ASDR, likely due to initiatives in recent years such as community workshops and health material distribution that emphasized nutrition, physical activity, and chronic disease management. These efforts may have partially alleviated the burden of HBMI and HHD in these areas [36]. However, a significant gap persists between health literacy and economic development in low SDI and high SDI regions. Individuals from lower socio-economic backgrounds often face substantial challenges in accessing health literacy resources, limiting their ability to effectively manage conditions such as HBMI [37]. In contrast, most developed countries exhibited lower ASMR and ASDR, while higher rates were observed in many African countries and a few along the Mediterranean coast. This finding highlights the influence of economic development on health promotion. Specifically, developed countries tend to have a higher prevalence of weight control and chronic disease management concepts, contributing to better health outcomes [38, 39].
Regional analysis by SDI revealed the most significant fluctuations in ASMR and ASDR in the middle SDI region, likely due to its more volatile economy [40]. Among the five SDI regions, only low SDI demonstrated an increasing trend in ASMR and ASDR during the final joinpoint period. In low SDI regions, poor adherence to healthy eating, regular physical activity, and smoking cessation contribute to unfavorable outcomes. Furthermore, limited access to essential secondary prevention medications, such as aspirin, β-blockers, angiotensin-converting enzyme inhibitors, and statins, exacerbates the burden of cardiovascular disease in these countries [41]. Decomposition analyses revealed that population growth and aging were the primary drivers of changes in the burden of HHD attributable to HBMI-related deaths. Cross-country inequality analyses indicated that high SDI countries bear a disproportionate share of this burden and that SDI-related inequalities have widened over time. Notably, despite declining ASMR and ASDR for HHD attributable to HBMI in high-income countries, total deaths and DALYs continue to rise. This paradox may stem from three key factors. First, population aging serves as the central driver. With significantly increased elderly populations in these nations, where HHD risk grows exponentially with age, mortality reductions per age group are offset by expanded at-risk demographics [42]. Second, population growth creates additive effects. Though growth rates are low, large population bases amplify absolute death numbers through scale effects [43]. Third, the improvement of disease diagnosis and reporting has compensated for the correction of statistical bias, especially with the promotion of electronic health records (EHR) and the improvement of the national disease registration system, making death statistics more comprehensive [44]. While the global trend in ASMR and ASDR for HHD attributable to HBMI is projected to increase gradually and moderately from 2022 to 2040, the total number of deaths and DALYs is expected to rise. This highlights the significant challenges that lie ahead in controlling and managing HHD attributable to HBMI in the coming decades. To address the burden of HHD attributable to HBMI in resource-limited settings, a multi-level approach is essential. First, implement community-based health education to promote low-salt diets and BMI monitoring, using accessible formats such as radio dramas and community theater to raise awareness, while establishing community gardens to reduce the cost of healthy diets. Second, strengthen primary healthcare by adopting simplified risk assessment tools to guide the rational use of essential antihypertensives and integrate mobile health technologies such as SMS reminders and low-cost blood pressure monitors to enhance management efficiency. Concurrently, advocate for policy interventions, including salt reduction in processed foods, construction of free public fitness facilities, and prioritized access to secondary prevention medications and emergency training for high-risk populations. This integrated strategy balances behavioral, clinical, and systemic actions to optimize the impact under resource constraints [45–47].
This study has some limitations. First, the data analyzed were derived from GBD 2021, an online database providing predictive information on disease burden rather than real-time surveillance data. Second, the etiology of HHD is highly complex, and our analysis excluded risk factors other than HBMI. However, a single risk factor often cannot fully explain the development of HHD. Third, the prediction of the burden of HHD attributable to HBMI in this study relied on mathematical algorithms, which require validation through actual epidemiologic investigations to ensure accuracy.
In conclusion, this is the first study to compare and analyze the burden of HHD attributable to HBMI using data from the GBD 2021 database. The findings reveal that global ASMR and ASDR for HHD attributable to HBMI have generally increased over time, with ASMR and ASDR showing a negative correlation with SDI: regions with low SDI exhibit the highest rates. Projections indicate a slight increase in global ASMR and ASDR for HHD attributable to HBMI over the next 19 years. Fortunately, the major risk factors associated with HHD are reversible, presenting a significant opportunity for prevention. Effective weight control can play a crucial role in preventing HHD, while managing obesity may be a key strategy for slowing its progression.