Introduction
Hypertension is considered the most significant individual factor of risk for mortality and morbidity among cardiovascular events worldwide [1, 2]. A major complication of hypertension is hypertensive heart disease (HHD) [3]. Hypertensive individuals with HHD are more likely to develop myocardial infarction and congestive heart failure [4, 5].
As life expectancy among populations increases, the prevalence of hypertension is anticipated to decrease, resulting in a corresponding decrease in the burden of HHD [6]. An accurate and contemporary evaluation of HHD burden at national and area levels would provide valuable information to guide policy-making. Additionally, advancing our understanding of the risk factors for HHD is critical to determine research priorities.
To our knowledge, no survey has yet obtained the worldwide evaluated annual percentage change (EAPC) in HHD burden by performing linear regressions with statistics from the Global Burden of Diseases, Injuries, and Risk Factors Study (GBD) 2019 datasets [7]. The most contemporary survey on HHD made use of statistics from the GBD 2017 to determine the overall change in percentage in disease burden between the years of 1990 and 2017 [7]. GBD evaluations are renewed annually with reformed modelling tactics as well as additional statistics origins [7]. Furthermore, the risk factors that contribute to HHD-associated disability-adjusted life years (DALYs) and mortality have not been evaluated [7]. There has been no accurate renewal of worldwide epidemiological information on HHD and its attributable risk factors. Thus, our survey complements and expands on findings from previous studies.
The GBD 2019 is an extensive effort to provide annual statistics on 369 injuries and illnesses and 87 risk factors in 204 countries and areas worldwide [8]. We made use of HHD statistics from the GBD database between 1990 to 2019 to analyze temporary tendencies in the prevalence standardized by age, mortality rate, and DALYs for HHD to (a) determine the worldwide HHD burden; (b) identify high-risk populations using stratification for age, socio-demographic index (SDI), and sex; and (c) investigate tendencies in mortality and DALYs that could be attributed to risk factors for HHD. Our analysis results will provide important information for understanding the global trend of HHD disease burden, and will help provide targeted strategies for future HHD disease prevention and management in different regions, and provide strong data support for public health decision-making.
Material and methods
Data and materials statement
The statistics was publicly available from the GDB Results Tool of Global Health Data Exchange (GHDx) (http://ghdx.healthdata.org/gbd-results-tool).
Overview
We obtained HHD-related statistics from the GBD 2019 dataset [8]. We obtained the annual prevalence rate, the mortality, the DALYs, the age-standardized rate, the death rate standardized by age, the DALYs standardized by age and for HHD between the years of 1990 and 2019. We also gathered statistics on risk factors for HHD-associated mortality. Stratifications were performed on the basis of sex, region (21 in total), and areas or countries (204 in total). A detailed description of the procedures used in GBD 2019 can be found elsewhere [8]. The statistics were provided by the GBD Collaborative Network and the Institute for Health Metrics and Evaluation (IHME).
Data were available for 204 areas and countries. Areas and countries were modified as low, low-middle, middle, high-middle, or high SDI and categorized into 21 areas in different geographies. The SDI is a comprehensive referent of a place’s location on a development range [9]. It is the composite of three covariates (total fertility rate below 25 years old, indicated educational attainment for individuals aged 15 and older, and distributed lag earnings per capita) with grades ranging from 1 to 0 [9]. An index grade of 0 is the representation of the minimal rank for every covariate input and a condition where the selected results of health can be kept balanced. An index grade of 1 refers to the maximal rank of each covariate input and a condition where the selected results of health stop being ameliorated [9].
The tool of Bayesian meta-regression modeling of DisMod-MR 2.1 was applied to survey statistics and determine 95% uncertainty intervals (UIs) [10]. This survey was produced on the basis of the nominators from the Guidelines for Accurate and Transparent Health Estimates Reporting (GATHER) [11]. It was Yuyao People’s Hospital that evaluated as well as supported this survey.
Case definition of HHD
HHD was defined as heart failure with symptoms because of exact long-term impacts of hypertension [6]. HHD was defined by the International Classification of Diseases (ICD)-9 codes 402–402.9 and ICD-10 codes I11–I11.9 [8].
Risk factors
The GBD 2019 provides the evaluations of the attributable mortality rate and DALYs for 87 risk factors and combinations of risk factors at the worldwide and regional levels. A relative evaluation of the risk assessment framework was applied to evaluate the coordination of mortality and DALYs caused by acknowledged risk factors [12]. The risk factors are organized into a four-level hierarchy. Level 1 includes three categories of risk factors (behavioral, occupational and metabolic, and environmental) that are further divided into 20 level-2 risk factors [12]. The details of the framework have been described elsewhere [12].
Statistical analysis
We obtained the EAPCs for selected age-standardized rates of HHD. The EAPCs showed trends for the selected age-standardized rates of HHD within a certain interval of time and were decided by the criterion: Y = α + βX + ε, where Y equals ln (rates standardized by age), X is the year of the calendar, ε is the false term, and β is in the meaning of the passive optimistic or tendency of the selected rates standardized by age. Supposing that the natural logarithm of rates standardized by age alters as time differs, then EAPC = 100 × [exp (β) – 1]. The 95% confidence interval (CI) of the EAPC was obtained from the linear model. When the EAPC itself and its 95% CI floor level were both optimistic, its corresponding rates that were standardized by age showed a decreasing tendency. In the situation that the EAPC and its 95% CI ceiling level were both passive, its relative rates that were standardized by age showed a decreasing tendency. If the EAPC was neither optimistic nor passive positive nor negative (i.e., 0) the rates standardized by age were considered to be stable [13].
Corresponding relationships between the age-standardized rates and EAPCs and between the EAPCs and SDI were obtained with the use of Gaussian process recession and Pearson’s corresponding relationship coefficient (ρ). Every analysis was performed using R software (version 3.5.1).
Results
Analysis of HHD prevalence
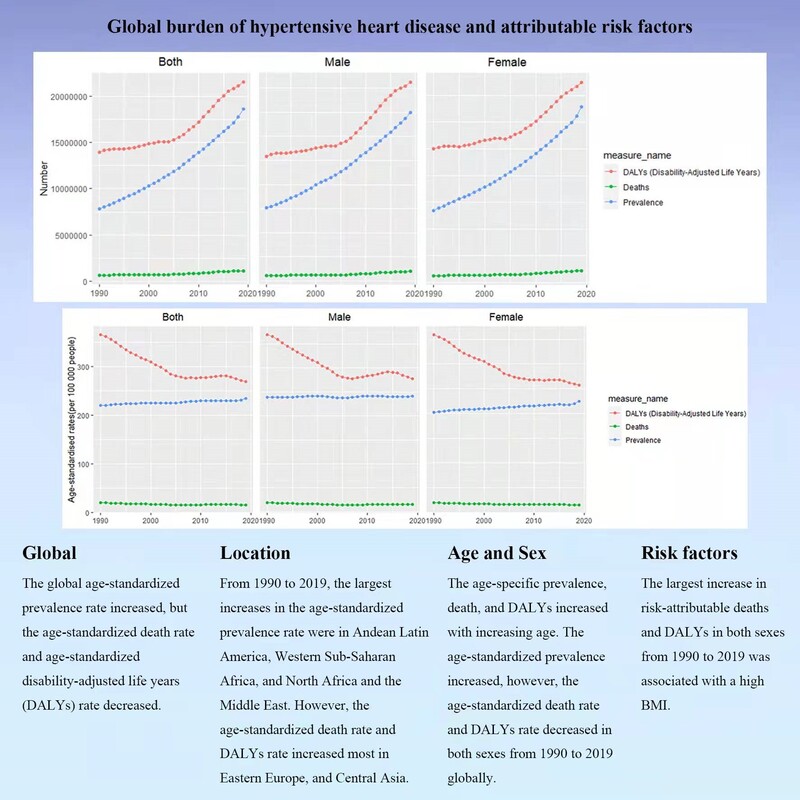
Between the years 1990 and 2019, the worldwide prevalence of HHD increased by 138% from 7,817,320.08 to 18,598,024.58 (Table I). The age-standardized worldwide prevalence rate showed an immortal increasing tendency with an EAPC of 0.17 (95% CI: 0.15 to 0.18) (Table I, Figure 1 A, Supplementary Figure S1 A). The age-standardized prevalence rate of HHD increased in both sexes between the years 1990 and 2019 (female EAPC 0.28; male EAPC 0.02) (Table I, Figure 1 A). The prevalence standardized by age was lower in females than in males (Table I).
Table I
The age-standardized prevalence rate (ASPR) of hypertensive heart disease in 1990 and 2019 and its temporal trends
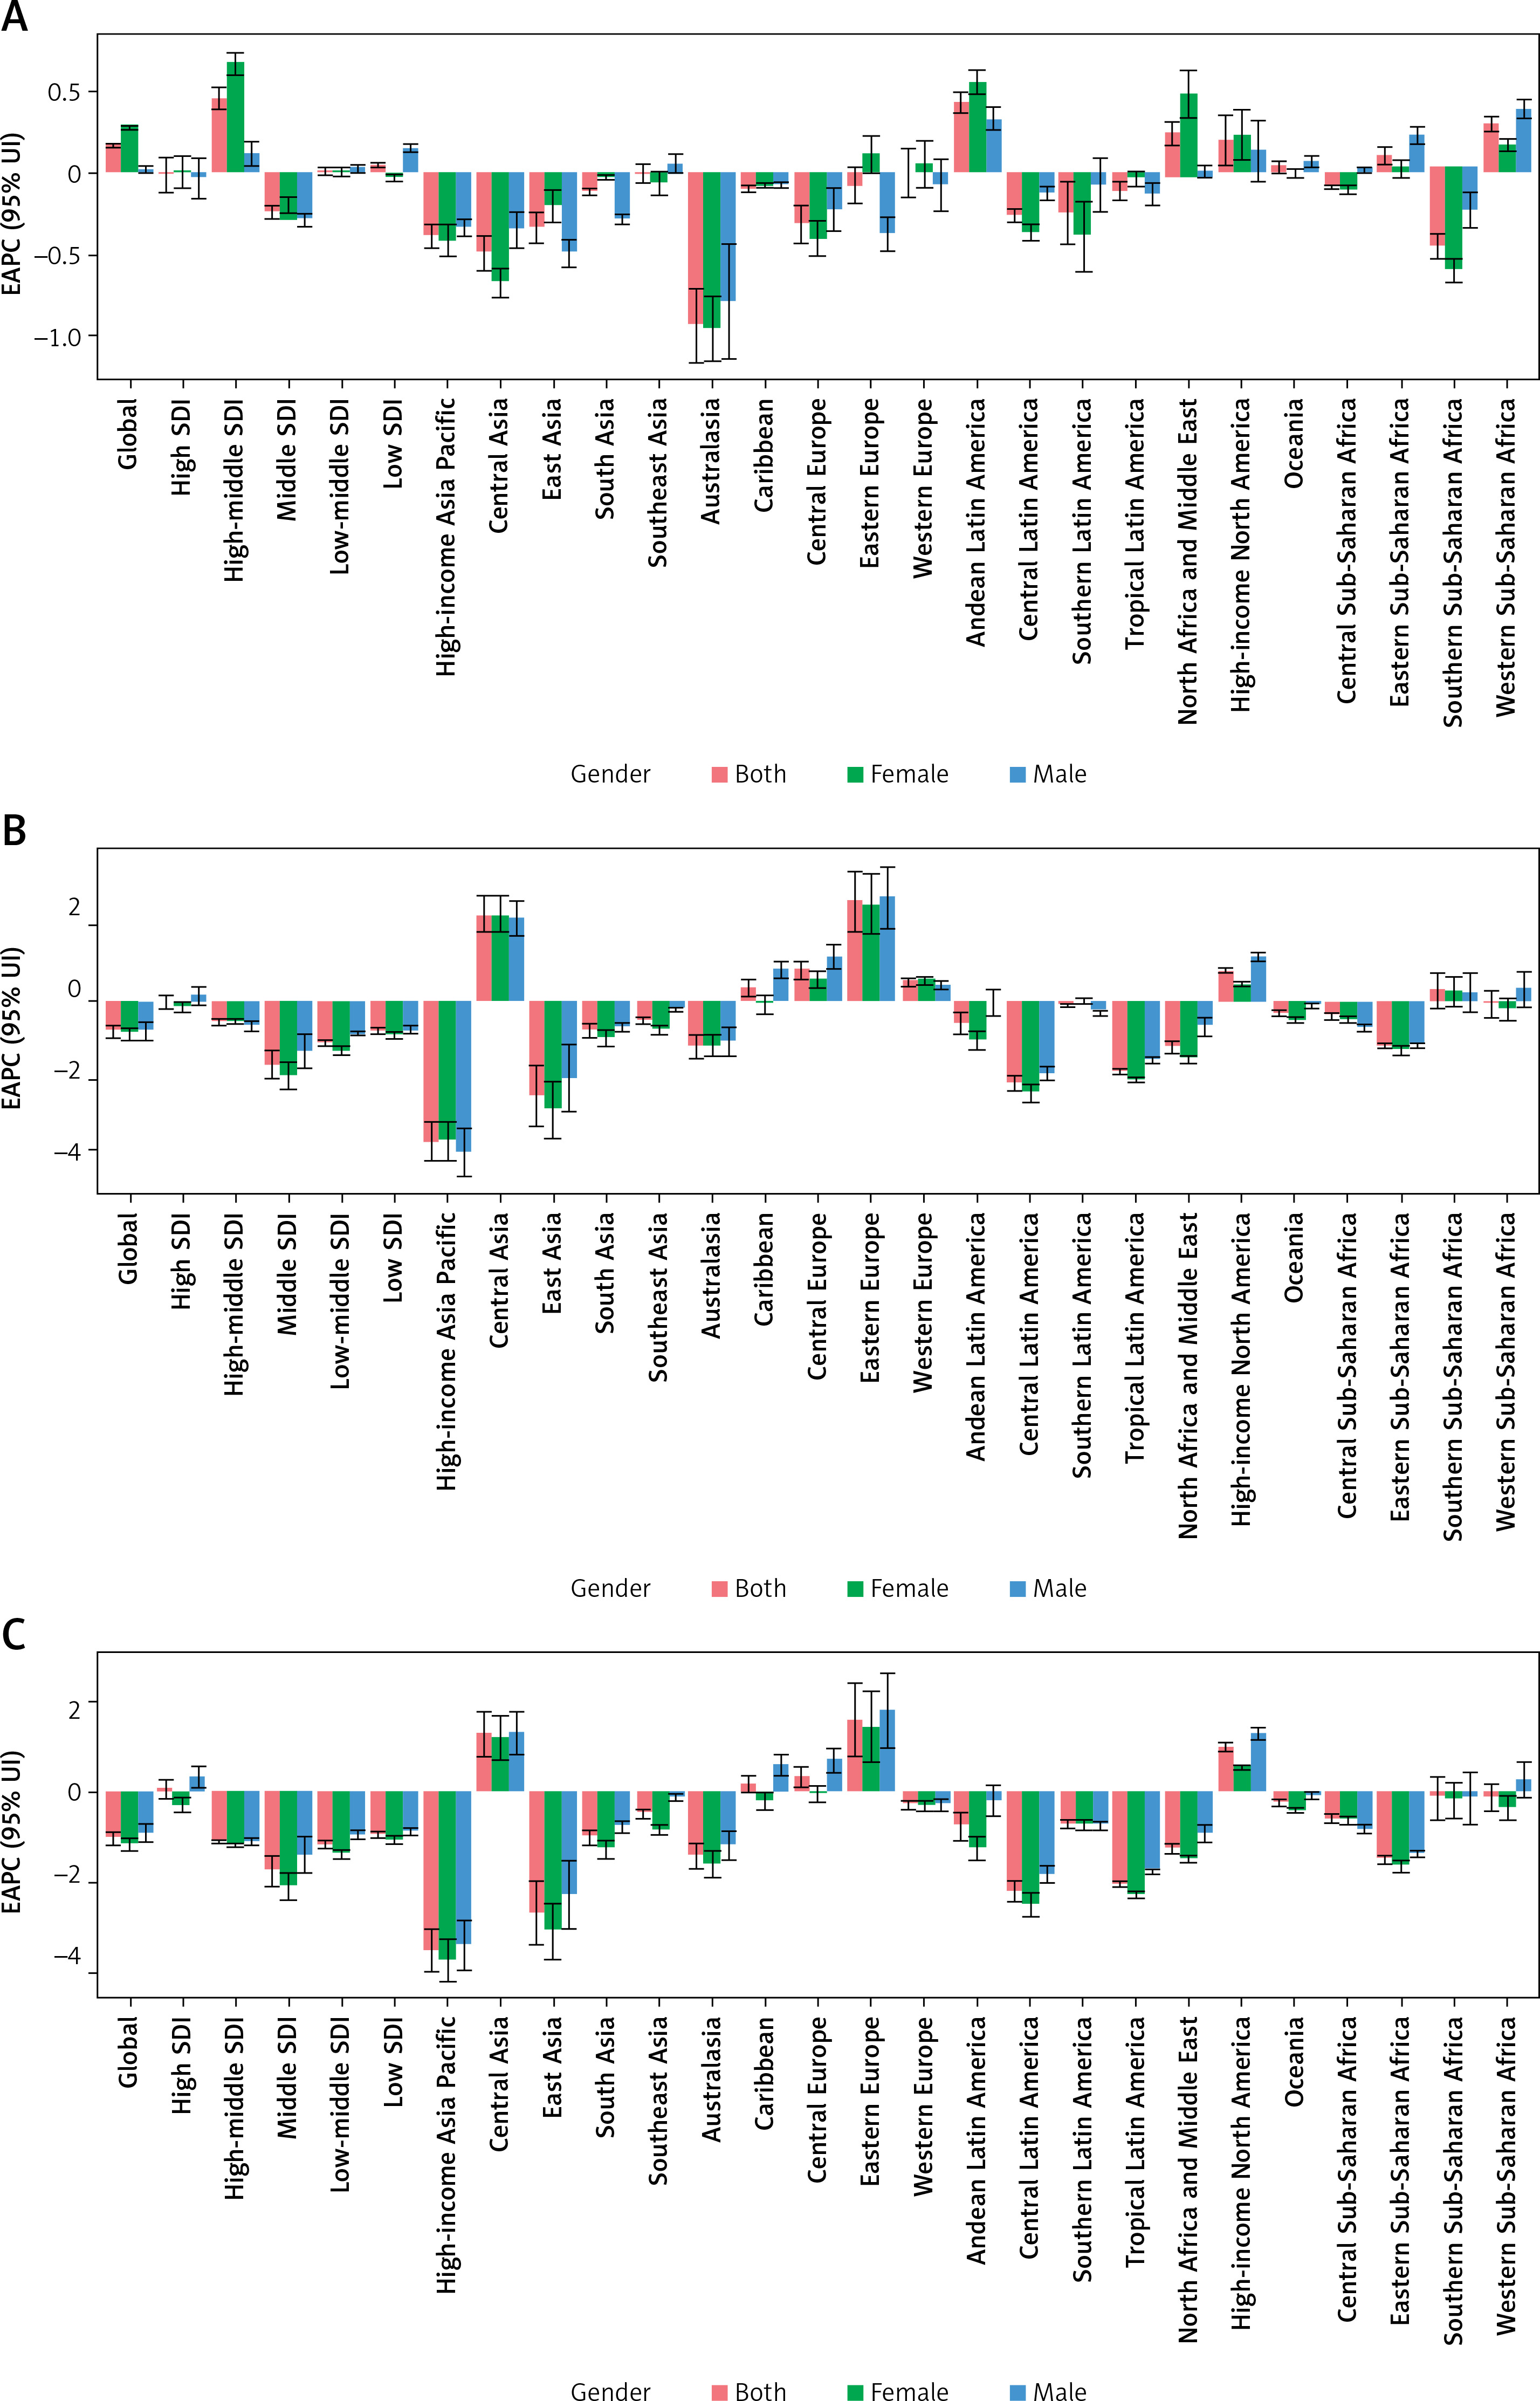
Figure 1
The EAPCs in the rates standardized by age of hypertensive heart disease between the years of 1990 and 2019, by sex and area. A – The EAPC in the prevalence standardized by age. B – The EAPC in the death rate standardized by age. C – The EAPC in the DALYs standardized by age
The female-to-male ratio of HHD prevalence peaked in the 30–34-year age group globally, in the 25–29-year age group in upper SDI areas, in the 35–39-year age group in high-middle SDI areas, and in the 40–44-year age group in low SDI areas (Supplementary Figure S2 A). The HHD prevalence increased with the time of life worldwide and throughout all SDI areas (Supplementary Figure S3).
As listed in Supplementary Figure S1 A and Table I, the age-standardized prevalence rate of HHD was much upper in middle SDI areas than in high or low SDI areas. In 2019, the middle SDI group showed the uppermost prevalence standardized by age, right lower than the high-middle SDI group. The age-standardized prevalence rate increased the most in the high-middle SDI group and the EAPC was highest at 0.46 (Table I, Figure 1 A).
The EAPC in the age-standardized prevalence rate of HHD was optimistically related to the age-standardized prevalence rate (Supplementary Figure S4 A), but passively consistent with the SDI (Supplementary Figure S4 D). In 2019, low SDI areas had the highest HHD prevalence among youngsters (15–49 years), whereas areas where the SDI increased between the years of 1990 and 2019 had higher HHD prevalence in elderly adults (Supplementary Figures S5 A and S5 B). The annual prevalence of HHD decreased among youngsters but increased among elderly adults (Supplementary Figure S6 A).
In 2019, the highest prevalence standardized by age of HHD was observed in East Asia (426.15 every 100,000 population), followed by Oceania (344.91 per 100,000 population) and Southeast Asia (334.77 per 100,000 population), while the lowest prevalence standardized by age was found in Eastern Europe (56.49 per 100,000 population), lower than Australasia (79.10 per 100,000 population) and High-income Asia Pacific (85.08 per 100,000 population) (Table I). From 1990 to 2019, the prevalence standardized by age of HHD increased most in Andean Latin America (EAPC = 0.43), Western Sub-Saharan Africa (EAPC = 0.30), and the Middle East and North Africa (EAPC = 0.24) and decreased most in Australasia (EAPC = –0.94), Central Asia (EAPC = –0.49), and Southern Sub-Saharan Africa (EAPC = –0.45) (Table I, Figure 1 A).
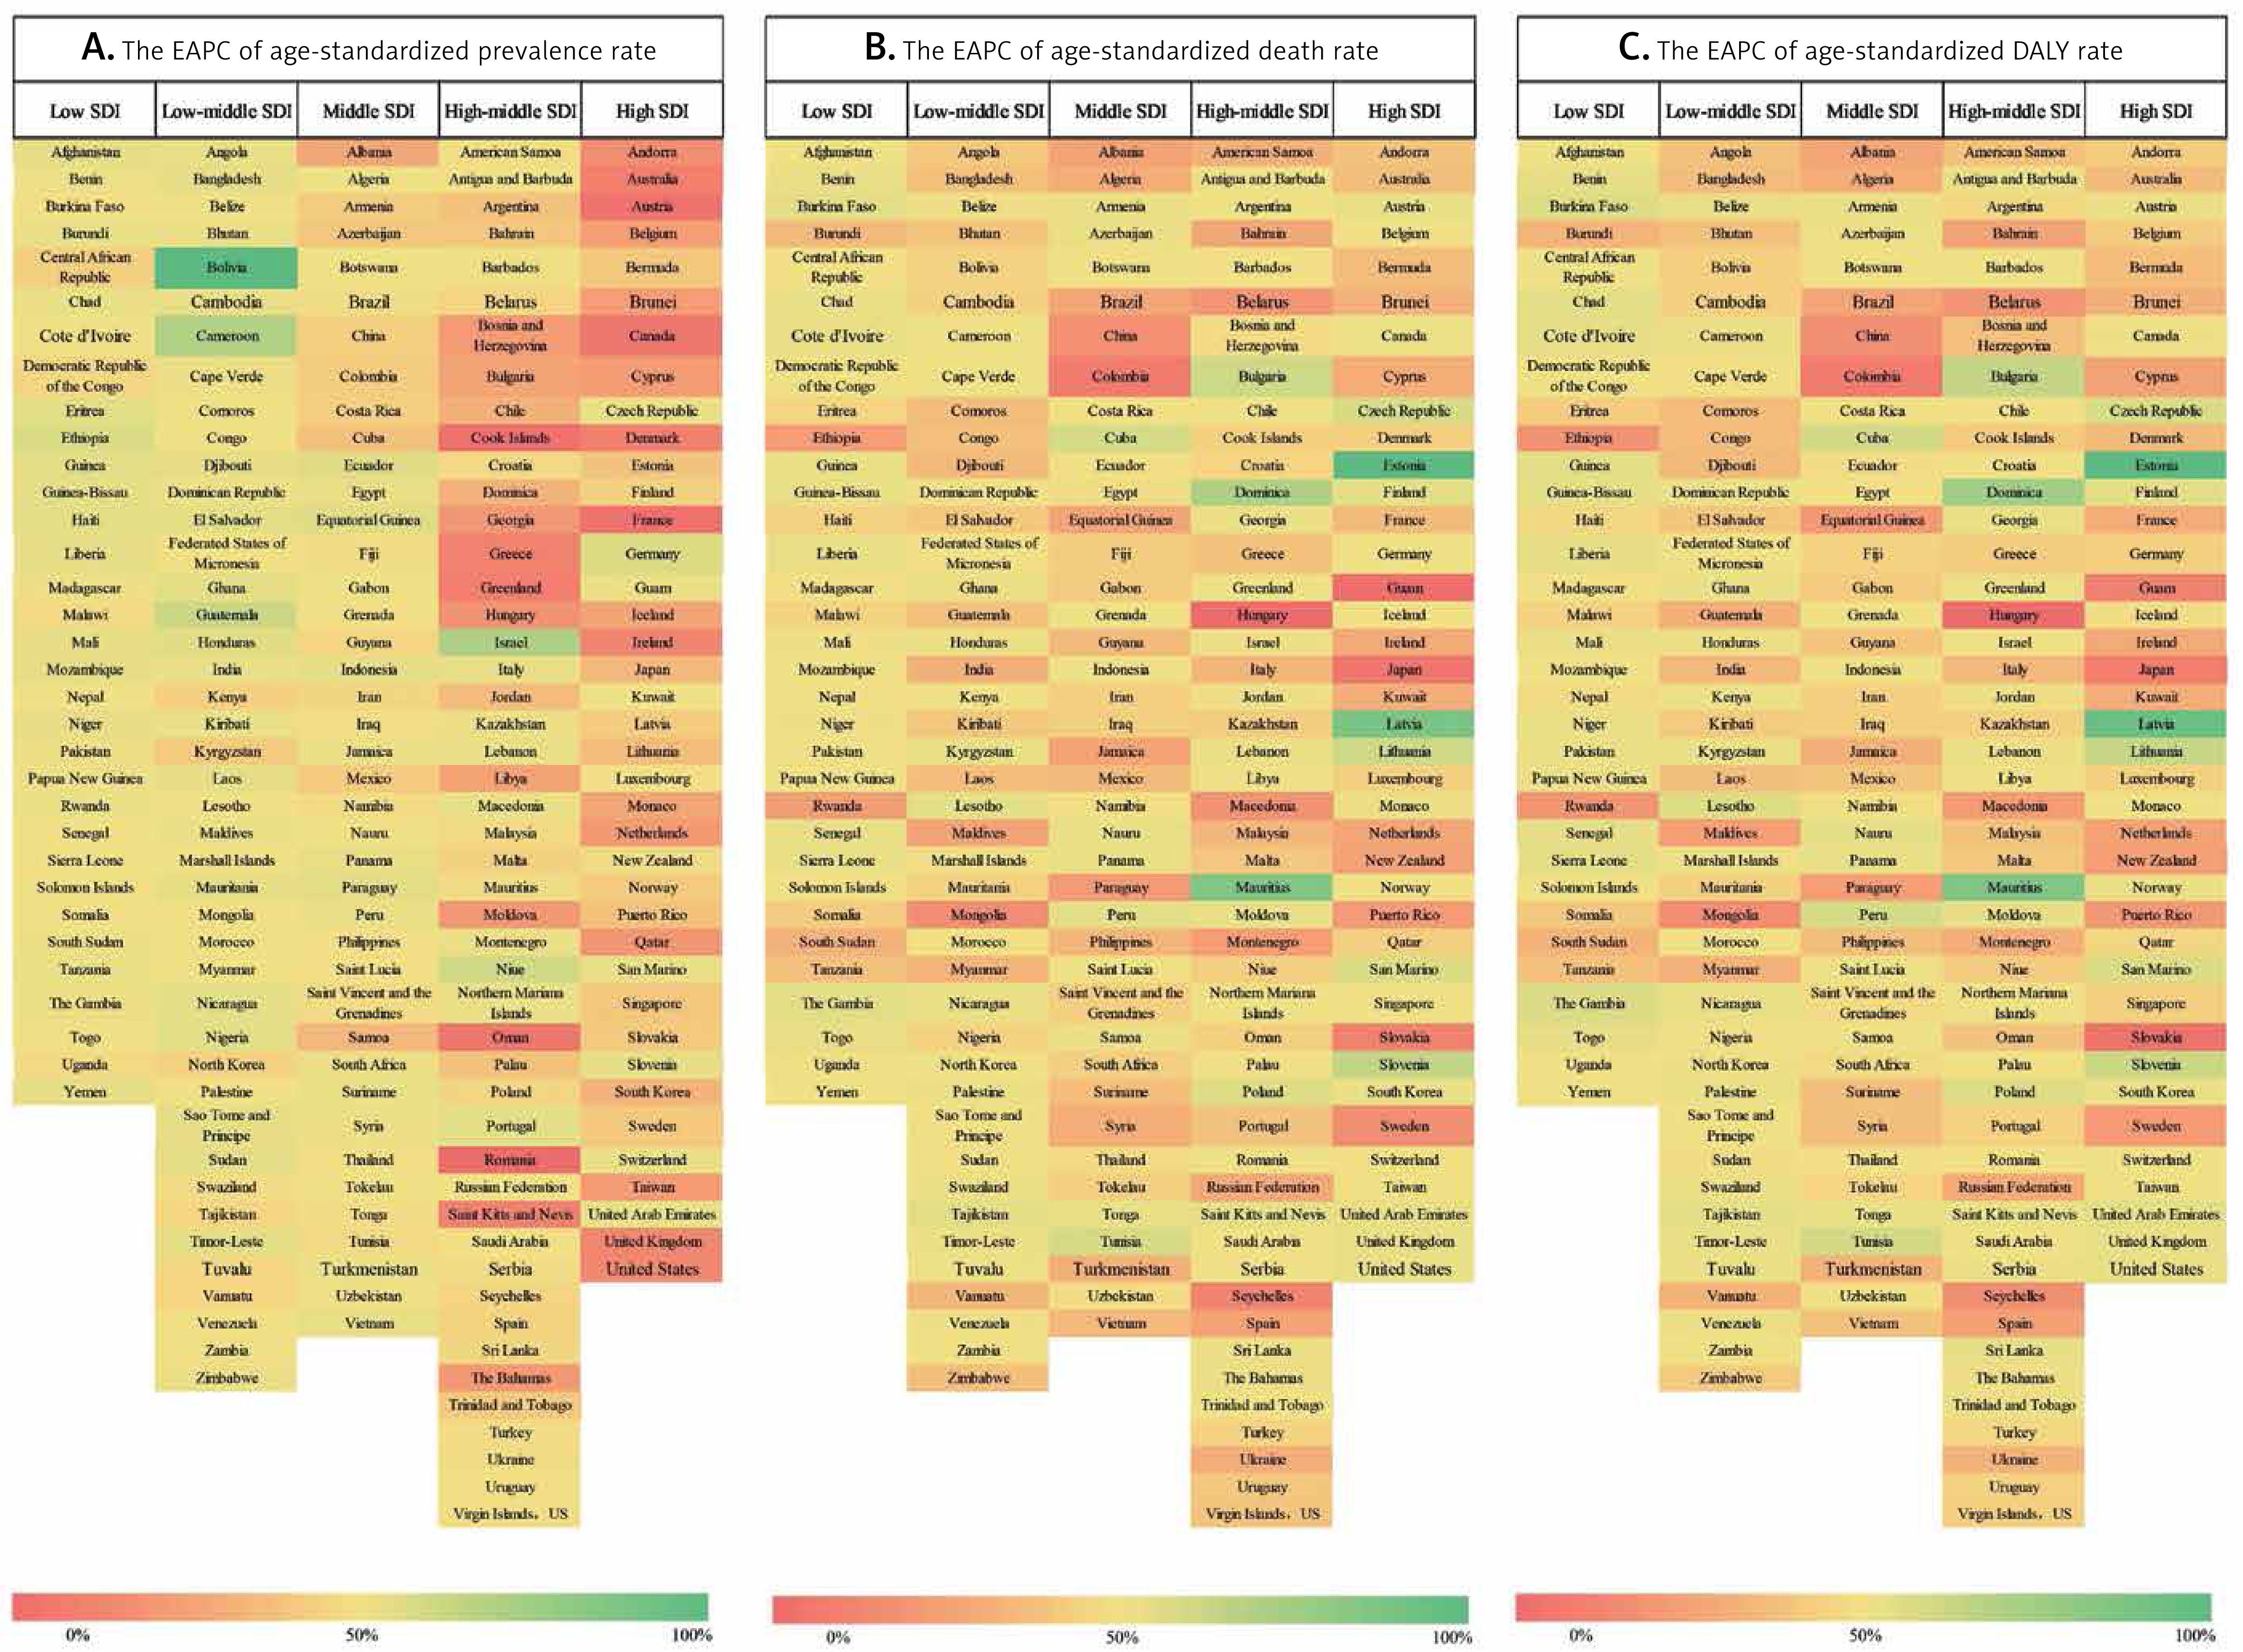
At the level of the country in the year 2019, the highest age-standardized prevalence of HHD was observed in Jordan (561.62 per 100,000 population), right upper than Kuwait (514.94 per 100,000 population) and Seychelles (469.04 per 100,000 population). The lowest prevalence standardized by age of HHD was found in Ukraine (11.88 per 100,000 population), followed by Belarus (28.36 per 100,000 population) and Denmark (30.61 per 100,000 population) (Figure 2 A, Supplementary Tables SI–SIII). From 1990 to 2019, the prevalence standardized by age dropped most in Portugal (total EAPC = –2.49; male EAPC = –2.66, female EAPC = –2.38) and increased most in Bolivia (total EAPC = 2.07; male EAPC = 1.47, female EAPC = 2.95) (Supplementary Tables SI–SV). Age in the following prevalence rate (per 100,000) for HHD in varieties of countries in 2019 are listed in Supplementary Table SVI.
Analysis of HHD-associated mortality
Between the years of 1990 and 2019, worldwide mortality because of HHD increased by 77%, from 654,905.64 in 1990 to 1,156,732.94 in 2019 (Table II). Nevertheless, the mortality rate standardized by age decreased worldwide, with an EAPC of –0.74 (95% CI: –0.91 to –0.57) (Table II, Figure 1 B, Supplementary Figure S1 B). The death rate standardized by age decreased in two of the sexes between the years of 1990 and 2019 (male EAPC = –0.91; female EAPC = –0.79; Table II, Figure 1 B).
Table II
The age-standardized death rate (ASDR) of hypertensive heart disease in 1990 and 2019 and its temporal trends
The death rate standardized by age for HHD from 1990 to 2019 was similar between sexes, as confirmed by the male-to-female ratio of 0.99 (Table II). The male-to-female ratio peaked in the 40–44-year age group worldwide, in the 20–24-year age group in upper SDI areas, and in the 40–44-year age group in low SDI areas (Supplementary Figure S7). The HHD-related death rate increased over the years worldwide and throughout all SDI areas (Supplementary Figure S8).
As is listed in Supplementary Figure S1 B and Table II, the death rate standardized by age for HHD were much upper in low SDI areas. In 2019, the highest death rate standardized by age for HHD was observed in low SDI areas (27.93 per 100,000 population), followed by middle SDI areas (21.62 per 100,000 population). The death rate standardized by age for HHD decreased most in middle SDI areas in which the EAPC was lowest (–1.58) (Table II, Figure 1 B).
The EAPC in the death rate standardized by age for HHD was optimistically consistent with the death rate standardized by age and the SDI (Supplementary Figures S4 B and 4 E). throughout areas, as SDI increased , the coordination of HHD-related mortality among youngsters decreased. Areas, where the SDI increased from 1990 to 2019, had higher coordination of HHD-related mortality among elderly adults (Supplementary Figure S5 D). From year to year, the annual coordination of HHD-related mortality decreased among youngsters but increased among elderly adults (Supplementary Figure S6 B).
In 2019, the highest regional death rate standardized by age for HHD was observed in Central Sub-Saharan Africa (53.52 per 100,000 population), followed by Eastern Sub-Saharan Africa (38.78 per 100,000 population) and Southern Sub-Saharan Africa (34.14 per 100,000 population), while the lowest regional death rate standardized by age of HHD was found in Australasia (2.54 per 100,000 population), followed by High-income Asia Pacific (2.99 per 100,000 population) and Eastern Europe (7.14 per 100,000 population) (Table II). From 1990 to 2019, the death rate standardized by age for HHD increased most in Eastern Europe (EAPC = 2.58), followed by Central Asia (EAPC = 2.25) and Central Europe (EAPC = 0.84), and decreased most in High-income Asia Pacific (EAPC = –3.54), followed by East Asia (EAPC = –2.39) and Central Latin America (EAPC = –2.07) (Table II, Figure 1 B).
The three countries with the highest death rate standardized by age for HHD were Bulgaria (75.08 per 100,000 population), Afghanistan (71.89 per 100,000 population), and the Central African Republic (68.85 per 100,000 population), while those with the lowest death rate standardized by age were Ukraine (1.59 per 100,000 population), Israel (1.95 per 100,000 population), and Norway (1.99 per 100,000 population) (Figure 2 B, Supplementary Tables SI and SIV). The death rate standardized by age decreased most in Israel (total EAPC = –5.35; male EAPC = –5.87, female EAPC = –5.18) and increased most in Estonia (total EAPC = 10.79; female EAPC = 11.24; male EAPC = 10.08) (Supplementary Table SI and SIV). Age-standardized following mortality rates (per 100,000) for HHD in various nations in 2019 are listed in Supplementary Table SVII.
Analysis of HHD-associated DALYs worldwide
Between the years 1990 and 2019, HHD-related worldwide DALYs increased by 54% from 13,943,611.91 to 21,508,001.85 (Table III). Comparatively, DALYs standardized by age showed a decreasing tendency, with an EAPC of –1.02 (95% CI: –1.18 to –0.86) (Table III, Figure 1 C, Supplementary Figure S1 C). DALYs standardized by age decreased in both males and females from 1990 to 2019 (male EAPC = –0.91; female EAPC –1.14; Table III, Figure 1 C).
Table III
The age-standardized DALY rate of hypertensive heart disease in 1990 and 2019 and its temporal trends
Between the years 1990 and 2019, DALYs standardized by age for HHD were lower in females than in males, as demonstrated by a female-to-male ratio of 1.08 in these years (Table III). The female-to-male DALYs rate became highest in the 40–44-year age group worldwide, in the 20–24-year age group in high SDI areas, and in the 40–44-year age group in low SDI areas (Supplementary Figure S9). DALYs increased with age worldwide and throughout all SDI areas (Supplementary Figure S10).
As is listed in Supplementary Figure S1 C and Table III, the DALYs standardized by age for HHD were much upper in areas with low SDI values than in areas with low SDI values. In 2019, the highest regional DALYs standardized by age were observed in low SDI areas (523.34 per 100,000 population), followed by middle SDI areas (362.58 per 100,000 population). DALYs standardized by age increased most in high SDI areas where the EAPC was highest (0.06, 95% CI: –0.13 to 0.26) (Table III, Figure 1 C).
The EAPC in the DALYs standardized by age for HHD was optimistically consistent with the DALYs standardized by age and the SDI (Supplementary Figures S4 C and S4 F). In 2019, low SDI areas showed the highest DALYs in youngsters (15–49 years), and areas where the SDI increased from 1990 to 2019 showed upper DALYs in elderly adults (Supplementary Figures S5 E and S5 F). Annual DALYs decreased in youngsters but increased in elderly adults (Supplementary Figure S6 C).
Regionally in 2019, the highest DALYs standardized by age for HHD were observed in Central Sub-Saharan Africa (970.25 per 100,000 population), followed by Eastern Sub-Saharan Africa (696.93 per 100,000 population) and Oceania (626.28 per 100,000 population), while the lowest DALYs standardized by age were found in Australasia (38.93 per 100,000 population), followed by High-income Asia Pacific (44.03 per 100,000 population) and Western Europe (103.51 per 100,000 population) (Table III). From 1990 to 2019, DALYs standardized by age increased most in Eastern Europe (EAPC = 1.60), Central Asia (EAPC = 1.28), and High-income North America (EAPC = 1.00) and decreased most in High-income Asia Pacific (EAPC = –3.50), East Asia (EAPC = –2.68), and Central Latin America (EAPC = –2.18) (Table III, Figure 1 C).
At the level of the country, in 2019, the DALYs standardized by age for HHD were highest in Afghanistan (1374.12 per 100,000 population), followed by Central African Republic (1321.78 per 100,000 population) and Madagascar (1258.83 per 100,000 population), while the lowest DALYs standardized by age were found in Israel (27.79 per 100,000 population), followed by Norway (27.98 per 100,000 population) and Denmark (30.64 per 100,000 population) (Figure 2 C, Supplementary Tables SI and SV). From 1990 to 2019, DALYs standardized by age for HHD decreased most in Israel (total EAPC = –5.48; male EAPC = –5.78, female EAPC = –5.34) and increased most in Latvia (total EAPC = 8.98; male EAPC = 8.83, female EAPC = 9.02). (Supplementary Table SI and SV). Age allocations of mortality rate (per 100,000) for HHD in nations in 2019 are listed in Supplementary Table SVIII.
Risk factors contributing to the HHD burden
Supplementary Tables SIX and SX present the amounts of risk-attributed mortality and DALYs in 2019, together with the percentage variation in the death rate standardized by age and DALYs standardized by age for each cause. Globally, 1.16 million (95% CI: 0.86 to 1.28) deaths and 21.51 million (95% CI: 16.40 to 23.90) DALYs could attribute to HHD risk factors in 2019, in the representation of respective increases of 22% and 7% from 1990. From 1990 to 2019, the risk-attributable death rate standardized by age decreased to 15.16 per 100,000 population, while the risk-attributable DALYs standardized by age decreased to 268.19 per 100,000 population, representing respective decreases of 21% and 19%.
In the level-2 risk factors, the largest increase in risk-attributable mortality in both sexes from 1990 to 2019 was for mortality consistent with a more significant body mass index (BMI) (0.87), followed by mortality consistent with alcohol use (0.32) and high systolic blood pressure (0.22). The most significant rise in risk-attributable DALYs in both sexes from 1990 to 2019 was for DALYs consistent with a high BMI (0.70). The most significant increase in the risk-attributable death rate standardized by age from 1990 to 2019 was for mortality consistent with a high BMI (0.34) in males.
Global risk factors for the death, DALYs, percentage changes in death rate standardized by age, and percentage changes in DALYs standardized by age from 1990 to 2019 are shown in Supplementary Figures S11 and S12. Metabolic risk factors (e.g., high systolic blood pressure) were the leading causes of mortality and DALYs due to HHD in both 1990 and 2019 (Supplementary Figures S11 and S12).
Discussion
Using a comparative risk assessment framework, we systematically analyzed the most contemporary evaluations of temporal and spatial trends in the HHD prevalence and HHD-associated mortality and DALYs at the worldwide, national, and regional levels by SDI, sex, and age between the years of 1990 and 2019 using EAPCs and risk factors consistent with HHD-associated DALYs and deaths. The major findings are as follows: (a) Globally, the prevalence standardized by age of HHD increased, but the death rate standardized by age and DALYs standardized by age decreased from 1990 to 2019. (b) From 1990 to 2019, the prevalence standardized by age of HHD increased most in high-middle SDI regions. (c) Regionally, the prevalence standardized by age of HHD increased most in Andean Latin America, the Middle East, North Africa, and Western Sub-Saharan Africa. (d) The prevalence standardized by age of HHD was higher in males than in females, and the prevalence of HHD increased with age worldwide and throughout all SDI areas. (e) Passive corresponding relationships were found between the EAPC in prevalence standardized by age and the SDI. (f) Worldwide, the most significant percentage rises in risk-attributable deaths and DALYs due to HHD were consistent with a high BMI. The most significant increase in the risk-attributable death rate standardized by age for HHD was found in males with a high BMI.
Globally, factors such as aging populations, reformed access to medical services, and the development of new diagnostic tools may lead to an increase in the prevalence of HHD [14]. The number of people aged 30–79 years who are hypertensive doubled from 1990 to 2019 [15], and this may also contribute to the increasing prevalence of HHD. The prevalence of HHD may continue to increase as some of the hypertensive individuals worldwide are overlooked and may not be receiving appropriate care [16].
The burden of HHD varies greatly throughout different SDI quintiles. The prevalence standardized by age of HHD indicated the greatest rise in high-middle SDI areas. In contrast, low SDI areas showed a lower age-standardized rate. This may be a reflection of inequities in access to medical facilities and health care among areas with various SDI levels as it has been reported that the majority of the world’s hypertensive individuals will live in low- and middle-income countries (LMICs) within the next decade [17]. The prevalence of HHD in low SDI areas is likely to rise in the long run. In 2019, however, the highest death rate standardized by age and DALYs standardized by age for HHD were observed in low SDI areas where the majority of patients with HHD were diagnosed at an advanced stage because of a lack of access to medical care and affordable medication [18]. Low SDI areas thus experienced a greater HHD burden than other SDI-level areas. In addition, the best improvements were observed in middle income areas rather than higher income areas, probably due to some risk factors in developed countries have been better controlled than in middle income areas [19].
The DALYs standardized by age for HHD increased most in high SDI areas. This may be due to the availability of advanced treatment options resulting in prolonged life expectancy in high SDI areas. For the prevalence standardized by age, passive corresponding relationships were discovered between the EAPC and the SDI, indicating that high SDI countries are more likely to have a lower EAPC in the prevalence standardized by age.
In 2019, the highest regional prevalence standardized by age of HHD was found in East Asia, Oceania, and Southeast Asia [20]. The age-standardized prevalence of HHD showed the largest increase in Andean Latin America, North Africa, the Middle East, and Western Sub-Saharan Africa. Due to urbanization and lifestyle changes [21], 80% of hypertensive individuals are anticipated to live in LMICs between 2000 and 2025. This is particularly true for Africa [22]. In Africa, approximately 30% of adults are hypertensive, and among these, only 27% have an awareness of their diagnosis, just 18% are accepting therapy, and just 7% are achieving blood pressure control [23]. Easy access to primary care and anti-hypertensive drugs in developed countries has contributed to the control of hypertension and its prevalence [24]. Many anti-hypertensive drugs are unavailable or unaffordable in Africa [25, 26]. Improving the availability and affordability of anti-hypertensive drugs is crucial for controlling the prevalence of hypertension, especially in LMICs [27].
Notably, from Supplementary Table SXI, we can see that almost all of the risk factors of HHD decreased significantly in both regions during the study period; that is why East Asia and high income Asia Pacific areas showed the greatest decreases in HHD associated mortality. In 2019, the third lowest death rate standardized by age for HHD was found in Eastern Europe. This is likely related to the low age-standardized prevalence found in this region, particularly in Ukraine and Belarus. However, similar issues around access to health care and health facilities may contribute to the observed low prevalence [28, 29].
The prevalence standardized by age of HHD was lower in females than in males. Compared to females, males usually have more poorly controlled hypertension [30]. The observed differences in prevalence and blood pressure control suggest differences in behavior and exposure to risk factors between males and females. The prevalence of HHD increased with age in both females and males. Increases in DALYs and HHD-related mortality were also observed in elderly individuals. We found that HHD prevalence and HHD-associated mortality and DALYs were higher in females than in males. These findings may be attributable to the higher prevalence of hypertension and obesity observed in females [15, 31]. Females showed higher healthy life expectancy at birth than males between the years 1990 and 2019 [32].
The prevalence standardized by age, death rate standardized by age, and DALYs standardized by age for HHD increased with years worldwide and throughout all SDI areas. The annual prevalence of HHD and mortality and DALYs because of HHD decreased in youngsters and increased in elderly adults, which can be explained by the increasing population of elderly adults worldwide. As the worldwide population continues to age, the HHD burden will continue to increase, with elderly adults contributing largely to the increase in this burden [22]. The female-to-male rate of HHD prevalence, death rate standardized by age, and DALYs standardized by age became highest in the 30–34-year age group worldwide. However, regionally, these indicators peaked in the 25–29-year age group in high SDI areas and in the 40–44-year age group in low-middle SDI areas, indicating that early diagnosis of HHD in low SDI areas is inadequate.
Globally, a high BMI was the main factor of risk that contributed to the percentage change in mortality due to HHD from 1990 to 2019. Alcohol use and high systolic blood pressure were the second and third most important risk factors, respectively. There is compelling evidence that excessive body weight is a leading cause of hypertension, accounting for 65–75% of the attributable risk of essential hypertension [33]. Consumption of alcohol is an established factor of risk for HHD and is observed to be a causal factor in the growth of HHD [34]. An optimistic relationship has been observed between hypertension and HHD [6, 35]. Lifestyle modifications such as reducing weight, reducing alcohol consumption, and controlling high systolic blood pressure may thus be effective in reducing the burden of HHD [36, 37].
Interestingly, metabolic risks (e.g., high systolic blood pressure) were the main reasons for age-standardized mortality and DALYs standardized by age due to HHD in both 1990 and 2019. Behavioral risks are always third or fourth; these observations may be related to similar trends found in evaluations standardized by age and absolute for high blood pressure [6].
HHD describes a series of target organ sequelae, consisting of left ventricular hypertrophy (LVH) and systolic and diastolic dysfunction [3]. The prevalence of LVH varies depending on the means of detection. Based on electrocardiographic findings, LVH prevalence is evaluated at 3% in men and 1.5% in women, while echocardiographic findings increase this evaluation to 15–20% in both males and females. Lack of availability and access to advanced techniques such as echocardiography and magnetic resonance imaging in low SDI areas may lead to an underestimation of the prevalence of HHD in these areas [38]. Improved public awareness regarding the risk of hypertension and access to advanced detection methods should be advocated for undeveloped areas [39].
HHD represents a constellation of abnormalities that includes altered left ventricular morphology, LVH, and systolic and diastolic dysfunction [40]. However, HHD was seen as heart failure with symptoms resulting from the long-term direct effects and impacts of hypertension in the GBD [6]. Therefore, the evaluations of HHD in the GBD were lower than those in other studies [28]. Given that life anticipation and a burden of hypertension are anticipated to rise over the next decade [15, 32] HHD may be in a more important place for the prevention of cardiovascular disease [40].
The following limitations are worth noting. The GBD statistics were based on available statistics from each country; thus, statistics quality highly depends on the quantity and quality of available country statistics. Data were absent or extremely sparse for some low and low-middle SDI areas such as Africa and Latin America. Most of the statistics on the disease burden in Sub-Saharan Africa were derived by extrapolation [41]. Thus, the findings for low and low-middle SDI areas should be interpreted with caution.
Our survey has numerous strengths. We conducted a comprehensive analysis of the most contemporary evaluations of the geographic distribution of and temporal tendencies in the prevalence of HHD and mortality and DALYs due to HHD. Analyses were performed at the worldwide, national, and regional levels, with stratification by age, SDI, and sex. We also evaluated the contribution of risk factors to HHD-associated DALYs and mortality. The GBD 2019 is an unparalleled source of current statistics that is also accessible in terms of its statistics origins, results, and research methods. Its evaluations of disease burden are regularly reviewed and revised based on new statistics and reformed methods to continuously produce contemporary evaluations [8].
In general, our research provides a new perspective on the changing trend of global HHD disease burden, conducts in-depth discussions from multiple dimensions such as age, gender, and socio-economic development index, and reveals some important factors affecting these changes. Our findings are of great significance for understanding the changes in the disease burden of HHD and how to formulate effective strategies for prevention and control of HHD by changing these factors.
In conclusion, despite the remarkable progress in reducing the death rate standardized by age and the DALY rate standardized by age, the prevalence rate standardized by age increased in both males and females from 1990 to 2019 worldwide, especially in high-middle SDI areas, Andean Latin America, Western sub-Saharan Africa, the Middle East, North Africa, and nations such as Bolivia. Tactics to contain modifiable risk factors such as high BMI, alcohol use, and upper systolic blood pressure could be useful in reducing HHD-related mortality and DALYs.