Coronavirus disease 2019 (COVID-19) is a respiratory syndrome caused by a new novel coronavirus that has appeared in many countries and regions around the world since 2019 [1]. Patients exhibit non-specific symptoms such as fatigue, discomfort, fever, and dry cough in the early stages of infection, some patients might also exhibit atypical symptoms such as headache, diarrhea, nausea, and vomiting [2, 3]. Compared with other coronaviruses, COVID-19 has a lower fatality rate, but it is more infectious. Therefore, most symptoms of COVID-19 infection are mild, with good prognosis, and the proportion of critically ill patients is relatively low [4]. However, critically ill COVID-19 patients face a high mortality risk, with approximately one-third dying from the infection. Notably, 62% require mechanical ventilation, while over two-thirds have chronic comorbidities, underscoring the critical need for comorbidity management in this population [5]. In addition, critically ill patients are more likely to experience acute lung injury (ALI), leading to hypoxemia, which in turn leads to difficulty in breathing and acute respiratory distress syndrome, causing death [6, 7].
Like most other respiratory viruses, COVID-19 is mainly transmitted through respiratory secretions (such as droplets) or direct contact between humans. After the virus enters the airways, it acts on bronchial epithelial cells and alveolar epithelial cells, causing inflammation of airway and alveolar cells, but with only a small portion of cases progressing towards critical illness, leading to ALI and death [8]. Deep-seated biological processes such as lung tissue DNA damage, cell membrane lipid oxidation, cell apoptosis, protein and enzyme dysfunction have led to the necrosis of lung epithelial cells and alveolar cells, thereby inducing the occurrence of ALI [9, 10]. Therefore, exploring the deep-seated small molecule pathway caused by COVID-19 is crucial for understanding the mechanism and exploring potential small molecule prevention targets.
Based on data analysis of COVID-19 infected lung samples and ALI lung tissue samples, this study identified overlapping genes that cause both diseases and explored their roles in the occurrence and progression of the two diseases.
Methods
MCODE algorithm for screening hub genes
The protein-protein interaction (PPI) network is composed of individual proteins interacting with each other. The STRING database stores the key interactions between known proteins. In this study, we searched the database to construct a PPI network by using Co-DEGs, with a minimum interaction score of 0.900. The tightly connected local regions in the PPI network might represent molecular complexes with specific biological functions. The molecular complex detection (MCODE) plug-in for Cytoscape (Version: 3.9.1) [11] was introduced to find the key gene clusters according to the relationship between edges and nodes in the network. We selected the genes with highest scores in the plug-in as hub genes and visualized the PPI network of them.
GO and KEGG
The Gene Ontology (GO) itemizes the behavior of gene sequences and connects them to form a tree structure. The Kyoto Encyclopedia of Genes and Genomes (KEGG) [12] stores information about specific pathways.
Gene set enrichment analysis (GSEA)
The GSEA is used to determine the contribution of a pre-defined gene set to a specific phenotype by evaluating the distribution trend of the genes.
MRNA-miRNA and mRNA-RBP prediction networks
The ENCORI database [13] retained miRNA and RNA binding protein (RBP) targets for mRNAs. We searched the database for the key genes and use Cytoscape to draw the mRNA-miRNA and -RBP interaction network.
Statistical analysis
All the analyses were completed under the R software (version 4.2.1) environment. Wilcoxon Rank Sum Test was performed between two groups using the “ggpubr” package. The Pearson correlation analysis was to test between two sets of parameters. Significance was defined as FDR q < 0.25 using Benjamini-Hochberg correction. All results were based on p-value < 0.05 as the standard for significant results.
Results
The workflow of analyses
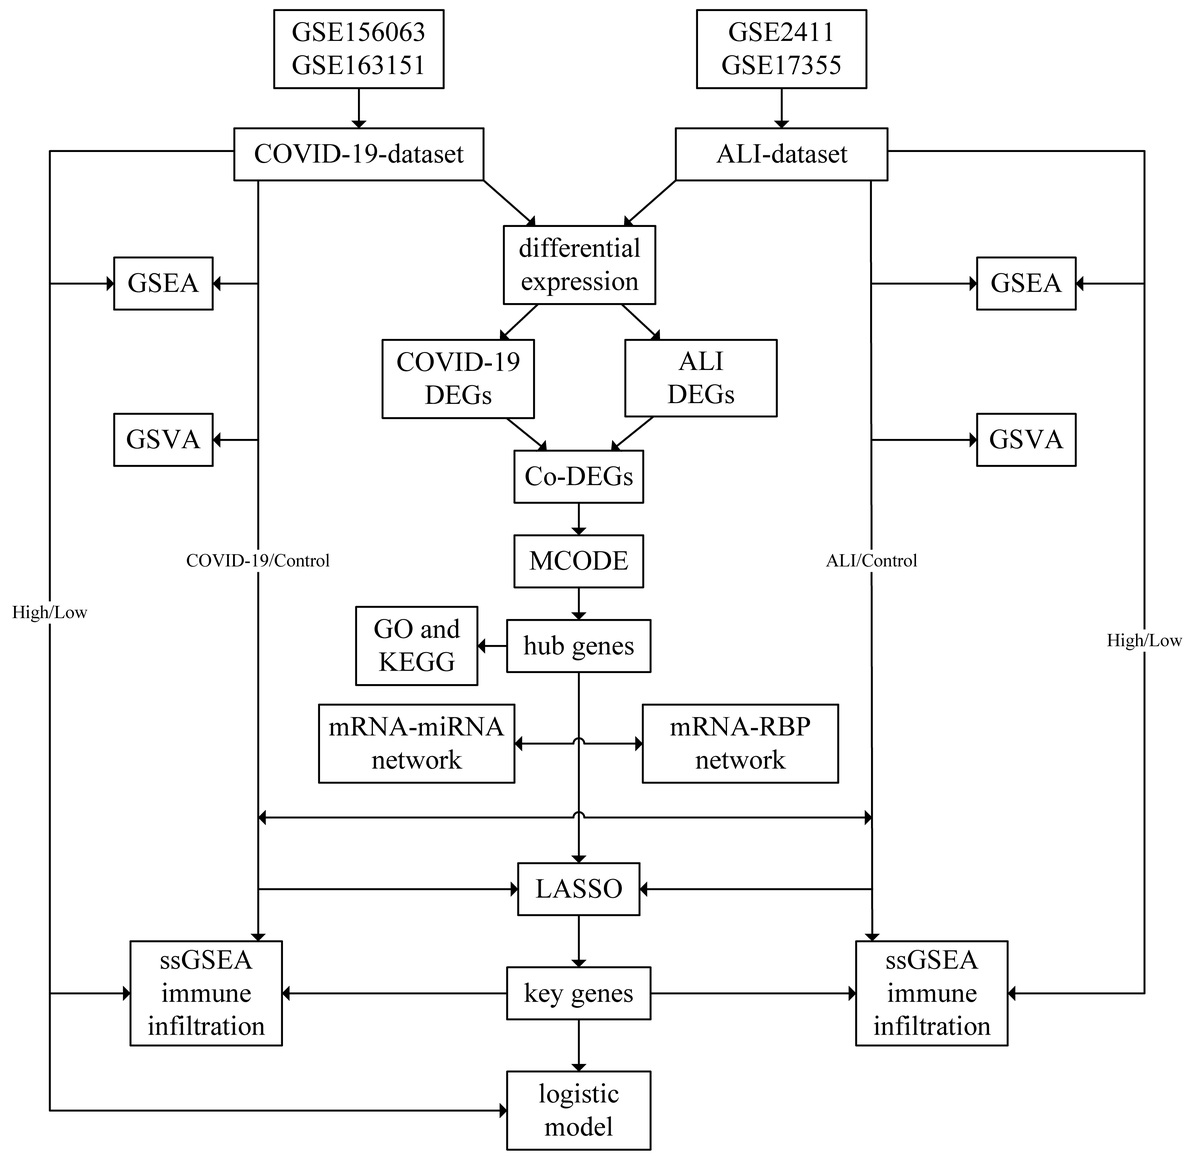
First, the batch effects were removed from datasets, which were then merged to obtain the combined COVID-19 dataset and ALI dataset. Next, differential expression analyses were conducted and Co-DEGs were determined. The PPI network of the Co-DEGs and hub genes were obtained through MCODE plug-in. The GO and KEGG annotations were conducted and key genes were identified through LASSO algorithm. The process was depicted in a flow chart (Supplementary Figure S1).
Co-DEGs in the COVID-19 and ALI datasets
The results of the differential analysis identified a total of 14722 DEGs in the COVID-19 dataset, of which 4131 genes met the threshold (Supplementary Figure S2 A). We conducted mouse-human ID conversion on the ALI dataset and conducted differential analysis, finding a total of 5551 DEGs, of which 809 genes met the threshold (Supplementary Figure S2 B). We intersected the two sets of DEGs and plotted a Venn plot (Supplementary Figure S2 C). The results showed that there were 254 Co-DEGs between COVID-19 and ALI, and the specific gene names were shown (Supplementary Table SII). Next, we selected 40 Co-DEGs with positive and negative top 20 logFC rankings in their respective datasets and plotted heatmaps of their expression levels for display (Supplementary Figures S2 D, E).
MCODE algorithm for hub genes
Then, we obtained the information about the interaction relationship of the 254 Co-DEGs in the STRING database and used the parameters (Node Score Cutoff = 0.2, K-Core = 2, Max. Depth = 100) in the MCODE plug-in of Cytoscape to cluster and predict the core gene cluster of the interaction network (Supplementary Figure S3 A). A total of 15 genes (CFTR, IFIT2, IFIT3, IFITM3, IRF7, ISG20, OAS2, OAS3, OASL, OAZ2, PSMB10, PSMB8, PSMC4, PSMD12, STAT2) from two highest scoring gene clusters (yellow with score 9.556, green with score 4.500) were selected as hub genes. Subsequently, we conducted chromosomal mapping analysis on these 15 hub genes to observe the distribution of these genes. The chromosome mapping (Supplementary Figure S3 B) showed that these genes are mainly distributed on chromosomes 10, 11, 12, and 15, and genes on the same chromosome may have functional connections. We used functional similarity analysis to evaluate the level of functional similarity between hub genes and displayed the results in a box graph (Supplementary Figure S3 C), which showed that the gene with the highest functional similarity score is OASL.
GO and KEGG
We drew group comparison charts for the expression levels of these 15 hub genes in the COVID-19 dataset and the ALI dataset (Supplementary Figures S4 A, B), which showed a consistent trend of expression levels. Next, we conducted GO gene enrichment analysis (Supplementary Table SIII) on these 15 hub genes, which showed that 15 hub genes were mainly enriched in biological processes (BP) such as positive regulation of protein transport (GO: 0051222), membrane hyperpolarization (GO: 0060081), regulation of chloride transport (GO: 001225), and cellular components (CC) as protein complex (GO: 000502) and protein regulatory particle (GO: 0005838), early endosome component (GO: 0031901), as well as molecular functions (MF) such as chloride channel inhibitor activity (GO: 0019869), chloride channel regulator activity (GO: 0017081), and ATP hydrolysis activity (GO: 0016887) in the datasets. Next, KEGG enrichment analysis (Supplementary Table SIII) showed that 15 hub genes were significantly enriched in 11 pathways such as Coronavirus disease (hsa05171) (Supplementary Figure S4 C). We also presented the results in the form of a circular network diagram (Supplementary Figure S4 D). Next, we selected the pathway (hsa05171) to draw a pathway diagram for display (Supplementary Figure S4 E).
GSEA (disease/control group)
The results of GSEA showed that genes in the COVID-19 dataset and ALI dataset were significantly enriched in pathways such as MAPK (Supplementary Figures S5 B, G), PID NOTCH (Supplementary Figures S5 C, H), WNT (Supplementary Figures S5 D, I), and HIPPO (Supplementary Figures S5 E, J) (Supplementary Tables SIV, SV) signaling pathways (Supplementary Figures S5 A–E). The mountain map was plotted in the COVID-19 dataset (Supplementary Figure S5 A) and in ALI dataset (Supplementary Figure S5 F).
GSVA
We subsequently performed GSVA on the expression of all genes in the COVID-19 dataset (Supplementary Table SVI), the result of which showed that 13 hallmark gene sets between the disease and the control groups (p-value < 0.05, Supplementary Figures S6 A, B). We also identified 28 hallmark gene sets in the ALI dataset (p-value < 0.05, Supplementary Table SVII, Supplementary Figures S7 A, B).
ssGSEA immune infiltration between the disease and the control group
We used the ssGSEA algorithm to calculate the ssGSEA enrichment scores in the samples of both datasets. A group comparison graph was to display the differences in the COVID-19 dataset (Supplementary Figure S8 A), including 12 types of immune cells with statistically significant differences (p < 0.05). The heatmaps showed the correlations between ssGSEA enrichment scores (Supplementary Figure S8 B), ssGSEA enrichment scores and 15 hub genes (Supplementary Figure S8 C), which showed that nearly all immune cells showed a significant positive linear correlation (r > 0, p < 0.05) between each other except for the CD56dim natural killer cell. Genes (IFIT3, IFITM3, OAS3, IFIT2, OASL, ISG20, IRF7, OAZ2) showed a significant positive linear correlation with these immune cells (r > 0), whereas (PSMD12, PSMC4) showed negative correlations (r < 0). The ssGSEA enrichment scores were also shown in a complex heatmap (Supplementary Figure S8 D).
We also used the ssGSEA algorithm to calculate the ssGSEA enrichment scores for the ALI dataset (Supplementary Figure S9 A), which showed 16 types of immune cells with significant differences (p < 0.05). The heatmaps showed the correlations between ssGSEA enrichment scores (Supplementary Figure S9 B), ssGSEA enrichment scores and 15 hub genes (Supplementary Figure S9 C), which showed that nearly all immune cells showed a significant negative linear correlation (r < 0, p < 0.05) between each other except for the activated B cells and Type 17 T helper cells. The hub genes mainly showed a significant positive linear correlation (r > 0) with immune cells. The ssGSEA enrichment scores were also shown in a complex heatmap (Supplementary Figure S9 D).
LASSO diagnostic model and logistic model
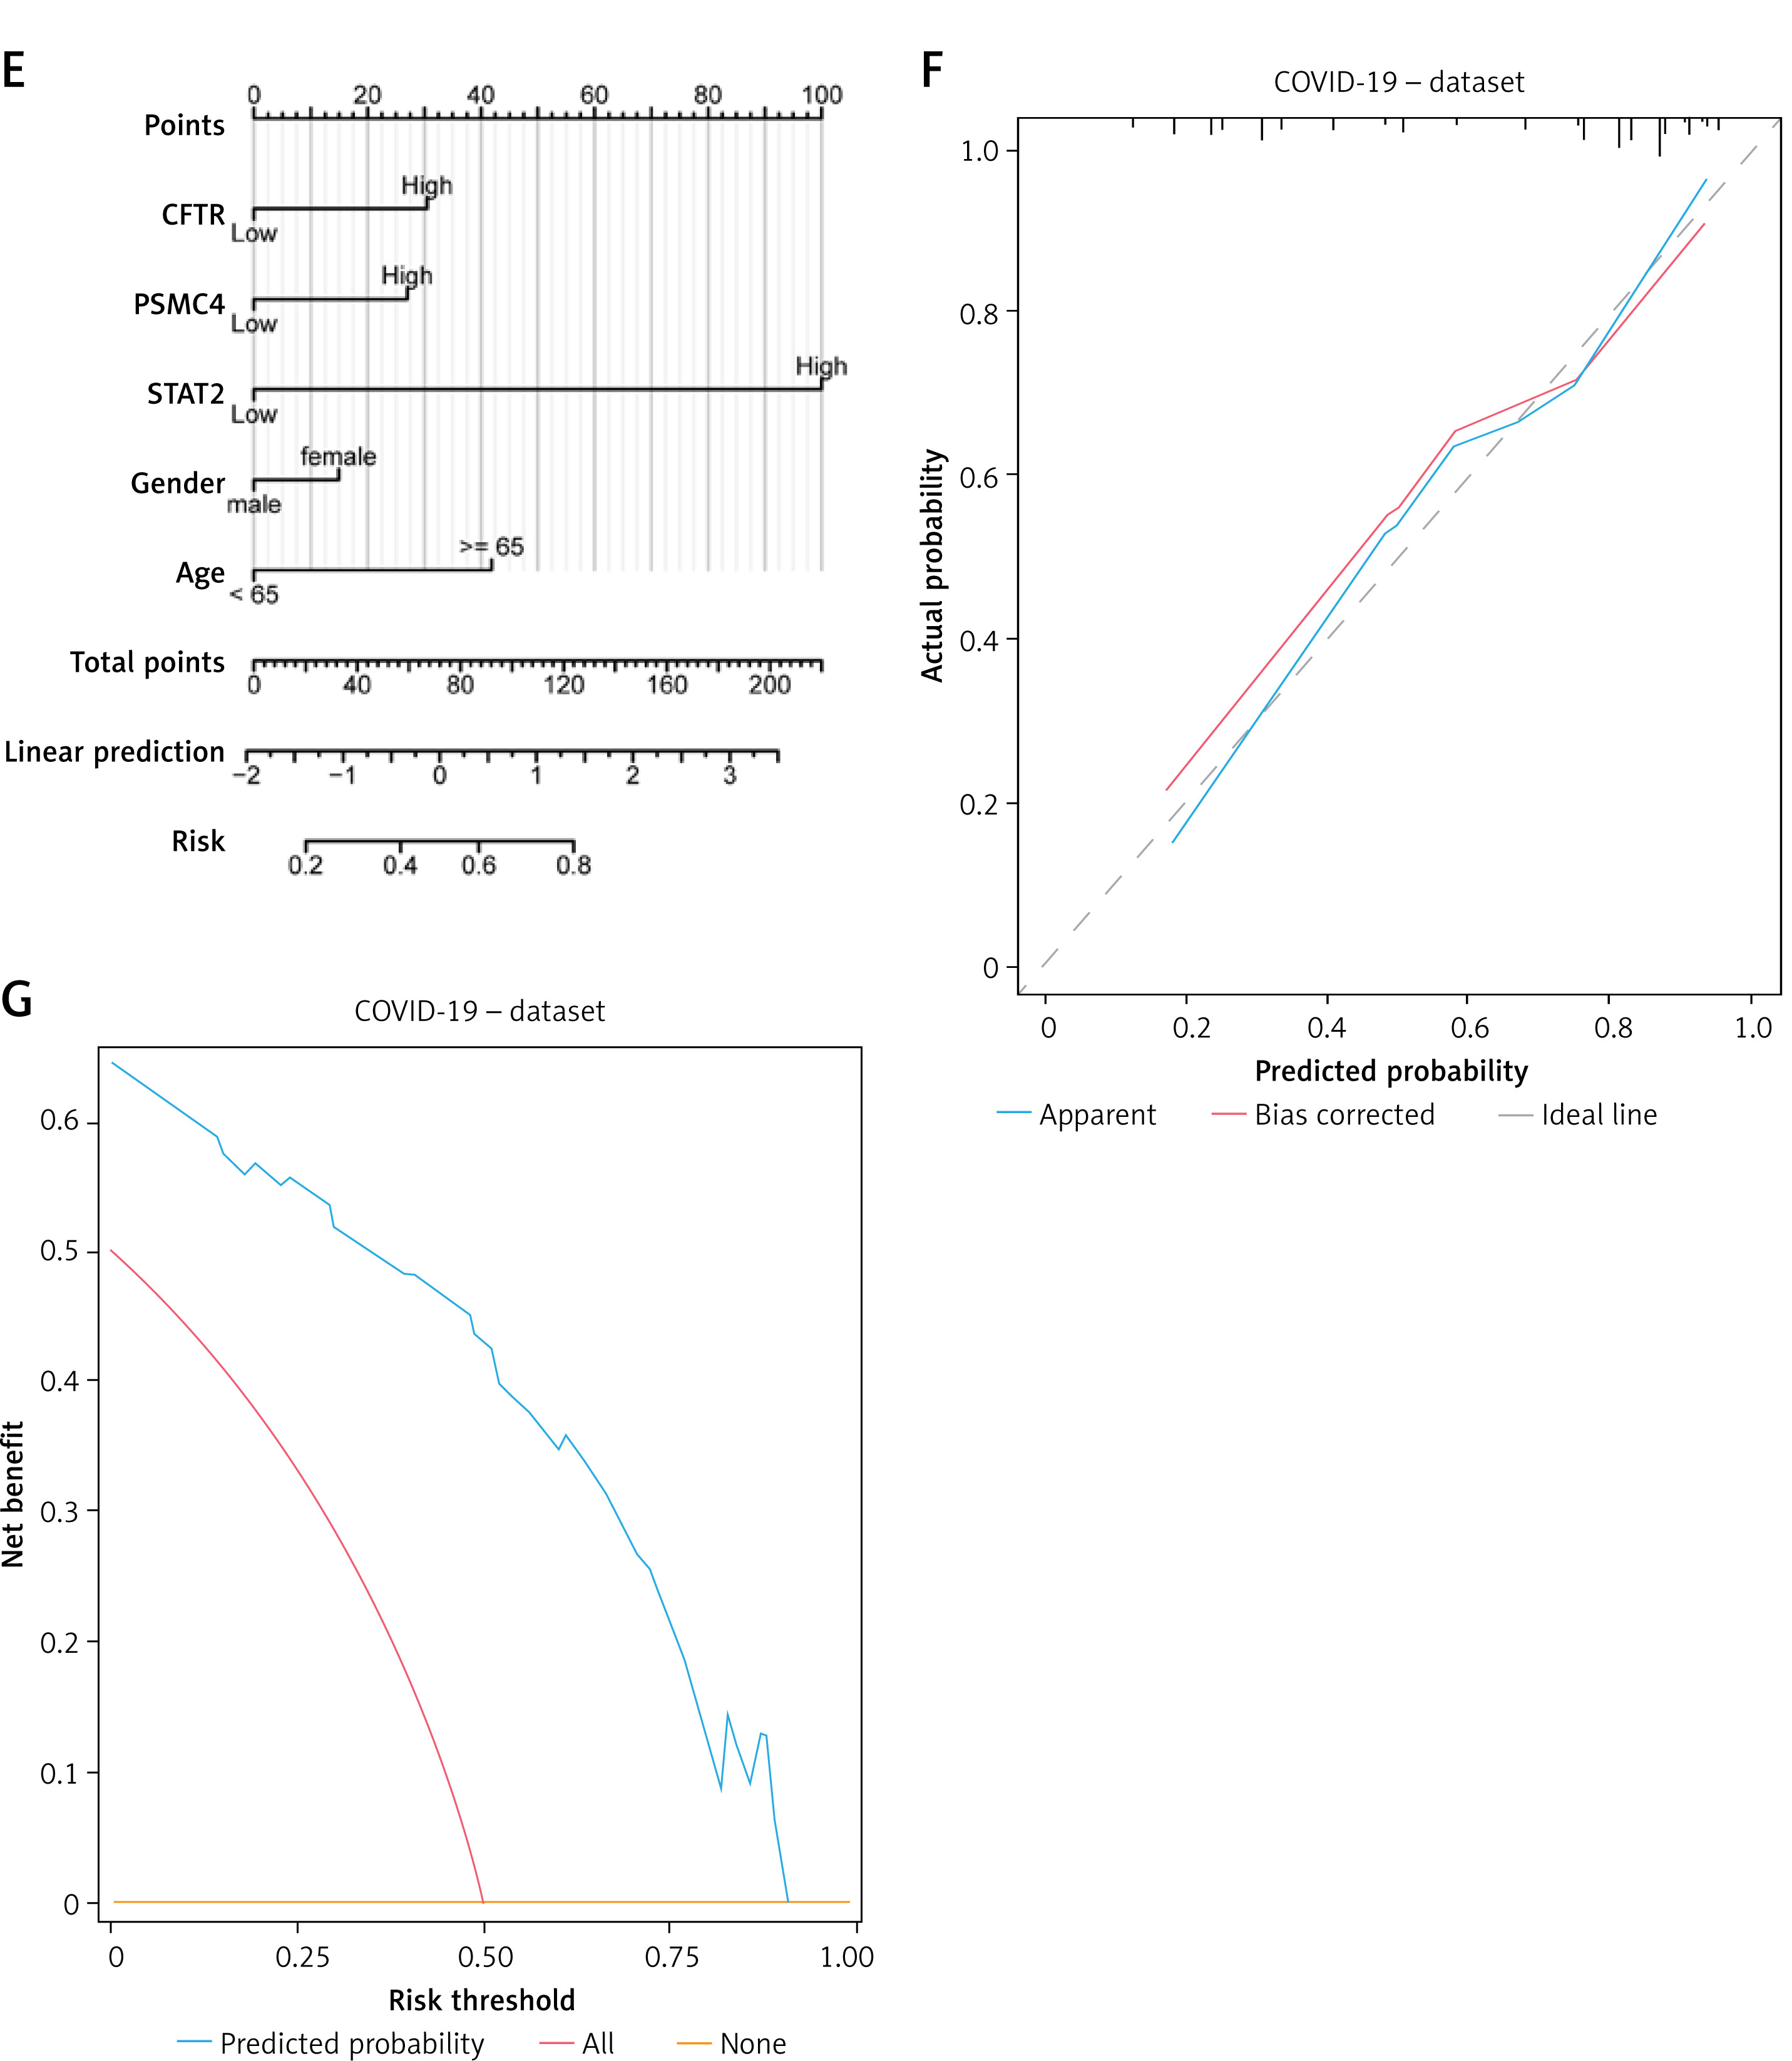
To determine the diagnostic value of 15 hub genes in the COVID-19 dataset, we used LASSO regression analysis based on gene expression to construct a diagnostic model (Figure 1 A), which selected 12 genes in the model (CFTR, IFIT3, IFITM3, IRF7, ISG20, OAS2, OASL, OAZ2, PSMB8, PSMC4, PSMD12, STAT2). We also visualized the LASSO results and obtained the LASSO variable trajectory map (Figure 1 B). Then, after excluding the control group samples from the COVID-19 dataset, we divided the disease samples into high-score and low-score groups based on the median risk score of the COVID-19 group samples in the model. Similarly, we also used 15 hub genes to construct a LASSO diagnostic model in the ALI dataset (Figure 1 C), which selected 4 genes (CFTR, OAS3, PSMC4, STAT2) (Figure 1 D). Next, we intersected the two sets of feature genes and obtained 3 feature genes (CFTR, PSMC4, STAT2), which were the key genes of this study. Subsequently, we constructed a logistic model using these three key genes and clinical variables (gender, age) in the COVID-19 dataset and screened variables with a p-value < 0.10 as the standard, and ultimately included all input variables to construct a multivariate logistic model. We plotted the diagnostic nomogram (Figure 1 E), diagnostic calibration curve (Figure 1 F), and DCA chart (Figure 1 G). As shown in the figure, the red line is closer to the gray line, representing the ideal curve, indicating that the model fits well. The blue line representing the model in the DCA diagram is relatively far away from the red line representing all and the blue line representing none, indicating that the diagnostic utility of the model is good.
Figure 1
LASSO and logistic diagnostic model. A – The LASSO regression diagnostic model diagram of hub genes in the COVID-19 dataset. B – Variable trajectories of the COVID-19 dataset. C – The LASSO regression diagnostic model diagram of hub genes in the ALI dataset. D – Variable trajectories of the ALI dataset. E – The nomogram of the multivariate logistic model in the COVID-19 dataset. The diagnostic calibration curve (F) and DCA diagram (G) were presented
DCA – decision curve analysis, LASSO – least absolute shrinkage and selection operator, ALI – acute lung injury.
GSEA analysis (high-score group/low-score group)
We conducted GSEA between high-score and low-score groups of both the datasets, respectively. The results showed that genes between the two score groups were significantly enriched in pathways of JAK STAT (Supplementary Figures 10 B, G), BIOCARTA NFKB (Supplementary Figures S10 C, H), MAPK FAMILY (Supplementary Figures S10 D, I), and HIPPOYAP (Supplementary Figures S10 E, J) (Supplementary Table SVIII, IX) in both the datasets. We plotted the mountain maps of enriched pathways in the datasets (Supplementary Figures S10 A, F).
ssGSEA immune infiltration between high-score and low-score groups
We used the ssGSEA algorithm to calculate the 28 ssGSEA enrichment scores in the samples of the COVID-19 dataset and displayed it with a group comparison graph (Supplementary Figure S11 A). A total of 17 types of immune cells showed differences in infiltration between the two groups (p < 0.05). The correlation heatmaps (Supplementary Figures S11 B, C) showed a significant positive linear correlation between immune cells (r > 0, p < 0.05), while the key genes showed partial correlation with immune cells (Supplementary Figure S11 C). We plotted a complex heatmap (Supplementary Figure S11 D) to show the in the dataset.
28 ssGSEA enrichment scores
We also used the ssGSEA algorithm to calculate the 28 ssGSEA enrichment scores in the samples of the ALI dataset and displayed it with a group comparison graph (Supplementary Figure S12 A). A total of 9 types of immune cells showed differences in infiltration between the two groups (p < 0.05). The correlation heatmaps (Supplementary Figures S12 B, C) showed a significant positive linear correlation between immune cells (r > 0, p < 0.05), while the key genes showed partial correlation with immune cells (Supplementary Figure S12 C). We plotted a complex heatmap (Supplementary Figure S12 D) to show the 28 immune cells enrichment scores in the dataset.
Discussion
COVID-19, a positive-sense single-stranded RNA betacoronavirus, possesses characteristic club-shaped spike (S) glycoproteins that extend radially from its virion surface. Its broad host tropism and capacity to induce a spectrum of COVID-19-associated pathologies establish it as a clinically complex pathogen [14, 15]. Nevertheless, the mechanistic relationship between COVID-19 infection and the development of ALI remains incompletely elucidated and warrants further investigation.
Among these genes, OAS2 has the highest similarity with other genes, and chromosome position analysis shows that OASL, OAS2, OAS3, and STAT2 are all located in chromosome 2. OASL/OAS2/OAS3 encode the 2’-5’ oligoadenylate synthetases (OASs) and are the essential protein involved in the innate immune response to viral infection. Melchjorsen et al.’s study [15] revealed that after viral infection, interferon (IFN) regulatory factors will actively induce the transcription of OAL family genes, causing their specific expression to regulate the production of 2-5A synthase, thereby responding to viral infection. This reaction is equally effective during COVID-19 infection. STAT2 encodes a member of the STAT protein family and is also affected by IFN regulators. The specific expression of STAT2 in COVID-19 is not the first to be discovered.
However, the differential expression of ISG20 in COVID-19 and ALI was discovered for the first time in our study.
The conserved dysregulation of 15 hub genes establishes a pathogenic nexus between COVID-19 and ALI through two complementary mechanisms: GO analysis demonstrates their coordinated orchestration of chloride transport and epithelial membrane polarization, critical processes maintaining air-blood barrier integrity, where functional disruption directly licenses alveolar flooding pathology, while KEGG/GSEA evidence confirms these genes concurrently hijack viral response pathways (COVID-19 map) and dysregulate developmental signaling axes (MAPK, NOTCH, WNT, Hippo). This dual-pathway exploitation generates a self-reinforcing injury circuit that amplifies lung damage through three pathologic sequelae: (1) ion gradient collapse triggering osmotic edema, (2) progenitor cell differentiation failure impairing tissue regeneration, and (3) feedforward cytokine signaling accelerating immune-mediated destruction. Cusato et al. [16] found that COVID-19 could produce a large number of proinflammatory cytokines through the mitogen activated protein kinase (MAPK) pathway, leading to uncontrolled validation response. COVID-19 could also induce apoptosis of bronchial epithelial cells and alveolar cells by interfering with cellular cascade reactions (AKI, PID NORCH, WNT, HIPPO), leading to ALI, respiratory distress, and death.
In conclusion, 15 Co-DEGs between COVID-19 and ALI were obtained, and the shared dysregulation genes are consistent with molecular progression toward ALI pathology. The enrichment pathway analysis of differential genes showed that MAPK, PID NOTCH, WNT, HIPPO, HYPOXIA, TGF_BETA, PI3K_AKT and other pathways coexist in both COVID-19 and ALI, making them key pathways for ALI progression and potential blocking targets. Co-DEGs also play an important role in the changes in the immune microenvironment. We carried out feature selection for 15 Co-DEGs and obtained three key genes CFTR, PSMC4 and STAT2. Using these three genes, we constructed a clinical prediction model, which is of great practical significance for predicting the disease trend of COVID-19 and taking timely response measures, in case of ALI happening.