Rheumatoid arthritis (RA) is a chronic systemic autoimmune disease characterized by persistent synovitis, progressive joint destruction, and substantial disability, contributing significantly to global morbidity and healthcare burden [1]. Among environmental exposures, cigarette smoking is the most consistently identified modifiable risk factor for RA, with strong epidemiological and biological evidence supporting its role in disease initiation and progression [2–4].
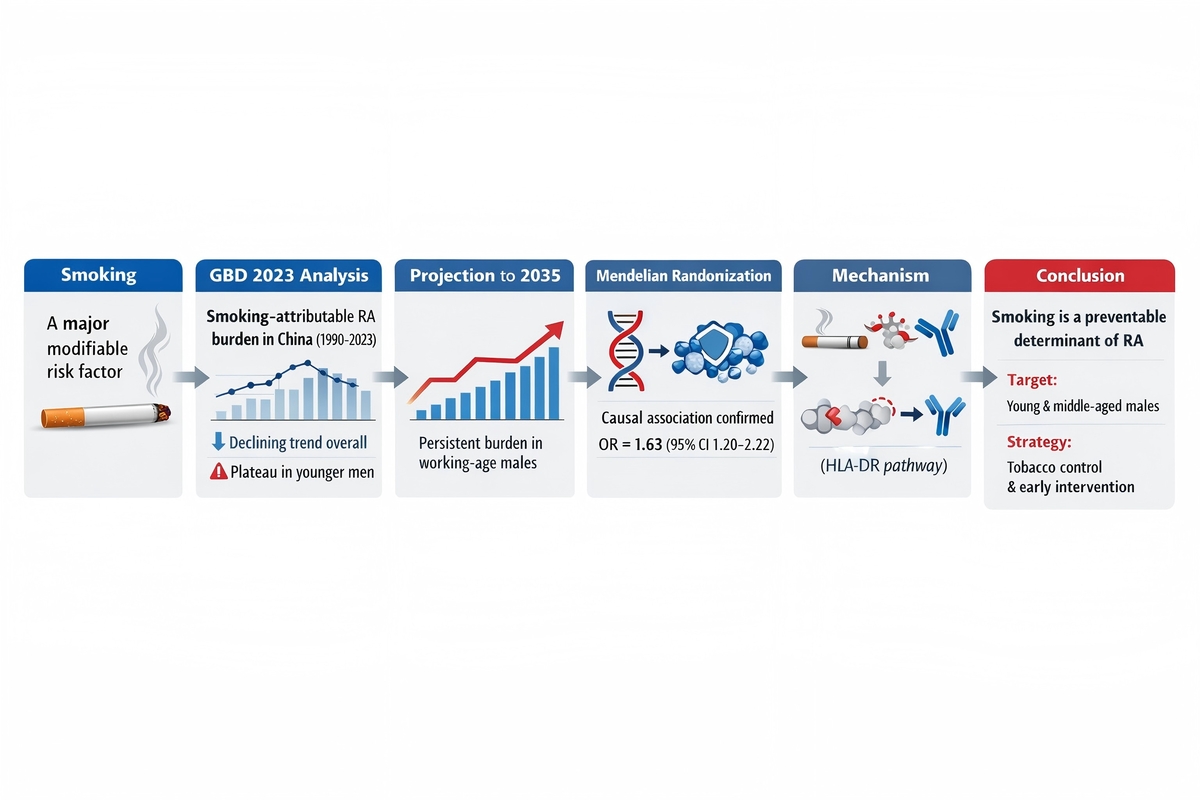
To address gaps in the current evidence, we applied a triangulation framework integrating population-level burden estimation based on Global Burden of Disease (GBD 2023) data, Bayesian age–period–cohort forecasting, and Mendelian randomization (MR) analysis to strengthen causal inference.
For the burden component, we extracted smoking-attributable RA deaths and disability-adjusted life years (DALYs) for China from the Global Burden of Disease (GBD 2023) Results tool [5]. These findings are consistent with previous Global Burden of Disease analyses of rheumatoid arthritis [6].
Methods
In GBD, smoking exposure (typically incorporating current and former smoking) is linked to outcomes through risk-outcome functions, and smoking-attributable burden is quantified using population-attributable fractions applied to deaths and DALYs. GBD provides internally consistent estimates across years by integrating multiple data sources and modelling approaches, and reports uncertainty intervals. We summarized absolute counts and rates and assessed temporal trends using estimated annual percentage changes (EAPCs), derived from log-linear regression of rates on calendar year. Age-standardized rates were interpreted using the GBD standard population to facilitate temporal comparison.
To inform near-term planning, we projected smoking-attributable RA burden from 2023 to 2035 using a Bayesian age–period–cohort framework, which smooths historical age-specific patterns and produces probabilistic forecasts by jointly modelling age, period, and cohort effects. Forecasting is especially relevant for RA because disability accumulates over time and health-system demand is driven by both incident disease and long-term morbidity.
For causal inference, we applied two-sample MR using summary statistics from genome-wide association studies (GWAS), using established Mendelian randomization analytical frameworks [7, 8]. Genetic variants robustly associated with smoking-related traits at genome-wide significance were selected as instrumental variables, pruned for linkage disequilibrium, and harmonized with RA GWAS summary data to ensure aligned effect alleles. Primary causal estimates were obtained with inverse-variance weighted MR, complemented by sensitivity analyses (e.g., MR-Egger and median-based estimators) to probe robustness under different pleiotropy assumptions. This triangulation approach strengthens inference when multiple methods converge on a consistent signal.
Results
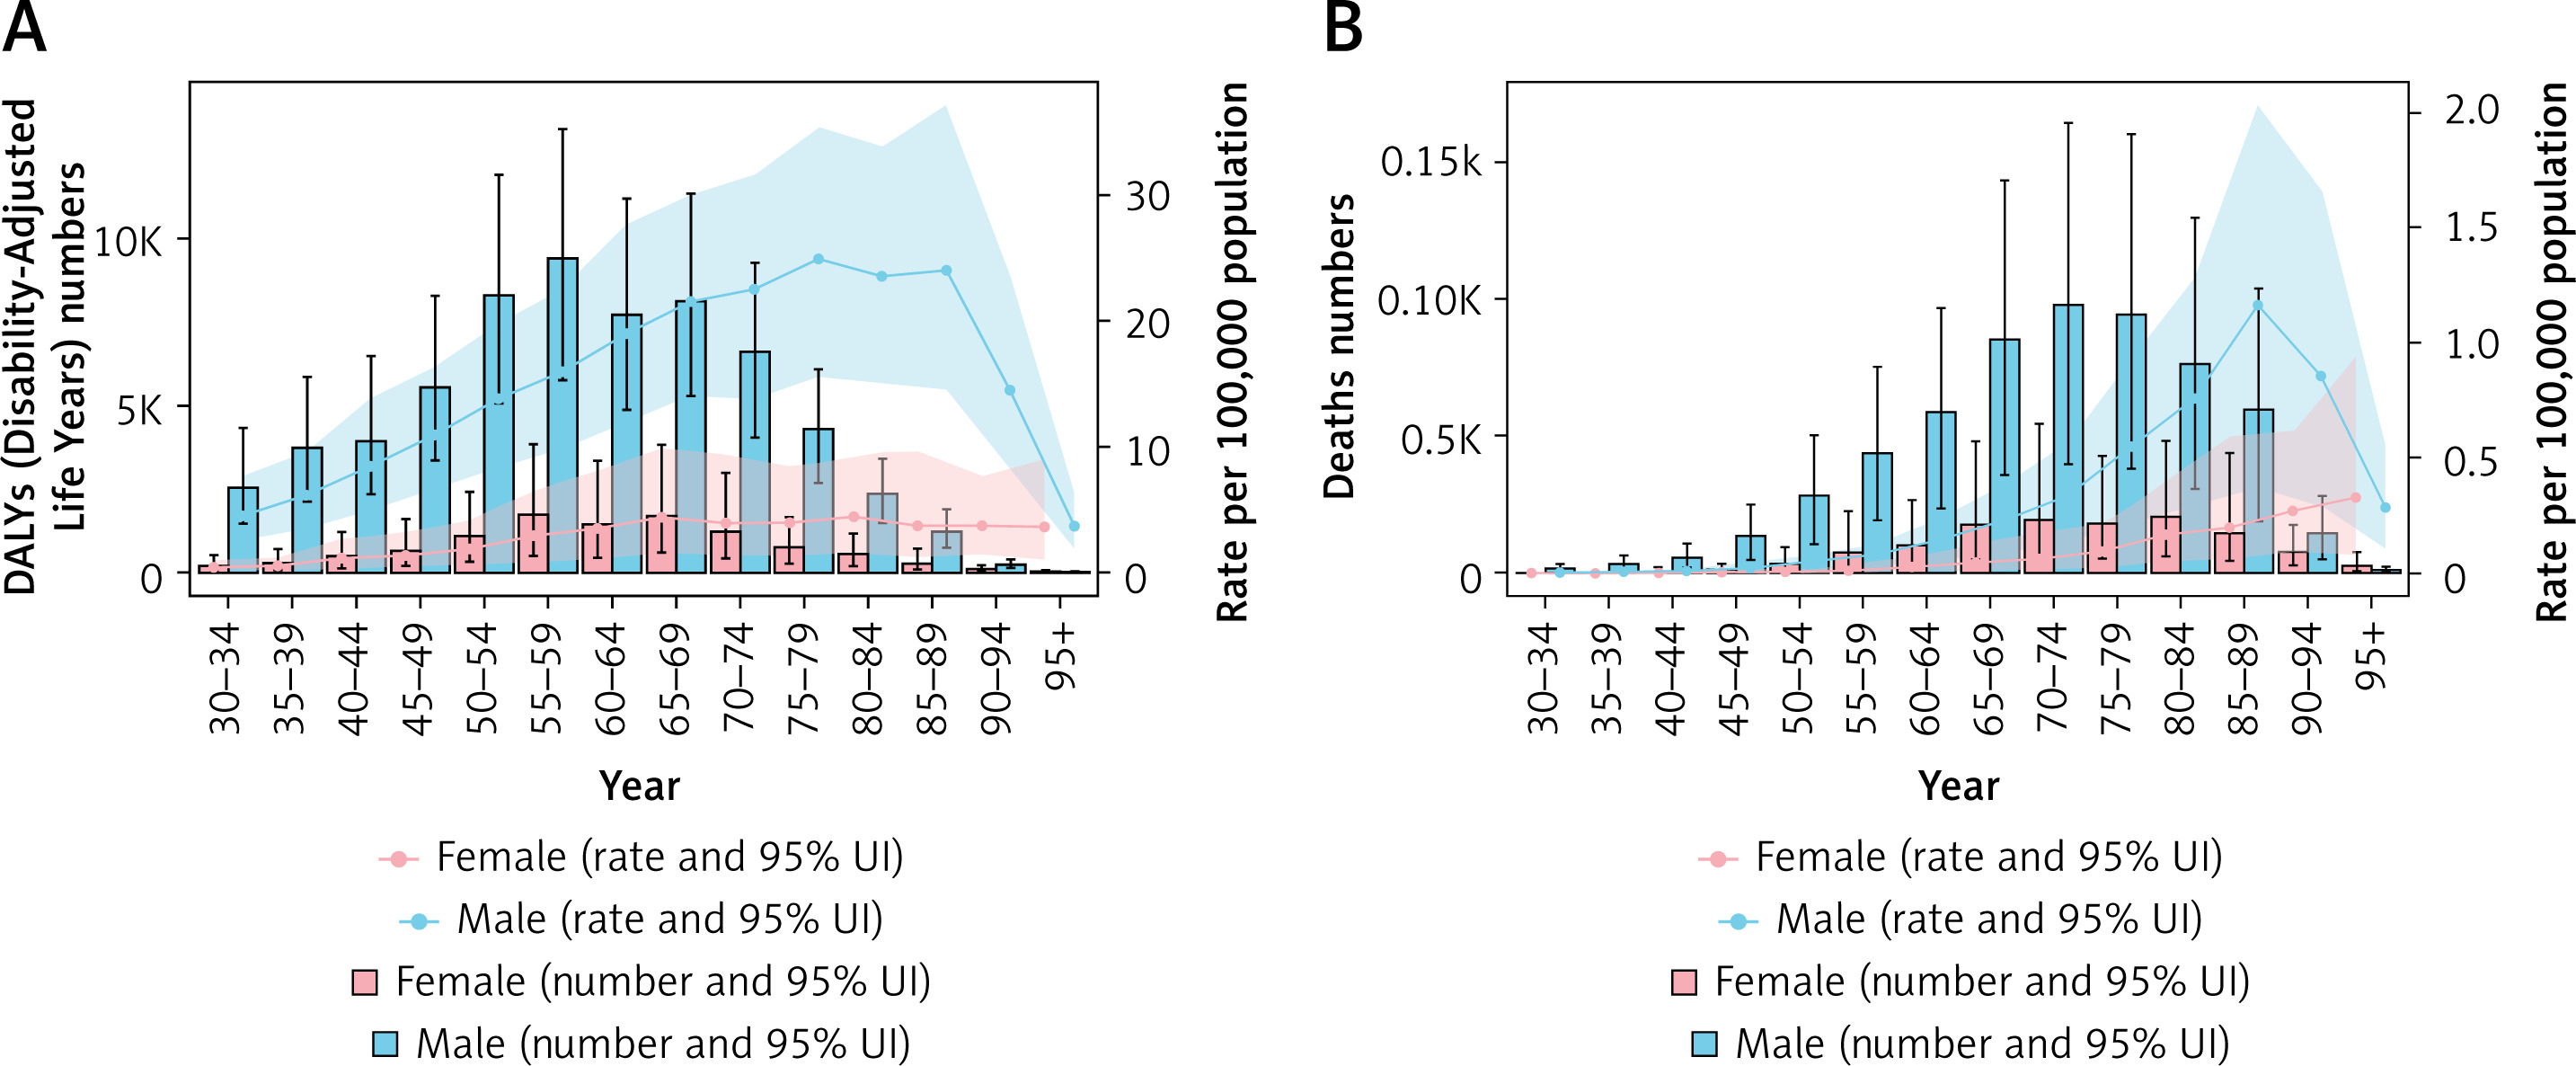
Over the past three decades, smoking-attributable RA burden in China decreased substantially at the population level. For the total population (both sexes, all ages), the DALY rate declined rapidly (EAPC –3.75% [95% CI: –3.89 to –3.62]). In older women (aged 80 years and older), the smoking-attributable DALY rate also decreased (EAPC –2.11% [95% CI: –2.20 to –2.01]). However, the age-sex pattern remained heterogeneous: in 2023, male age-specific DALY rates followed an inverted U-shaped curve, rising to a peak of 22.54 per 100,000 before declining in the oldest age groups. Notably, younger men did not mirror the overall decline; in males aged 30–34 years, the DALY rate increased modestly over time (EAPC 0.09% [95% CI: 0.06 to 0.12]). These findings imply that while tobacco control and cohort effects may have reduced smoking-attributable RA burden overall, prevention gains may be uneven across age-sex strata, with a persistent (and in some strata rising) burden among men in early and mid-adulthood.
Projections to 2035 suggested that smoking-attributable RA burden will remain a relevant challenge in the near term, particularly for men of working age, even if population-level rates continue to improve. From a public health perspective, this supports the integration of RA prevention into broader tobacco control and chronic disease strategies, including cessation services that are accessible to high-prevalence populations.
At the clinical level, systematic assessment of smoking status in rheumatology and primary care, brief cessation counselling, and referral to structured cessation programs can be positioned as part of RA risk management. For individuals with strong family history or high-risk serological profiles, smoking cessation may be particularly important, because smoking has been linked to pathways driving seropositive disease. Embedding cessation pathways into routine chronic disease management may therefore yield downstream benefits by reducing both RA incidence and long-term disability, especially in populations with persistently high smoking prevalence.
MR analyses provided convergent evidence supporting a causal role of smoking propensity in RA. Genetically predicted smoking exposure was associated with higher RA risk (OR = 1.63, 95% CI: 1.20–2.22). Sensitivity analyses did not indicate substantial directional pleiotropy, and the direction and magnitude were coherent across complementary estimators. These results align with dose-response meta-analyses of observational studies and support the interpretation that smoking is not merely a correlate of RA risk, but a causal contributor [9–11] (Tables I, II, Figure 1, Supplementary Tables SI–SIV).
Table I
Age-specific rates (per 100,000) and Estimated annual percentage changes (EAPC) for DALYs and deaths due to rheumatoid arthritis attributable to smoking in China, 1990–2023
Table II
Top 10 potential small molecules associated with core targets identified by DSigDB enrichment analysis
Discussion
From a mechanistic perspective, the integrated evidence is biologically plausible. Smoking has been linked to mucosal immune activation and protein citrullination, and the latter may trigger HLA-DR (shared epitope)-restricted immune responses to modified autoantigens [12]. Such pathways provide a coherent link between exposure and seropositive RA and suggest that prevention and cessation could have downstream benefits for autoimmunity trajectories.
This study has several limitations. First, GBD estimates are model-based and depend on data availability and modelling assumptions, which may introduce uncertainty and potential bias. Second, ecological burden analyses cannot establish causality at the individual level. Third, Mendelian randomization relies on key instrumental variable assumptions, and although sensitivity analyses were performed, residual pleiotropy cannot be entirely excluded. Finally, projection results are based on historical trends and do not account for potential future changes in smoking behavior, healthcare interventions, or policy implementation. Therefore, the findings should be interpreted with caution.
In conclusion, by integrating GBD 2023 burden estimates, Bayesian forecasting, and MR-based causal inference, we provide policy-relevant evidence that smoking remains an actionable determinant of RA in China. Our findings support strengthening comprehensive tobacco control while emphasizing targeted implementation among younger and working-age men, where the smoking-attributable RA burden may be least improved. Such strategies could complement clinical prevention efforts and contribute to reducing long-term disability and healthcare burden attributable to RA.