Introduction
Diabetic nephropathy (DN) is a microvascular complication of diabetes mellitus. DN may progress to chronic kidney disease (CKD) and is a major cause of end-stage kidney disease [1]. Diabetic kidney disease is a distinct clinical-pathologic entity clinically presenting as microalbuminuria or macroalbuminuria, increased arterial blood pressure, and a distinct morphologic pattern of injury on renal biopsy [1]. Approximately 20–40% of patients with diabetes develop diabetic kidney disease [2]. The risk factors for diabetic kidney disease include genetic factors, smoking, duration of diabetes, early onset of diabetes, poor glycemic control, obesity, hypertension, proteinuria, dyslipidemia, and older age [1].
Sleep is a complex, active state of unconsciousness produced by the body, during which the brain is in a relative state of rest and is reactive primarily to internal stimuli. The exact purpose of sleep has not been fully elucidated, but theories attempting to identify why we sleep have been proposed: the inactivity theory, the energy conservation theory, the restoration theory, and the brain plasticity theory [3]. The impact of DN on sleep quality is fairly well documented [4]; however, whether sleep can influence the occurrence of DN remains poorly understood, although accumulating evidence suggests that obstructive sleep apnea (OSA) could be a risk factor for DN or be associated with DN [5]. Indeed, a parallel increase in the prevalence of OSA, type 2 diabetes mellitus, and DN has been observed in India and China [6]. Short or long sleep duration [7] and OSA [6] have been associated with DN, but whether genetically predicted sleep parameters are associated with a genetic predisposition to DN remains to be determined. Furthermore, treating OSA with continuous positive airway pressure does not improve DN parameters [8].
Data on millions of single-nucleotide polymorphisms (SNPs) and their related phenotypes have been provided in recent decades by genome-wide association studies (GWASs), revolutionizing the field of genetics and medicine, especially for complex traits and diseases [9]. The Mendelian randomization (MR) methodology uses common genetic variants as instrumental variables for various environmental exposures. It allows the exploration of possible causal associations between these exposures and outcomes. Two-sample MR uses the associations between SNPs and exposure and between SNPs and outcomes from different GWASs to combine them into a single analysis to estimate causality. Under key assumptions, MR reduces the impact of reverse causation and confounding that often substantially impede or mislead the interpretation of epidemiological studies [9].
Therefore, this study aimed to explore the causal association between genetically predicted sleep traits and DN using the MR methodology.
Material and methods
Study design
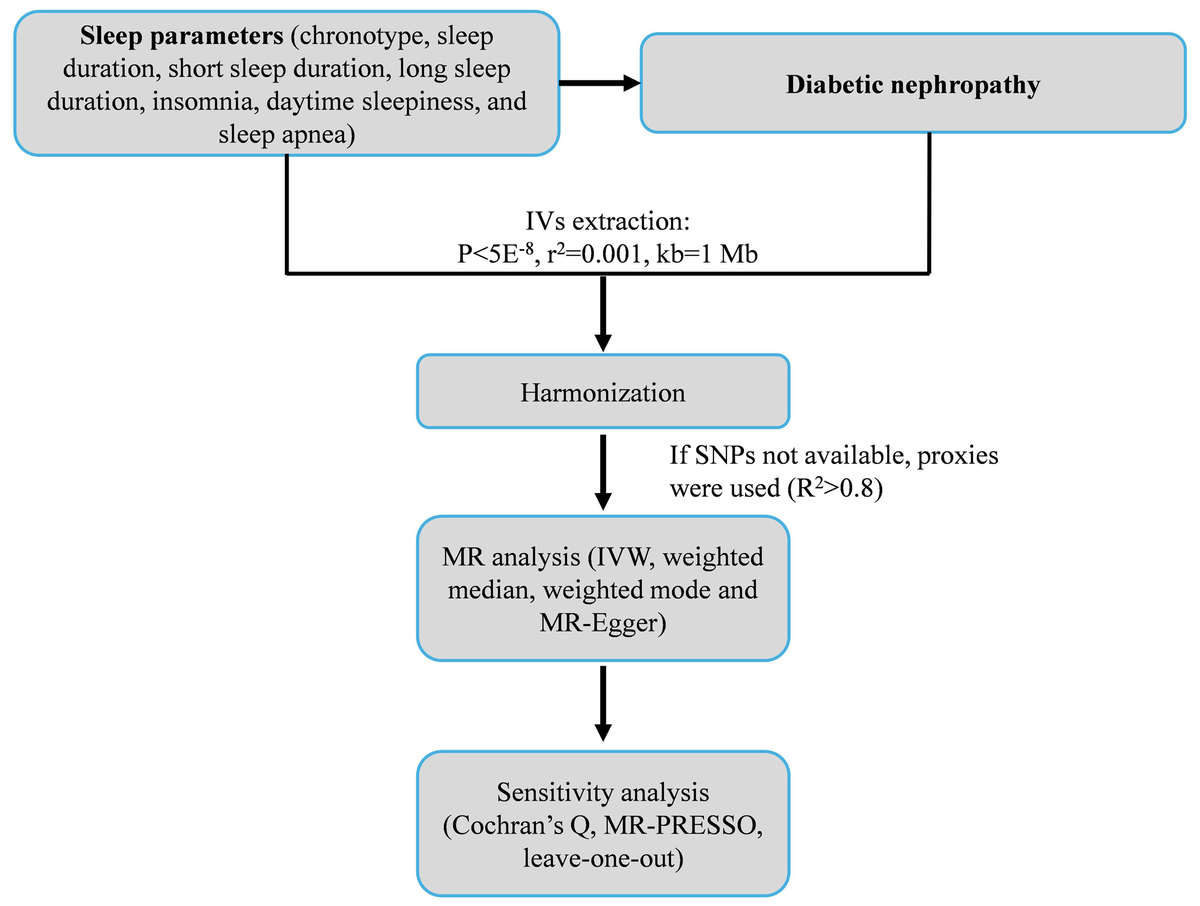
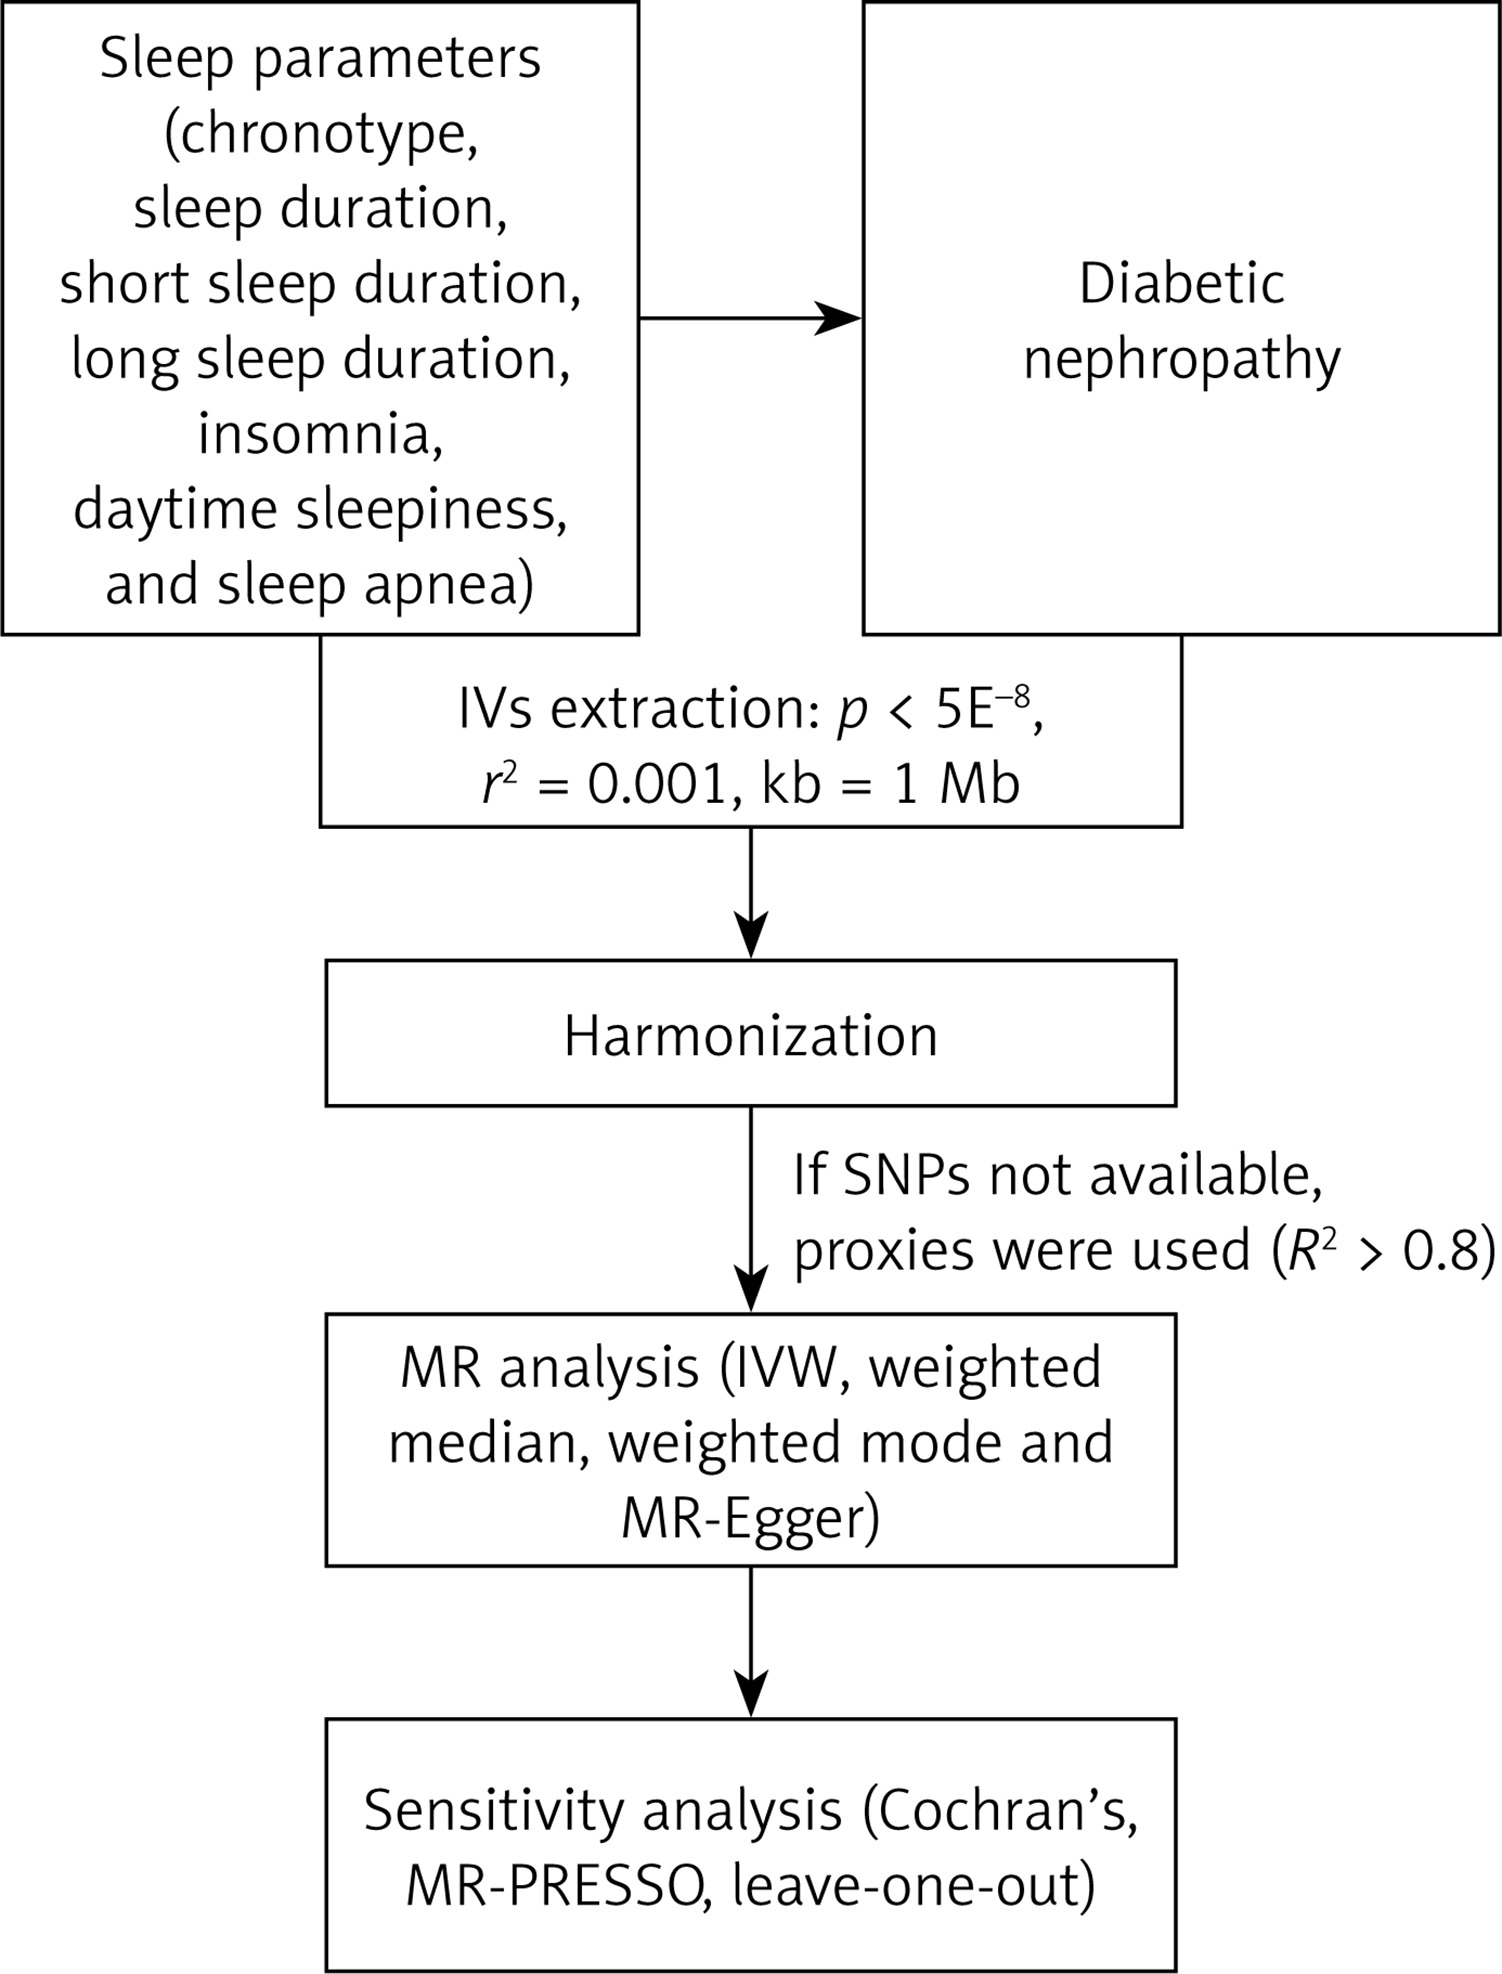
The overall design of this two-sample MR study is illustrated in Figure 1. First, we identified and curated large-scale, publicly available GWAS summary statistics for seven distinct sleep traits (exposures) and DN (outcome). Second, for each sleep trait, we selected independent single nucleotide polymorphisms (SNPs) that were strongly associated with the exposure (p < 5 × 10⁻⁸) and were not in linkage disequilibrium (r2 < 0.001 within a 10 Mb window) to serve as instrumental variables (IVs). Third, we performed the primary causal estimation using the inverse-variance weighted (IVW) method. Finally, to ensure the robustness of our findings, we conducted a comprehensive suite of sensitivity analyses, including the weighted median, weighted mode, MR-Egger regression, MR-PRESSO, and leave-one-out analyses, to detect and account for potential horizontal pleiotropy and heterogeneity.
This study was conducted using exclusively publicly available summary-level data. The original GWASs were approved by ethical committees and were performed according to the tenets of the Declaration of Helsinki. Hence, no additional ethical approval was necessary. The validity of our MR study hinges on three key assumptions: 1) the relevance assumption, which posits that the selected IVs are robustly associated with their corresponding sleep trait; 2) the independence assumption, which requires that there are no unmeasured confounders of the association between the IVs and DN; and 3) the exclusion-restriction assumption (or no horizontal pleiotropy), which states that the IVs affect DN only through their effect on the sleep trait and not via any independent biological pathways [9].
Data source
The GWAS data for DN were from the FinnGen project (https://www.finngen.fi/en). The dataset contains data on 3283 patients with DN and 181,704 controls (16,380,336 SNPs), all from Finland.
The chronotype dataset was from a published study [10]. It contains data on 403,195 individuals from the United Kingdom (UK). The sleep duration data were from 446,118 individuals from the UK [11]. That dataset contains information about long sleep duration 339,926 individuals) and short sleep duration (446,118 individuals) [11]. The data about sleep apnea syndrome were from 25,008 cases and 337,630 controls from Canada, the United States of America (USA), Finland, the UK, and Australia [12]. The datasets on insomnia (from Europe) [13] and daytime sleepiness (from the USA) [11] were from published studies (Supplementary Table SI).
Instrumental variable selection
The IVs included in this study had to meet the following criteria. First, the SNPs significantly associated with the sleep traits were screened, with a threshold of p < 5 × 10⁻⁸ [14]. Then, the SNPs with a minimum minor allele frequency (MAF) of > 0.01 were selected. Finally, SNPs showing linkage disequilibrium (LD) were filtered out based on R2 < 0.001 and a window size of 10,000 kb. In cases where a selected IV for an exposure was not present in the outcome summary data, SNPs with high LD (R2 > 0.8) were sought as proxy SNPs for replacement. The F-statistic was calculated for each SNP in the IV to assess IV strength and identify potential weak instrument bias between IVs and exposure factors. The formula was F = R2 × (N – 2)/(1 – R2). An F-statistic > 10 was required to mitigate weak instrument bias [15].
Mendelian randomization analysis
The primary method for MR analysis to assess the causal association between exposure and outcome risks in this study was the inverse variance weighted (IVW) method [16]. The results were provided as odds ratios (ORs) and 95% confidence intervals (CIs). If the IVW results were statistically significant, their robustness was tested using complementary MR methods, including the MR-Egger [17], weighted median [18], and weighted mode [19]. All analyses were carried out using the “TwoSampleMR” package in R 4.0.5 (The R Project for Statistical Computing, www.r-project.org). The analyses were visualized using scatter and forest plots.
Sensitivity analysis
Heterogeneity was detected using Cochran’s Q test; p > 0.05 indicated low heterogeneity, suggesting that the estimates among IVs were randomly distributed and had little impact on the IVW analysis [20]. Funnel plots were generated to visualize heterogeneity. Horizontal pleiotropy was detected using the MR-Egger regression method; an intercept near 0 or p > 0.05 indicated the absence of pleiotropy [20]. The MR pleiotropy residual sum and outlier (MR-PRESSO) analysis was used to detect potential outliers, indicated by p < 0.05, and re-estimate the causal associations after outlier removal [20]. A leave-one-out analysis was used to determine whether single SNPs drove the results; the leave-one-out analysis was shown as forest plots.
Results
Instrument variable selection
In this study, when performing MR analyses with chronotype, sleep duration, short sleep duration, long sleep duration, insomnia, daytime sleepiness, and sleep apnea syndrome as exposures, 122, 70, 26, 10, 13, 33, and 5 IVs were identified, respectively. The mean F-statistics for these IVs were 45.67, 40.67, 34.35, 31.91, 41.19, 42.45, and 43.43, respectively. The minimum F-statistics ranged from 29.02 to 29.88 for the different exposures, while the maximum values ranged from 52.98 to 168.52. No SNPs were unmatched in the summary data for chronotype, short sleep duration, insomnia, daytime sleepiness, and sleep apnea syndrome-related IVs. In contrast, two SNPs were unmatched for long sleep duration, without proxy SNPs being identified. The R2 values, indicating the proportion of variance explained by the IVs for each trait, were 0.01, 0.006, 0.002, 0.001, 0.004, 0.003, and < 0.001, respectively, for the different exposures. The selection of the IVs is summarized in Supplementary Table SII. All F-values were >10, indicating the absence of weak instrumental bias (Supplementary Table SIII).
Mendelian analysis results
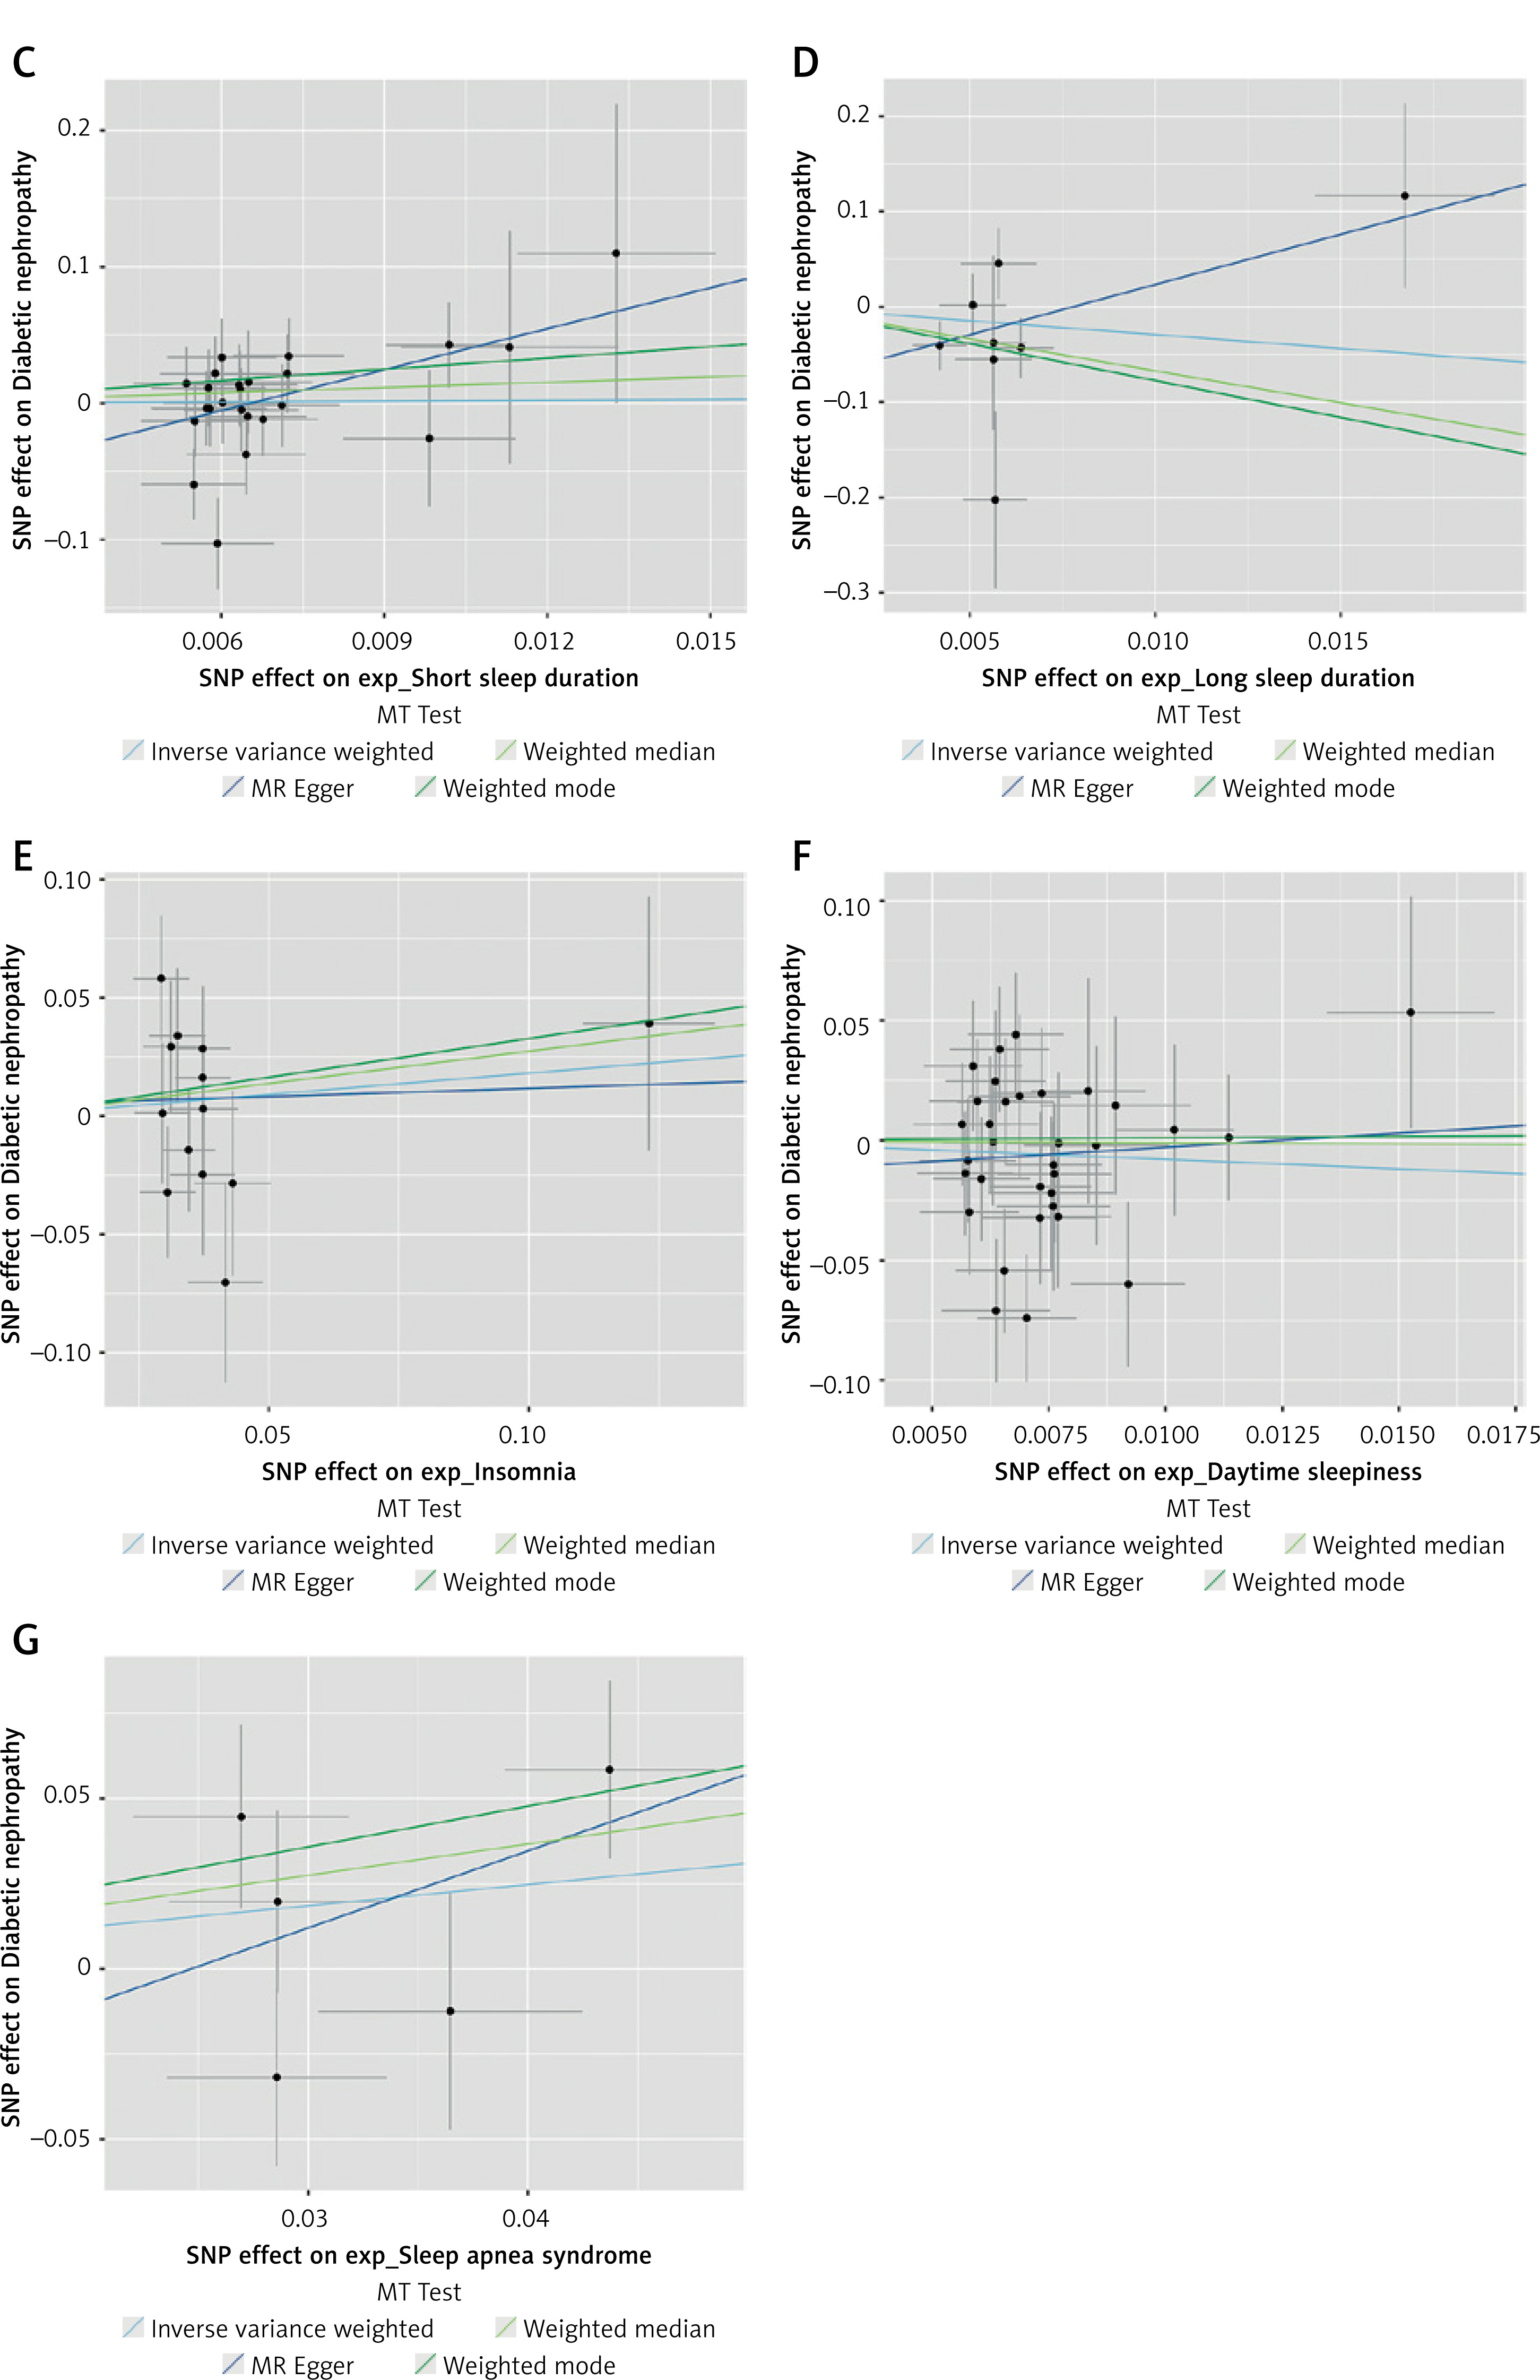
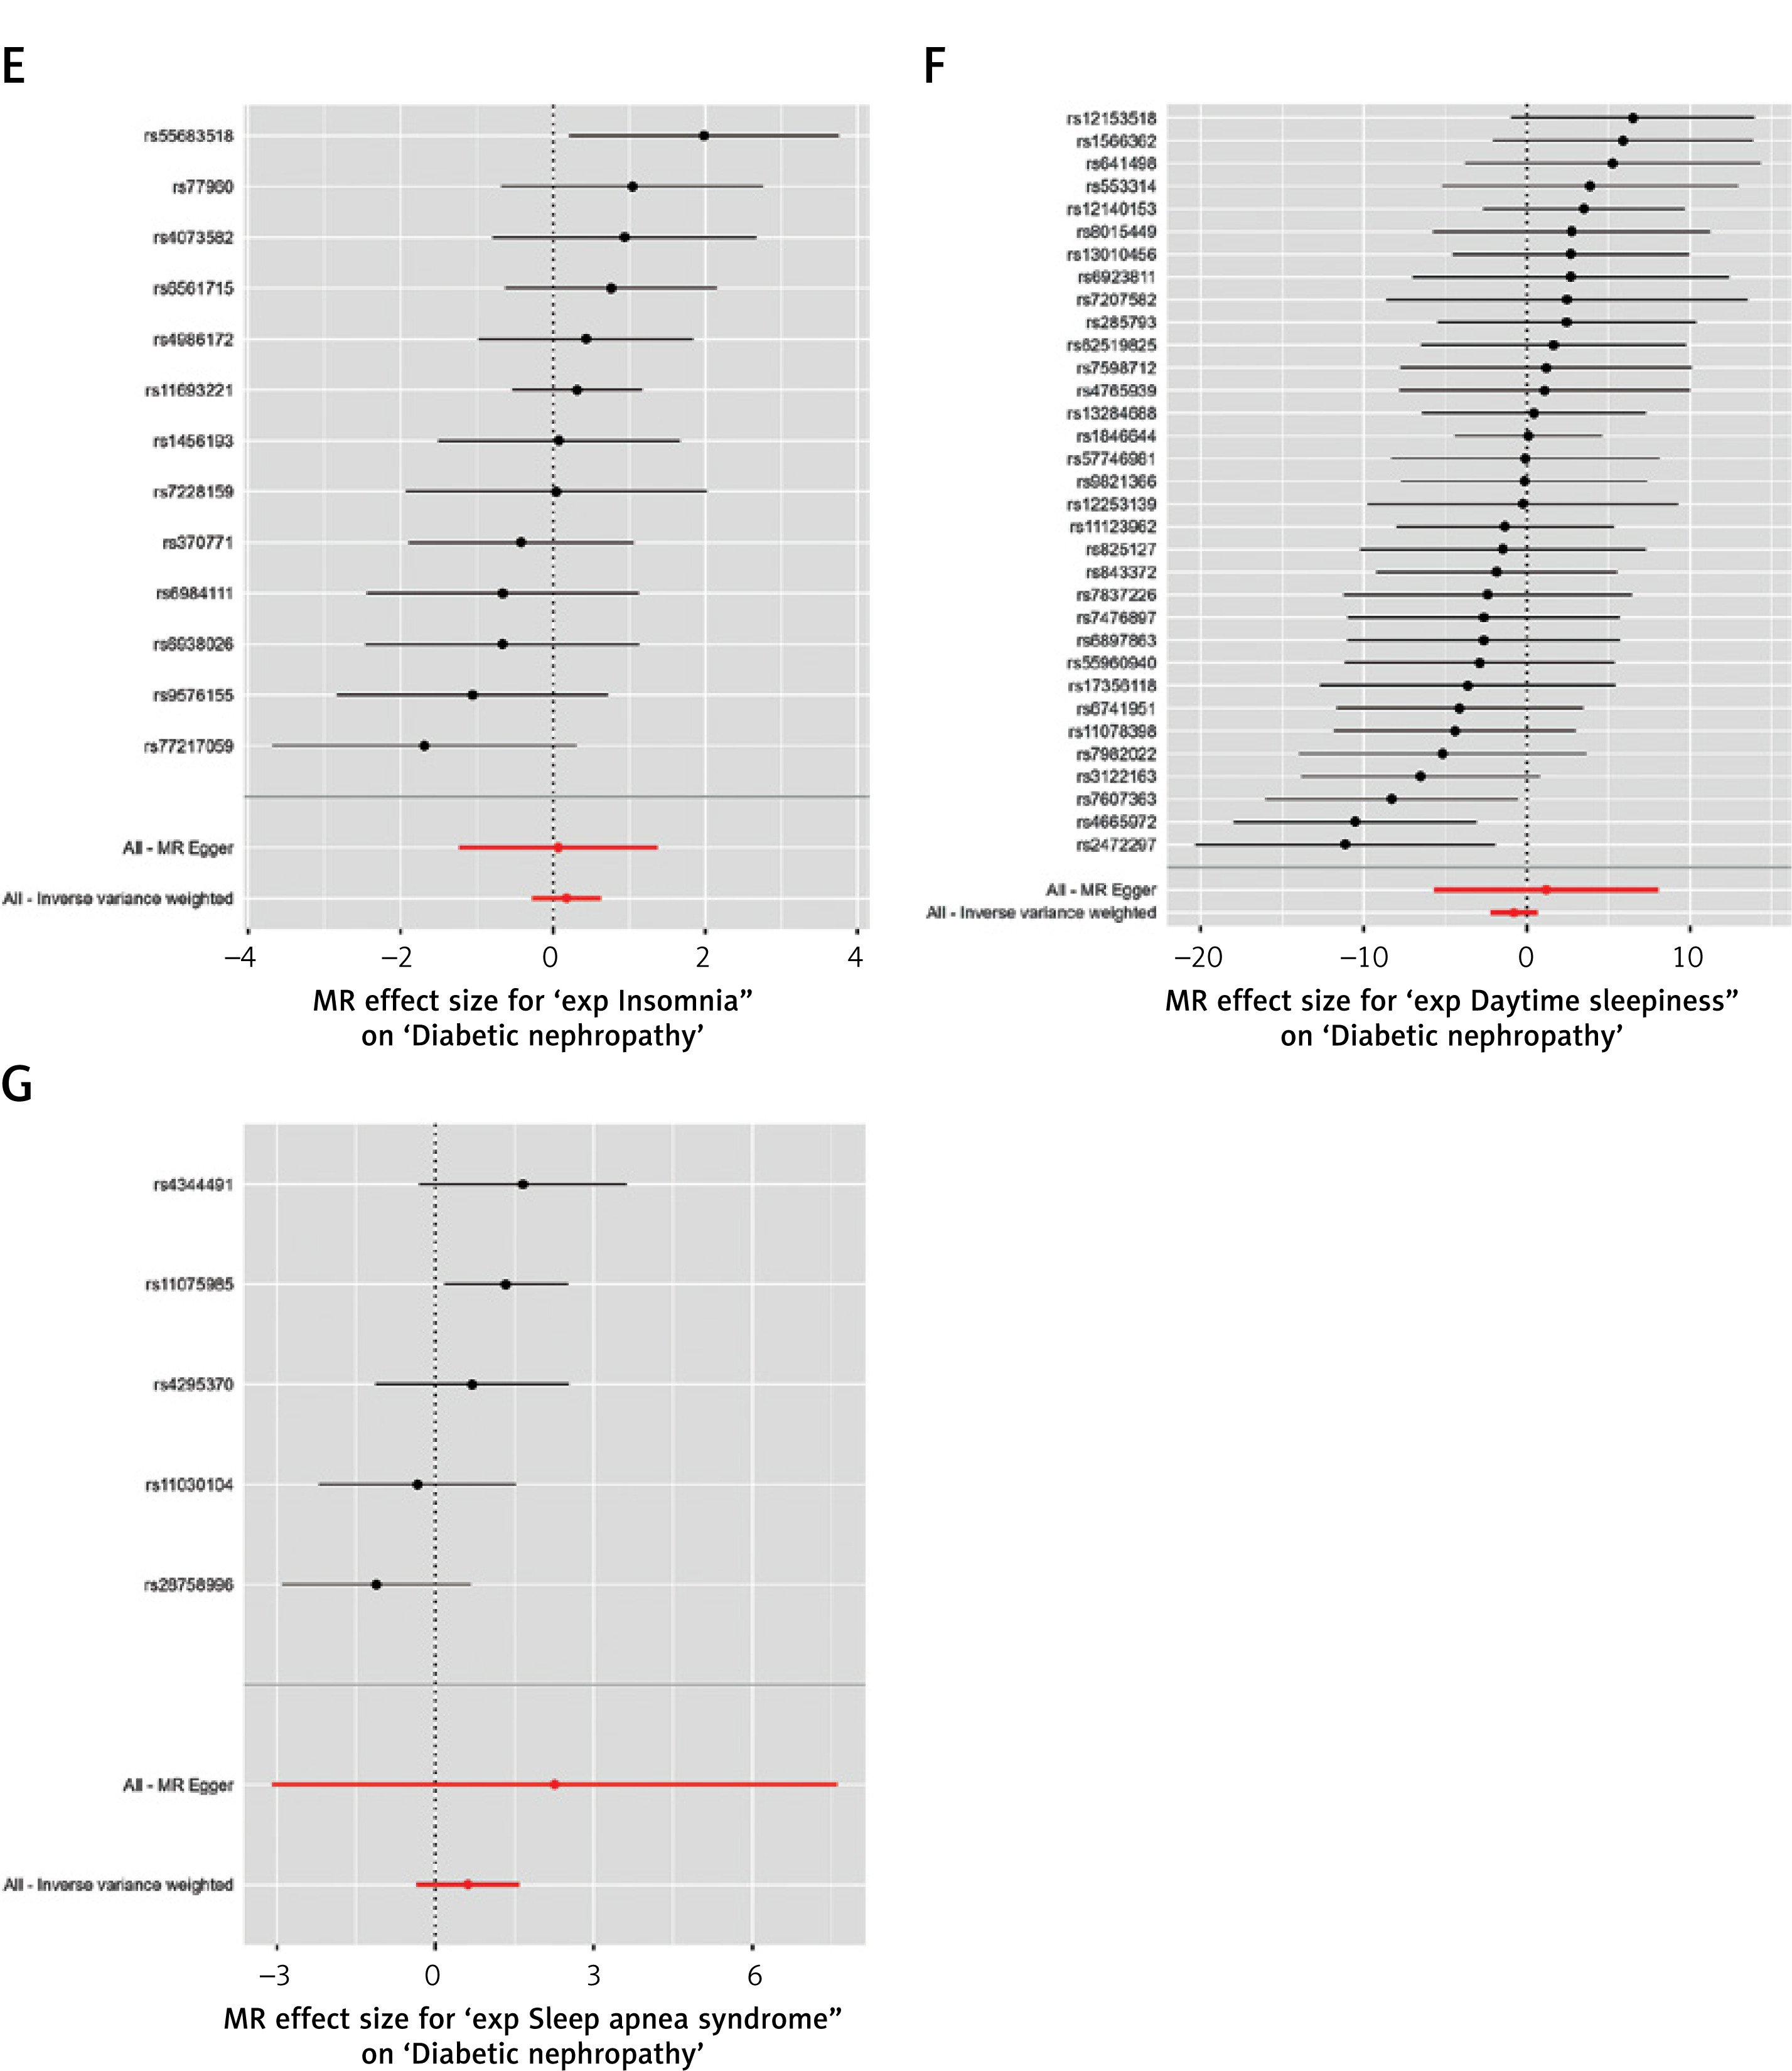
Genetic prediction results indicated no statistically significant associations between the sleep traits and DN (all IVW p > 0.05) (Table I, Figures 2 and 3). The weighted median analysis showed a possible causal association between long sleep and DN (OR = 0, 95% CI: 0–0.70, p = 0.04) and a borderline possible causal association between sleep apnea syndrome and DN (OR = 2.50, 95% CI: 0.99–6.35, p = 0.05). However, these results must be interpreted cautiously, since the main MR analysis is IVW.
Table I
Genetic prediction of the association between sleep characteristics and the risk of developing causal associations with diabetic nephropathy
Sensitivity analysis
Heterogeneity among IVs can bias the results. Cochran’s Q-test indicated possible heterogeneity for the sleep duration analysis (p = 0.01) (Supplementary Table SIV and Supplementary Figure S1). The third key assumption for the validity of MR analyses is the absence of horizontal pleiotropy. MR-Egger regression suggested the absence of horizontal pleiotropy (all p > 0.05) (Supplementary Table SIV). MR-PRESSO did not detect outliers (Supplementary Table SV), suggesting the robustness of the results. The leave-one-out analysis suggested that no single SNP drove the results (Supplementary Figure S2), also suggesting robustness.
Discussion
This two-sample MR study explored the causal association of sleep traits, including chronotype, sleep duration, short sleep duration, long sleep duration, insomnia, daytime sleepiness, and sleep apnea syndrome, with DN. The results suggested no causal associations between sleep traits and DN based on the primary IVW analyses. Still, the weighted median analysis showed a possible causal association between long sleep and DN and a borderline possible causal association between sleep apnea syndrome and DN.
DN affects the sleep quality of the patients, but the relationship is complex and is influenced by physical and psychological factors [4]. The present MR study did not explore that association. On the other hand, whether sleep can influence the occurrence of DN remains poorly understood. Nevertheless, poor sleep quality is associated with poor health outcomes. Indeed, short and long sleep durations are associated with overall mortality (absolute increases in mortality of 12% and 39%, respectively) and cognitive decline [21]. Compared with 7 h of sleep, a 1-h decrease in sleep duration was associated with an 11% increase in the risk of cardiovascular heart disease, while a 1-h increase in duration was associated with a 7% increase [22]. In addition, compared with 7 h of sleep, a 1-h decrease in sleep duration was associated with a 9% increase in the risk of type 2 diabetes mellitus, while a 1-h increase in duration was associated with a 14% increase [23]. Short sleep was also associated with falls, accidents, and injuries, incident obesity, and incident hypertension [21]. Although those previous studies did not examine DN, diabetes is a prerequisite for DN diagnosis, and obesity and hypertension are risk factors for DN [1]. The intermittent hypoxia observed in sleep apnea is also associated with a systemic proinflammatory state [24] that can contribute to the occurrence of DN. Sleep disturbances are also associated with systemic inflammation [25]. Indeed, inflammation is involved in the pathogenesis of DN [26]. Furthermore, OSA can influence the blood glucose levels [27].
Still, the present study showed no causal associations between sleep traits and DN, based on the IVW results. The weighted median analysis suggested the possibility of causal associations between long sleep duration and DN and between sleep apnea and DN, but those results were not observed in the IVW analysis. They must be interpreted with caution, but suggest the possibility of an association that might warrant additional study. The pathogenesis of many diseases is influenced by a combination of genetic and environmental factors [28]. Even though genetic factors are a major determinant of disease risk, environmental factors also play an important role [28]. Therefore, in the case of negative genetic results, as is the case here, examining whether there is an interaction between environmental factors and the exposures and outcomes, and how these factors affect the results, is necessary. Unfortunately, GWAS datasets do not contain such information. Longitudinal studies would be necessary to look into those points. Therefore, negative MR results do not mean that there is no association between the exposures and the outcomes, but that the genetically predicted risk of the exposure is not associated with the genetically predicted risk of the outcome. The absence of association may be because the genetic variation is insufficient to model the effect of exposure on outcome adequately. It is a known limitation of MR studies, especially where genetic variants have small or weaker effects on exposure.
This study had several strengths. It used a two-sample MR design and GWAS data from tens of thousands of individuals to evaluate the causal association between sleep traits, OSA, and DN. On the other hand, the study also had limitations. First, the GWAS data in the present study were from European, North American, and Australian populations (i.e., mainly of European ancestry), and their generalizability to other populations remains unknown. Second, some participants could have been included in both the exposure and the outcome, but it is impossible to determine the exact extent of the phenomenon. Still, using stringent statistics should minimize the impact of eventual overlap [29]. The selection of IVs can influence causal associations, and while the present study applied robust selection criteria, the inherent genetic architecture of the traits might limit the strength or number of available IVs. Third, MR studies assess the effect of lifelong genetic predisposition to an exposure, which may not fully capture the impact of acquired or fluctuating sleep patterns on DN risk. Finally, negative MR results indicate that the genetically predicted risk of the exposures is not associated with the genetically predicted risk of the outcome, which can occur if the genetic variation is insufficient to model the effect of exposure on outcome adequately, a known limitation where genetic variants have weaker effects on exposure.
In conclusion, the present MR analysis suggested no causal associations between sleep traits (chronotype, sleep duration, short sleep duration, long sleep duration, insomnia, daytime sleepiness, and sleep apnea syndrome) and DN. Further in-depth research is needed to examine the relationship between sleep and DN.