Introduction
Preeclampsia (PE) is a pregnancy-specific disorder affecting approximately 5% of pregnancies, contributing to over 70,000 maternal and 50,000 fetal deaths annually worldwide. It manifests as proteinuria and hypertension after 20 weeks of gestation [1, 2]. Studies have indicated that PE correlates with a 13–16% reduction in birth weight, varying with disease severity [3, 4]. Moreover, chronic hypertension, pregestational diabetes mellitus, multiple gestations, pre-pregnancy body mass index (BMI) exceeding 30 kg/m2, and antiphospholipid syndrome are significant risk factors for PE development [2]. Preeclampsia progresses through two stages. The first stage entails abnormal trophoblastic invasion of uterine blood vessels, leading to inadequate placentation and placental hypoxia. The second stage involves a systemic inflammatory response to endothelial cell dysfunction, stemming from an imbalance between proangiogenic and antiangiogenic factors of the placenta [5].
In normal pregnancies, the vascular endothelial cell surface resists thrombosis and clot formation [6]. The coagulation system is involved in the cleavage of fibrinogen into fibrin. Therefore, fibrinogen levels are typically elevated during pregnancy, which further increases the number of cases of PE. Furthermore, fibrinogen interacts with a multidomain protein known as histidine-rich glycoprotein (HRG). Histidine-rich glycoprotein, primarily produced by parenchymal liver cells, is abundant in the plasma and possesses angiogenic and antiangiogenic properties. Moreover, it is involved in the coagulation pathway and influences the female reproductive system [7].
Dysfunction of the angiogenic pathway has been reported in PE, manifesting as decreased levels of HRG [8]. Preeclampsia is associated with elevated levels of platelet activation, von Willebrand’s factor, and factor VIII activity [9]. In general, HRG plasma levels decrease during the third trimester of pregnancy. Moreover, patients with PE exhibit lower HRG levels during the third trimester than those with normal pregnancies [10].
The HRG gene was used as an input in this study to delineate a ranked list of regulatory microRNAs (miRNAs) using the miRDB-MicroRNA Target Prediction and Functional Study Database [11] and microRNAOrg Target and expression database [12]. As HRG has many putative epigenetic regulators, bioinformatics analyses have focused on specific miRNAs previously implicated in PE and known to target HRG (Figures 1 A, B). Pathway enrichment analyses of miR-877, which has numerous target genes, were conducted using DIANA-mirPath software [13]. Furthermore, HRG was retrieved and confirmed as an associated gene involved in modulating coagulation and fibrinolysis, according to the GenAtlas database [14].
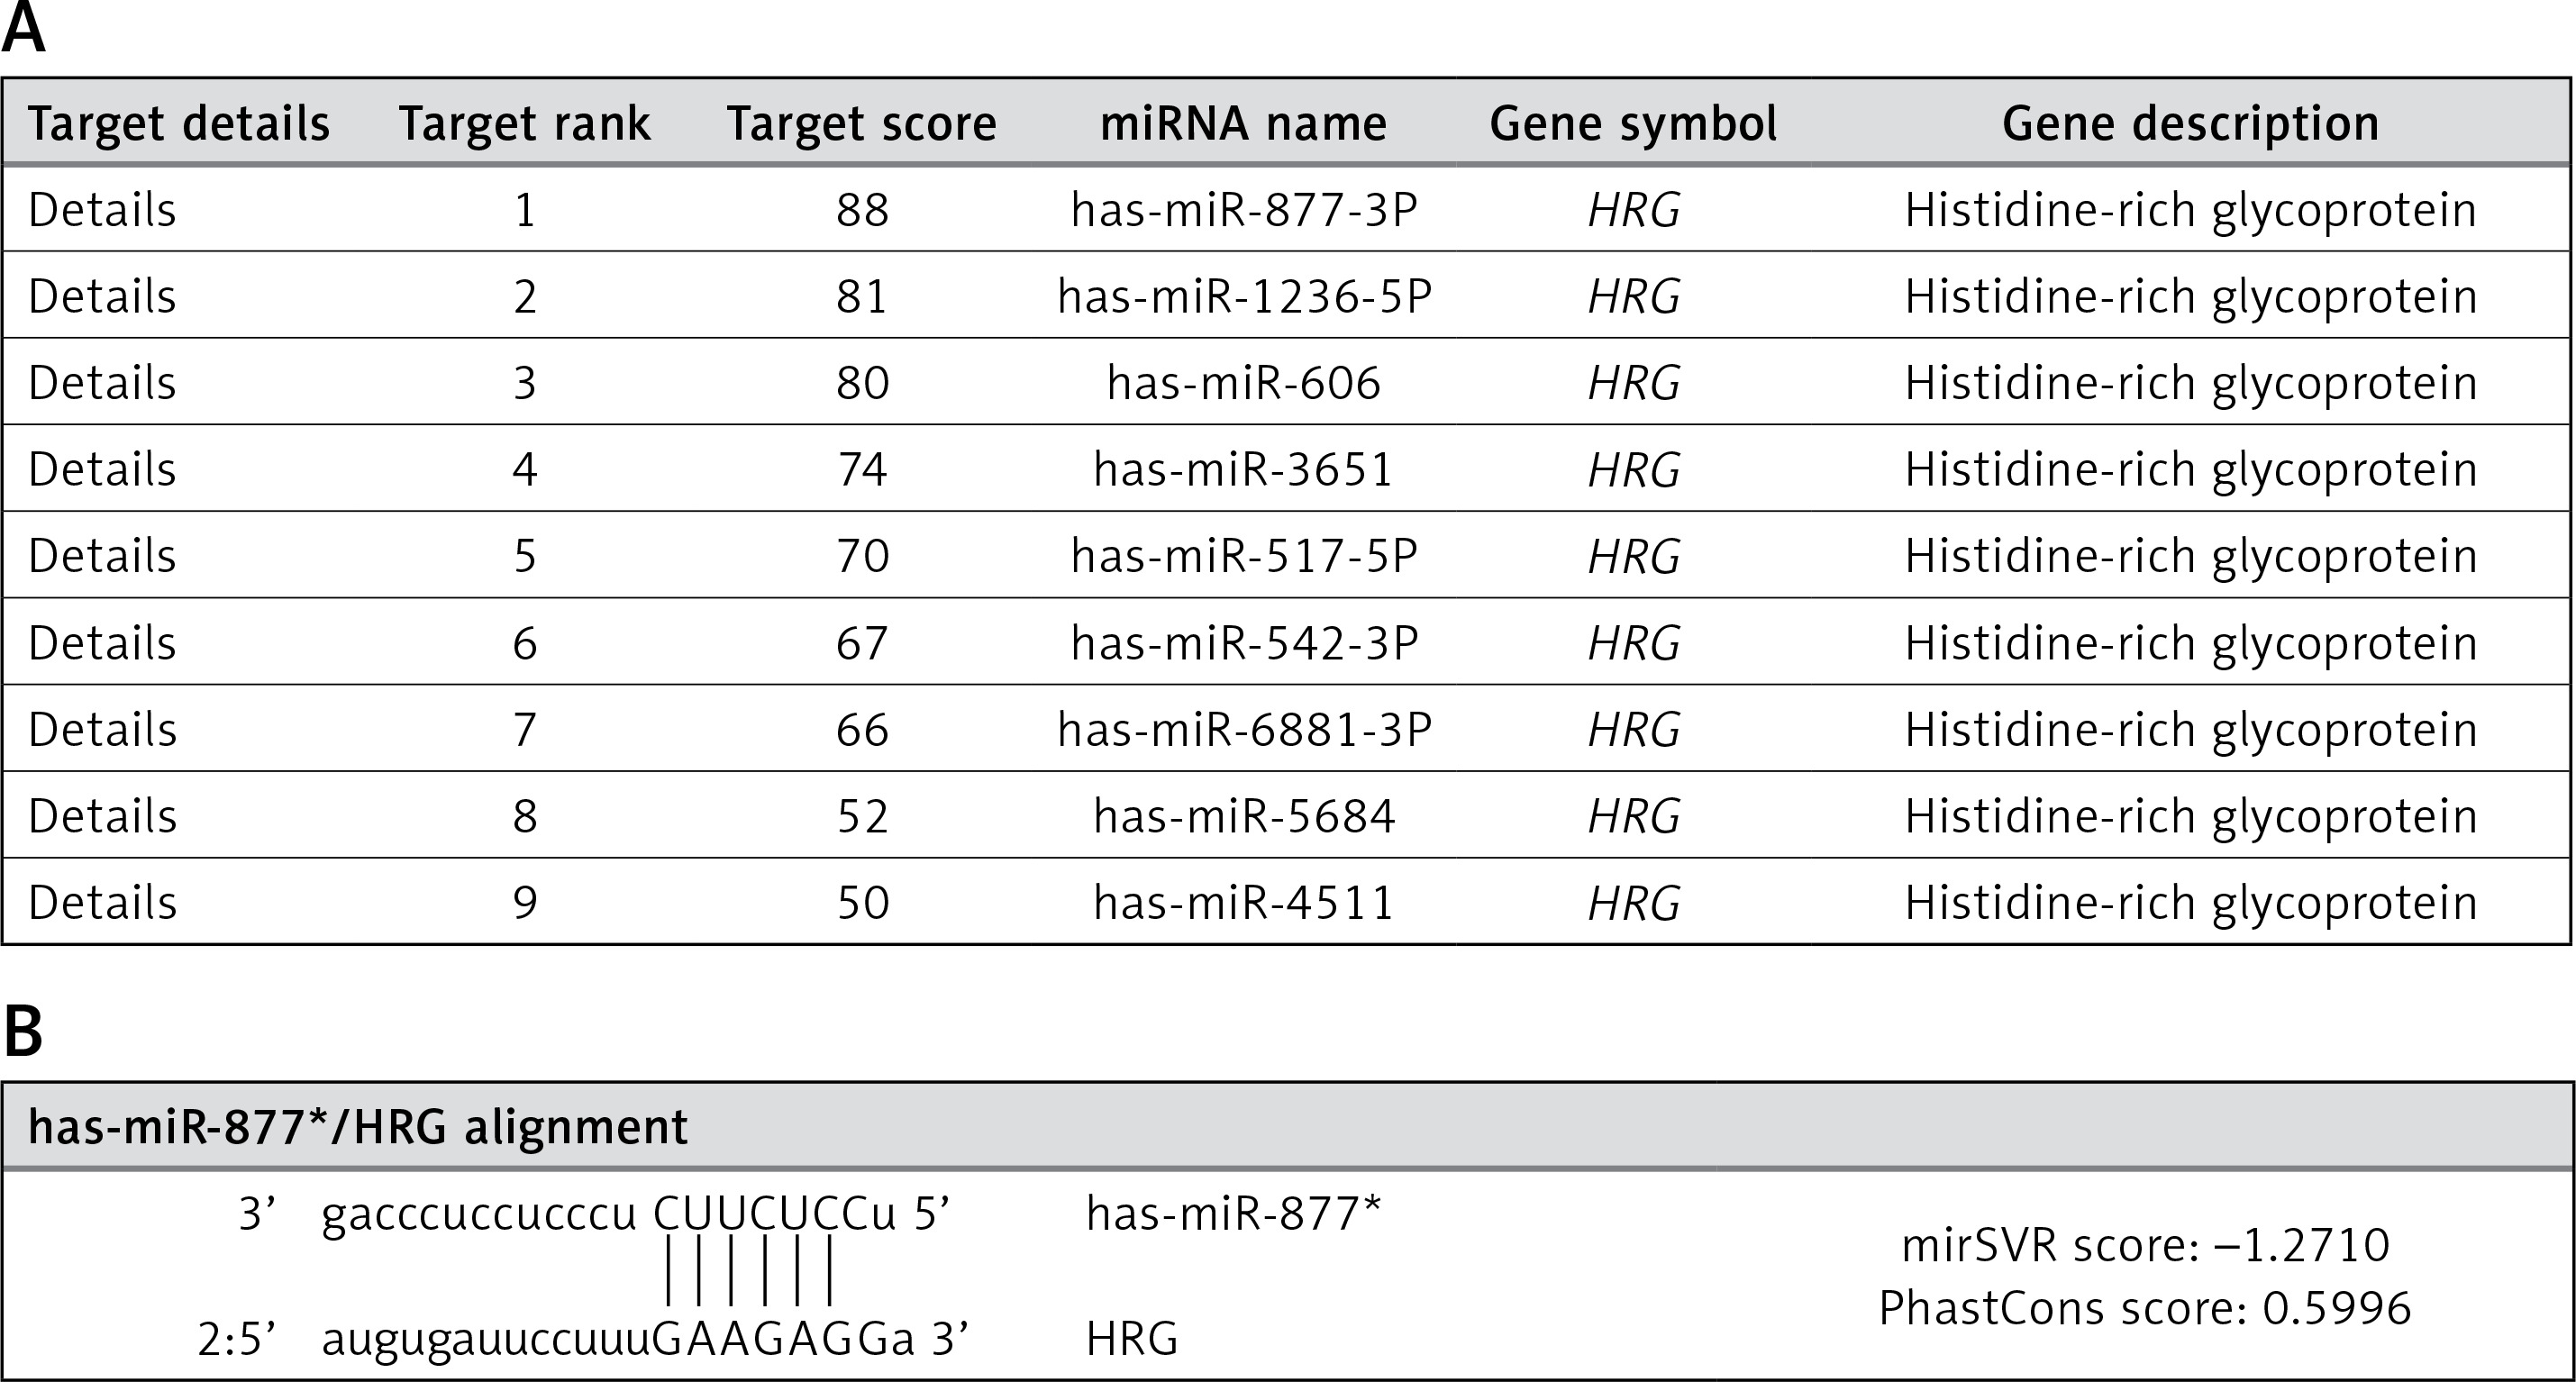
Figure 1
Target miRNAs related to HRG. A – Histidine-rich glycoprotein (HRG) regulatory miRNAs are presented according to their target scores in the miRDB-MicroRNA Target Prediction and Functional Study Database (http://www.mirdb.org/). B – Alignment of miR-877 with HRG as retrieved from http://www.microrna.org/microrna/home.do
Various small molecules known as miRNAs are differentially expressed in the placenta based on gestational age [15, 16]. miRNAs are small, noncoding RNAs that regulate post-transcriptional gene expression [17]. They are involved in various fundamental cellular processes, such as angiogenesis and carcinogenesis [18]. Moreover, these small molecules are involved in many diseases, including PE [19–22]. For instance, miR-574-5p and miR-1972 act as antiangiogenic factors that affect endothelial cells in PE [23]. Another example is miR-877, which has been associated with PE through bioinformatics analyses [24]. Moreover, miR-877 has been extensively investigated in cancer suppression and progression [25–27]. However, the association between miR-877 and PE, particularly HRG, remains unclear.
This study aimed to investigate the clinical relevance of miR-877 and HRG expression in PE. We hypothesized that miR-877 and HRG are involved in the progression of PE and serve as potential biomarkers for distinguishing mild cases from severe cases of the disease. By examining the expression levels of miR-877 and HRG in placental and serum samples, this research seeks to provide insights that may contribute to the development of novel diagnostic and therapeutic strategies for PE.
Material and methods
Ethics approval and consent to participate
This study was conducted with approval from the Institutional Review Board of the Research Ethics Committee at the Faculty of Medicine, Ain Shams University, under the reference number FMASU MD461a/2010. Written informed consent was obtained from the participants before inclusion in the study.
Patients
This case-control study was conducted in collaboration with the Medical Biochemistry, Molecular Biology, and Obstetrics and Gynecology Departments at the College of Medicine of Ain Shams University. This study included 75 pregnant women in the third trimester of pregnancy. According to the American College of Obstetricians and Gynecologists guidelines, 50 patients were diagnosed with PE [28]. This study included women admitted to the Obstetrics and Gynecology Hospital, Ain Shams University, for delivery in the period from 2015 to 2016. Patients with essential hypertension, renal insufficiency, diabetes mellitus, multiple gestation, or neoplasia were excluded from the study. The clinical data were retrospectively collected from the patients’ files.
Study design
Patients were classified into severe PE (group A) and mild PE (group B) groups. Group A included pregnant women with a systolic/diastolic blood pressure ≥ 160/110 mm Hg and proteinuria ≥ 3 on a urine dipstick, based on two measurements conducted at an interval of ≥ 6 h (n = 25). Group B included 25 women with systolic/diastolic blood pressure > 140/90 mmHg and proteinuria ≥ 1 on a urine dipstick, based on two measurements conducted at an interval of ≥ 6 h (n = 25). Group C was the control group comprising normotensive healthy pregnant women who were not diagnosed with PE and had no known health conditions that could affect the study outcomes (n = 25). The qualitative characteristics of patients with PE and normal controls, including maternal age, gestational age, BMI, and birth weight, were initially determined. Additionally, quantitative characteristics such as systolic blood pressure level, diastolic blood pressure level, urinary albumin level, gestational age, birth weight, and placental weight were assessed. This comprehensive evaluation ensured that the control group was adequately matched with the PE group. miR-877 was selected from the MicroRNA Target Prediction and Functional Study Database (http://www.mirdb.org) because it is the first-ranked miRNA associated with HRG (Figures 1 A, B). miR-877 and HRG were chosen as the main parameters for assessment in the placental and serum samples of PE and control groups.
Sample collection and processing
Upon delivery, placental samples were directly collected in a dish placed on ice. Approximately 1–2 cm3 of tissue samples were dissected from the maternal side of the placentae, as described by Sood et al., 2006 [29]. Villous and placental tissues were prepared by dissecting blood vessels and connective tissue and stored at –80°C until analysis. Immediately before delivery, blood samples were collected in nonheparinized tubes, allowed to clot, and centrifuged at 1,500 × g for 10 min. The serum was transferred to Eppendorf tubes and stored at –70°C until analysis.
Tissue lysis
To avoid proteolytic degradation, approximately 0.10–0.15 g of frozen tissue was dissected and transferred to a 2-ml microcentrifuge tube containing one stainless steel bead (5 mm diameter). For every 50 mg of tissue, 500 μl of phosphate-buffered saline was added to the tube, and the mixture was lysed using a TissueLyser LT bead mill (Qiagen, USA) for 15 min at maximum speed. Subsequently, the samples were centrifuged for 10 min at 13,226 × g, and the total protein concentration in the supernatant was measured using the Bradford method [30].
Relative expression of miR-877 using quantitative reverse transcription–polymerase chain reaction (qRT-PCR)
Total RNA extraction from placental tissue and blood samples was performed using a miRNeasy mini kit (Qiagen, Germany) following the manufacturer’s instructions. RNA concentration was quantified using a NanoDrop 1,000 Spectrophotometer (Thermo Fisher Scientific, USA), with an absorbance ratio (A260/280) of 1.8–2, indicating pure RNA samples. Reverse transcription was performed using MiScript II RT-PCR kits (Qiagen, Germany) according to the manufacturer’s protocol.
qRT-PCR was performed using a miScript SYBR Green PCR kit (Qiagen, catalog number: 218,073, Germany). Primers for the selected miRNA and endogenous control were purchased from Qiagen. Primer assays were used to amplify miR-877 (catalog number: MS00010654), wherein the endogenous small nuclear RNA U6 (RNU6-2) served as an internal control. qRT-PCR was performed using the 5-plex Rotor Gene PCR System (Qiagen, Germany). The reaction mixture (20 µl) comprised 2× QuantiTectsyber green PCR master mix, 10× miScript universal primer, 2 µl of primer assay, and 50 pg–3 ng of cDNA. The thermal protocol involved 15 min of activation at 95°C for Hot Star Taq DNA Polymerase, followed by 40 cycles of denaturation at 94°C for 15 min, primer annealing at 55°C for 30 s, and extension at 70°C for 30 s. The expression levels of miRNAs were determined based on the cycle threshold (Ct). Relative expression levels of each miRNA were calculated as 2–ΔΔCt after normalization to the expression level of RNU6-2, following the method described by Livak and Schmittgen [31]. Melting curves were constructed to confirm the specificity of PCR products.
Quantitative determination of histidine-rich glycoprotein levels
Histidine-rich glycoprotein levels were assessed in placental tissue and serum samples of all patients and controls using an enzyme-linked immunosorbent assay (ELISA) kit (catalog number: E2267h; Wuhan EIAab Science Co., Ltd, China). The assay was conducted following the manufacturer’s protocol, which is based on the quantitative sandwich enzyme immunoassay technique.
Statistical analyses
Data analyses were performed using IBM SPSS Statistics version 20.0. Data were expressed as mean, standard deviation, median, and mean rank. The Kruskal-Wallis test was used to statistically compare nonparametric variables between groups. Additionally, χ2 analysis was used to compare categorical data with variables cross-tabulated in all possible combinations. Spearman correlation was used to calculate correlation coefficients (r). The receiver operating characteristic (ROC) curve was used to determine the optimal threshold representing the maximum sensitivity and specificity. Furthermore, logistic regression analysis was used to determine independent predictors. A p-value of < 0.05 was considered to indicate statistical significance.
Results
Demographic and clinical parameters of participants
To determine significant differences related to PE, demographic and clinical parameters were compared between pregnant women diagnosed with PE and healthy pregnant controls. Maternal clinical parameters and pregnancy outcomes of the patients and controls are presented in Tables I and II. Pregnant women with PE did not differ significantly from controls with regard to age and BMI. Gestational ages at delivery were significantly reduced in the PE group (p = 0.001); 34 women had full-term delivery, 16 had preterm delivery (< 37 weeks), and all controls delivered at term (≥ 37 weeks). Eleven patients with PE delivered smaller infants than the controls of the same gestational age (< 10th percentile), and the placental weight was significantly lower in patients with PE than in the controls (p = 0.001). Systolic and diastolic blood pressure levels were significantly higher in the PE group than in the control group (p = 0.001). The urinary albumin level was also significantly higher in the PE group than in the control group (p = 0.001) (Table II).
Table I
Clinical characteristics and pregnancy outcome of preeclampsia (PE) and control groups
| Clinical data and pregnancy outcome | Groups | χ2P-value | |
|---|---|---|---|
| PE, n (%) | Control, n (%) | ||
| Maternal age | |||
| ≥ 34 years | 8 (16) | 2 (8) | 0.923 0.34 |
| < 34 years | 42 (84) | 23 (92) | |
| Gestational age | |||
| Preterm < 37 weeks | 16 (32) | 0 (0) | 10.169 0.001** |
| Full term ≥ 37 weeks | 34 (68) | 25 (100) | |
| Body mass index (BMI) | |||
| Normal | 4 (8) | 6 (24) | 3.857 0.145 |
| Overweight | 24 (24) | 11 (44) | |
| Obese | 22 (44) | 8 (32) | |
| Birth weight | |||
| Normal (10th–90th centile) | 39 (78) | 25 (100) | 6.445 0.001** |
| Small for gestational age (< 10th centile) | 11 (22) | 0 (0) | |
Table II
Quantitative clinical data and pregnancy outcome of preeclampsia (PE) and control groups
| Clinical data | Groups | Median | Range | Mean ± SD | t-test P-value |
|---|---|---|---|---|---|
| Systolic blood pressure [mm Hg] | PE | 150 | 140–200 | 158.60 ± 19.17 | 11.551 0.001** |
| Control | 110 | 90–120 | 112.60 ± 8.66 | ||
| Diastolic blood pressure [mm Hg] | PE | 100 | 90–150 | 103.2 ± 13.32 | 10.568 0.001** |
| Control | 70 | 70–80 | 74 ± 5 | ||
| Urinary albumin | PE | 2 | 1–3 | 1.8 ± 0.84 | 9.886 0.001** |
| Control | 0 | 0–2 | 0.08 ± 0.4 | ||
| Gestational age [weeks] | PE | 35 | 34–40 | 37.40 ± 1.98 | 3.528 0.002** |
| Control | 39 | 37–40 | 38.92 ± 1.18 | ||
| Birth weight [g] | PE | 2775 | 2000–3500 | 2627.5 ± 479.48 | 4.151 0.004** |
| Control | 3000 | 2500–3800 | 3058 ± 275.25 | ||
| Placental weight [g] | PE | 375 | 300–452 | 362.46 ± 56.80 | 7.605 0.001** |
| Control | 450 | 420–480 | 450 ± 14.880 |
miR-877 expression
To determine the discriminative power of miR-877 in placental and serum samples for diagnosing PE in pregnant women, we studied miR-877 expression. The optimal cutoff for the placental miR-877 level was 0.144 (area under the curve [AUC] = 0.957) to discriminate the PE group from the control group using the ROC curve (Figure 2 A). Patients with severe PE showed the highest placental miR-877 level (mean ± standard deviation [SD]: 2.5 ± 1.04), with a significant difference between the study groups (p = 0.001). The best cutoff for serum miR-877 level was 0.147 (AUC = 0.942) to distinguish the PE group from the control group using the ROC curve (Figure 2 B). Patients with severe PE showed the highest serum miR-877 level (1.29 ± 0.74), with a significant difference between the study groups (p = 0.001) (Table III). These findings indicated that miR-877 levels in placental and serum samples were significantly elevated in severe cases of PE compared with those in controls.
Table III
miR-877 and HRG expression in cases and control
| Parameter | Severe preeclampsia | Mild preeclampsia | Control | Statistics | P-value | ||
|---|---|---|---|---|---|---|---|
| miR-877 (qRT-PCR) | Placental tissue | Mean ± SD | 2.5 ±1.04c,d | 0.62 ±0.39 | 0.14 ±0.17 | F = 98.5 | 0.001**a |
| Mean rank | 62.8 | 36 | 15.1 | χ2 = 60.1 | 0.001**b | ||
| Median | 2.67 | 0.712 | 0.079 | ||||
| Serum | Mean ± SD | 1.29 ±0.74c,d | 0.44 ±0.3 | 0.06 ±0.16 | F = 43.8 | 0.001**a | |
| Mean rank | 59.4 | 38.6 | 15.9 | χ2 = 49.9 | 0.001**b | ||
| Median | 1.084 | 0.540 | 0.009 | ||||
| HRG protein (ELISA) | Placental tissue [pg/mg] | Mean ± SD | 14.5 ±4.8e,f | 13.7 ±6.6 | 6.15 ±4.3 | F = 18.5 | 0.001**a |
| Mean rank | 50 | 44.7 | 19.28 | χ2 = 28.4 | 0.001**b | ||
| Median | 14.05 | 10.6 | 5.2 | ||||
| Serum [pg/ml] | Mean ± SD | 35.5 ±18g,h | 53.3 ±17.7 | 69.5±18.5 | F = 22.12 | 0.001**a | |
| Mean rank | 21.6 | 38.4 | 54 | χ2 = 27.5 | 0.001*b | ||
| Median | 34 | 56 | 76.6 | ||||
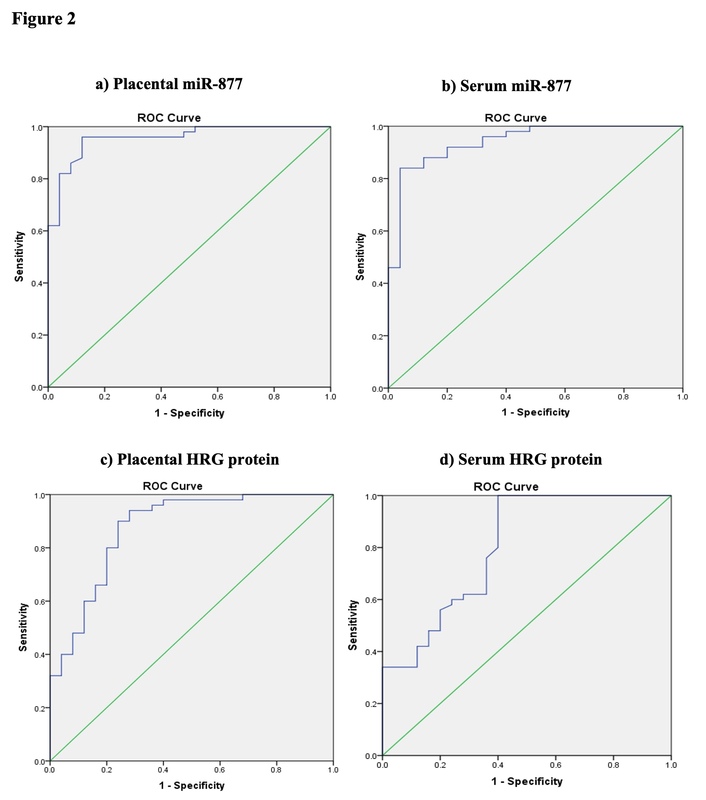
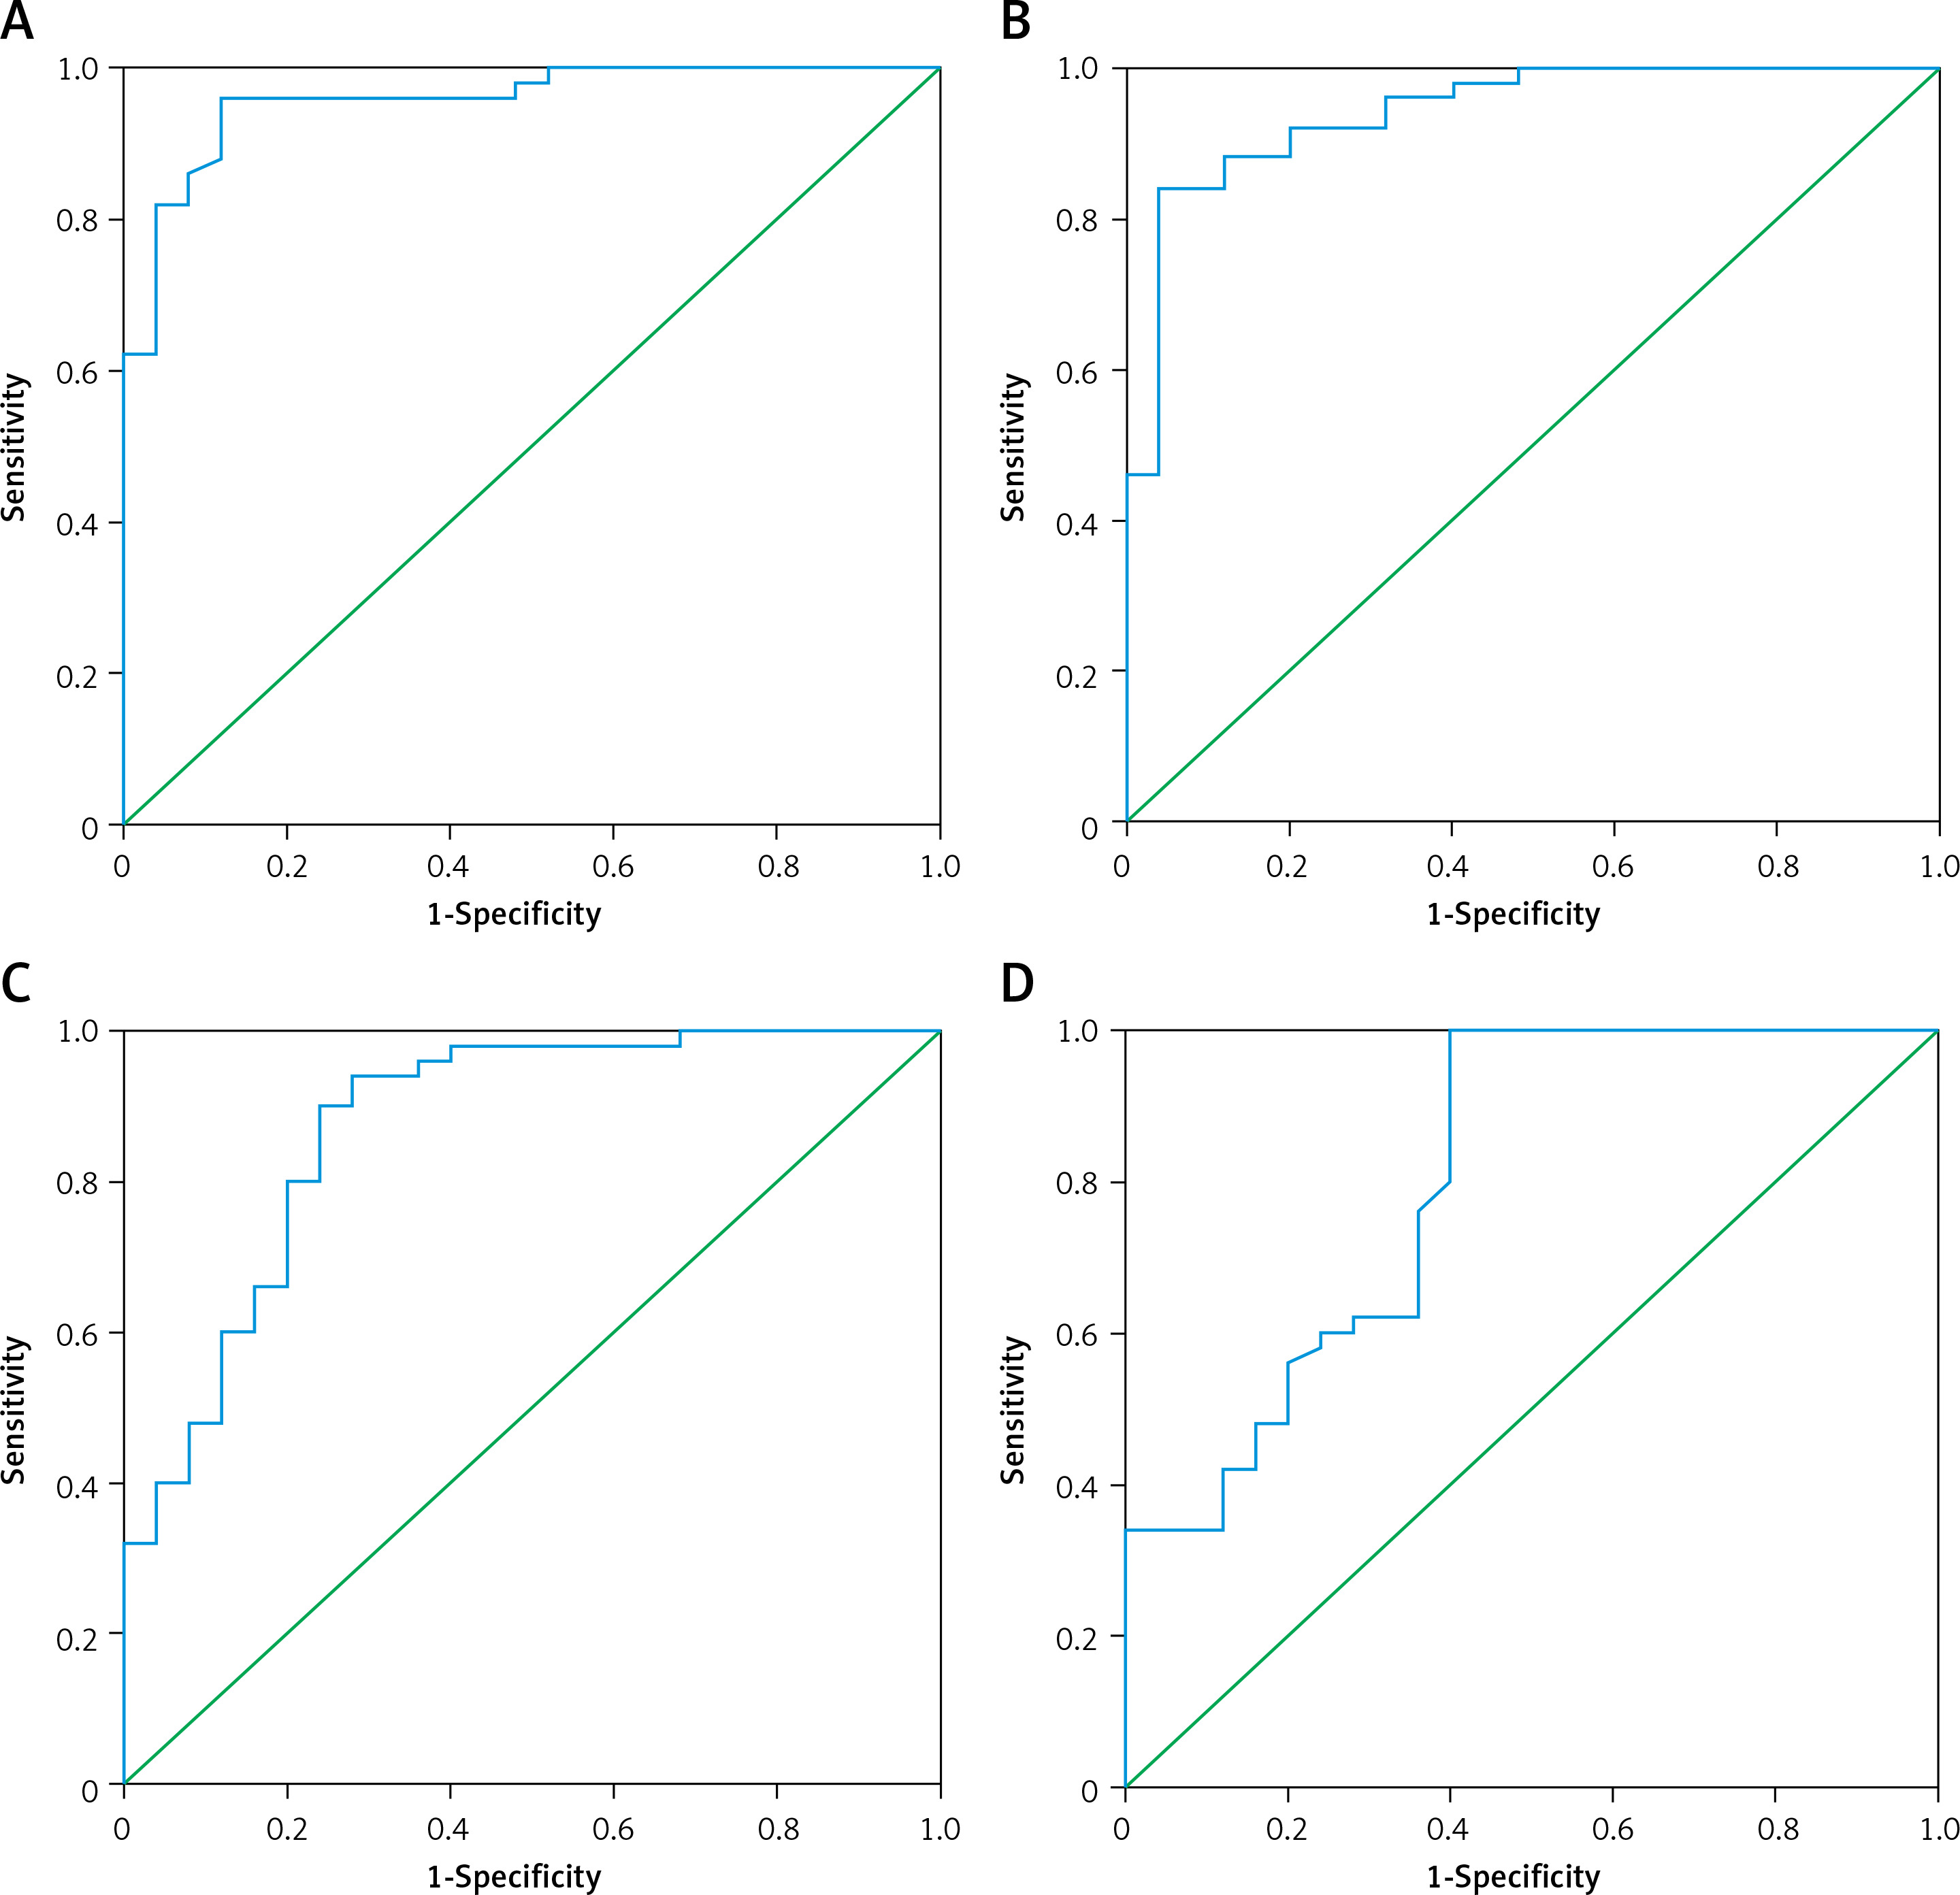
Figure 2
ROC curve analysis for miR-877 and histidine-rich glycoprotein (HRG) in preeclampsia (PE). A – The cutoff for placental miR-877 level was 0.144 (area under the curve [AUC] = 0.957, 95% confidence interval (CI): 0.914–1.000, p < 0.01). B – The cutoff for serum miR-877 level was 0.147 (AUC = 0.942, 95% CI: 0.888–0.995, p < 0.01). C – The cutoff for placental HRG level was 7.4 pg/mg (AUC = 0.874, 95% CI: 0.786–0.963, p < 0.01). D – The cutoff for serum HRG level was 74.75 pg/ml (AUC = 0.804, 95% CI: 0.693–0.916, p < 0.01)
Histidine-rich glycoprotein levels
To assess HRG levels between the PE and control groups, ROC curve analysis was conducted, and the optimal cutoff for placental HRG level was determined to be 7.4 pg/mg (AUC = 0.874) (Figure 2 C). The placental HRG level was significantly higher in patients with severe PE (14.5 ± 4.8 pg/mg) than in the control group (p = 0.001). However, there was no significant difference between severe and mild PE groups (p > 0.05). Additionally, serum HRG levels were investigated, and the optimal cutoff of 74.75 pg/ml (AUC = 0.804) was determined for discriminating the PE group from the control group using the ROC curve (Figure 2 D). The serum HRG level was the highest in the control group (mean ± SD: 69.5 ± 18.5 pg/ml), with a highly significant difference observed between the study groups (p < 0.001) (Table III). The findings showed that patients with severe PE had elevated placental HRG and lower serum HRG levels compared with the control group.
Performance characteristics of miR-877 and HRG in the serum and placental tissue of patients with preeclampsia
Relative quantification (RQ) of miR-877 and HRG was performed using qRT-PCR and ELISA to evaluate their performance characteristics in placental and serum samples of patients with PE. In placental tissue samples, RQ of miR-877 revealed 96% sensitivity, 88% specificity, 91.6% negative predictive value (NPV), 94.1% positive predictive value (PPV), and 93.3% accuracy. Furthermore, RQ of HRG revealed 94% sensitivity, 72% specificity, 85.7% NPV, 87% PPV, and 86.7% accuracy. The combination of both biomarkers increased the sensitivity to 98% (Table IV).
Table IV
Performance characteristics of miR-877 and histidine-rich glycoprotein (HRG) in serum and placental tissue of PE patients
In serum samples, RQ of miR-877 demonstrated 84% sensitivity, 96% specificity, 75% NPV, 97.6% PPV, and 88% accuracy. Meanwhile, RQ of HRG revealed 100% sensitivity, 60% specificity, 100% NPV, 83.3% PPV, and 86.7% accuracy. The combination of both markers in the serum or placenta showed 100% sensitivity. miR-877 detection alone in the serum or placenta showed the highest accuracy. These results indicated that miR-877 is a highly effective biomarker for detecting PE, particularly when used in conjunction with HRG.
Correlation between assessed biomarkers and clinical parameters
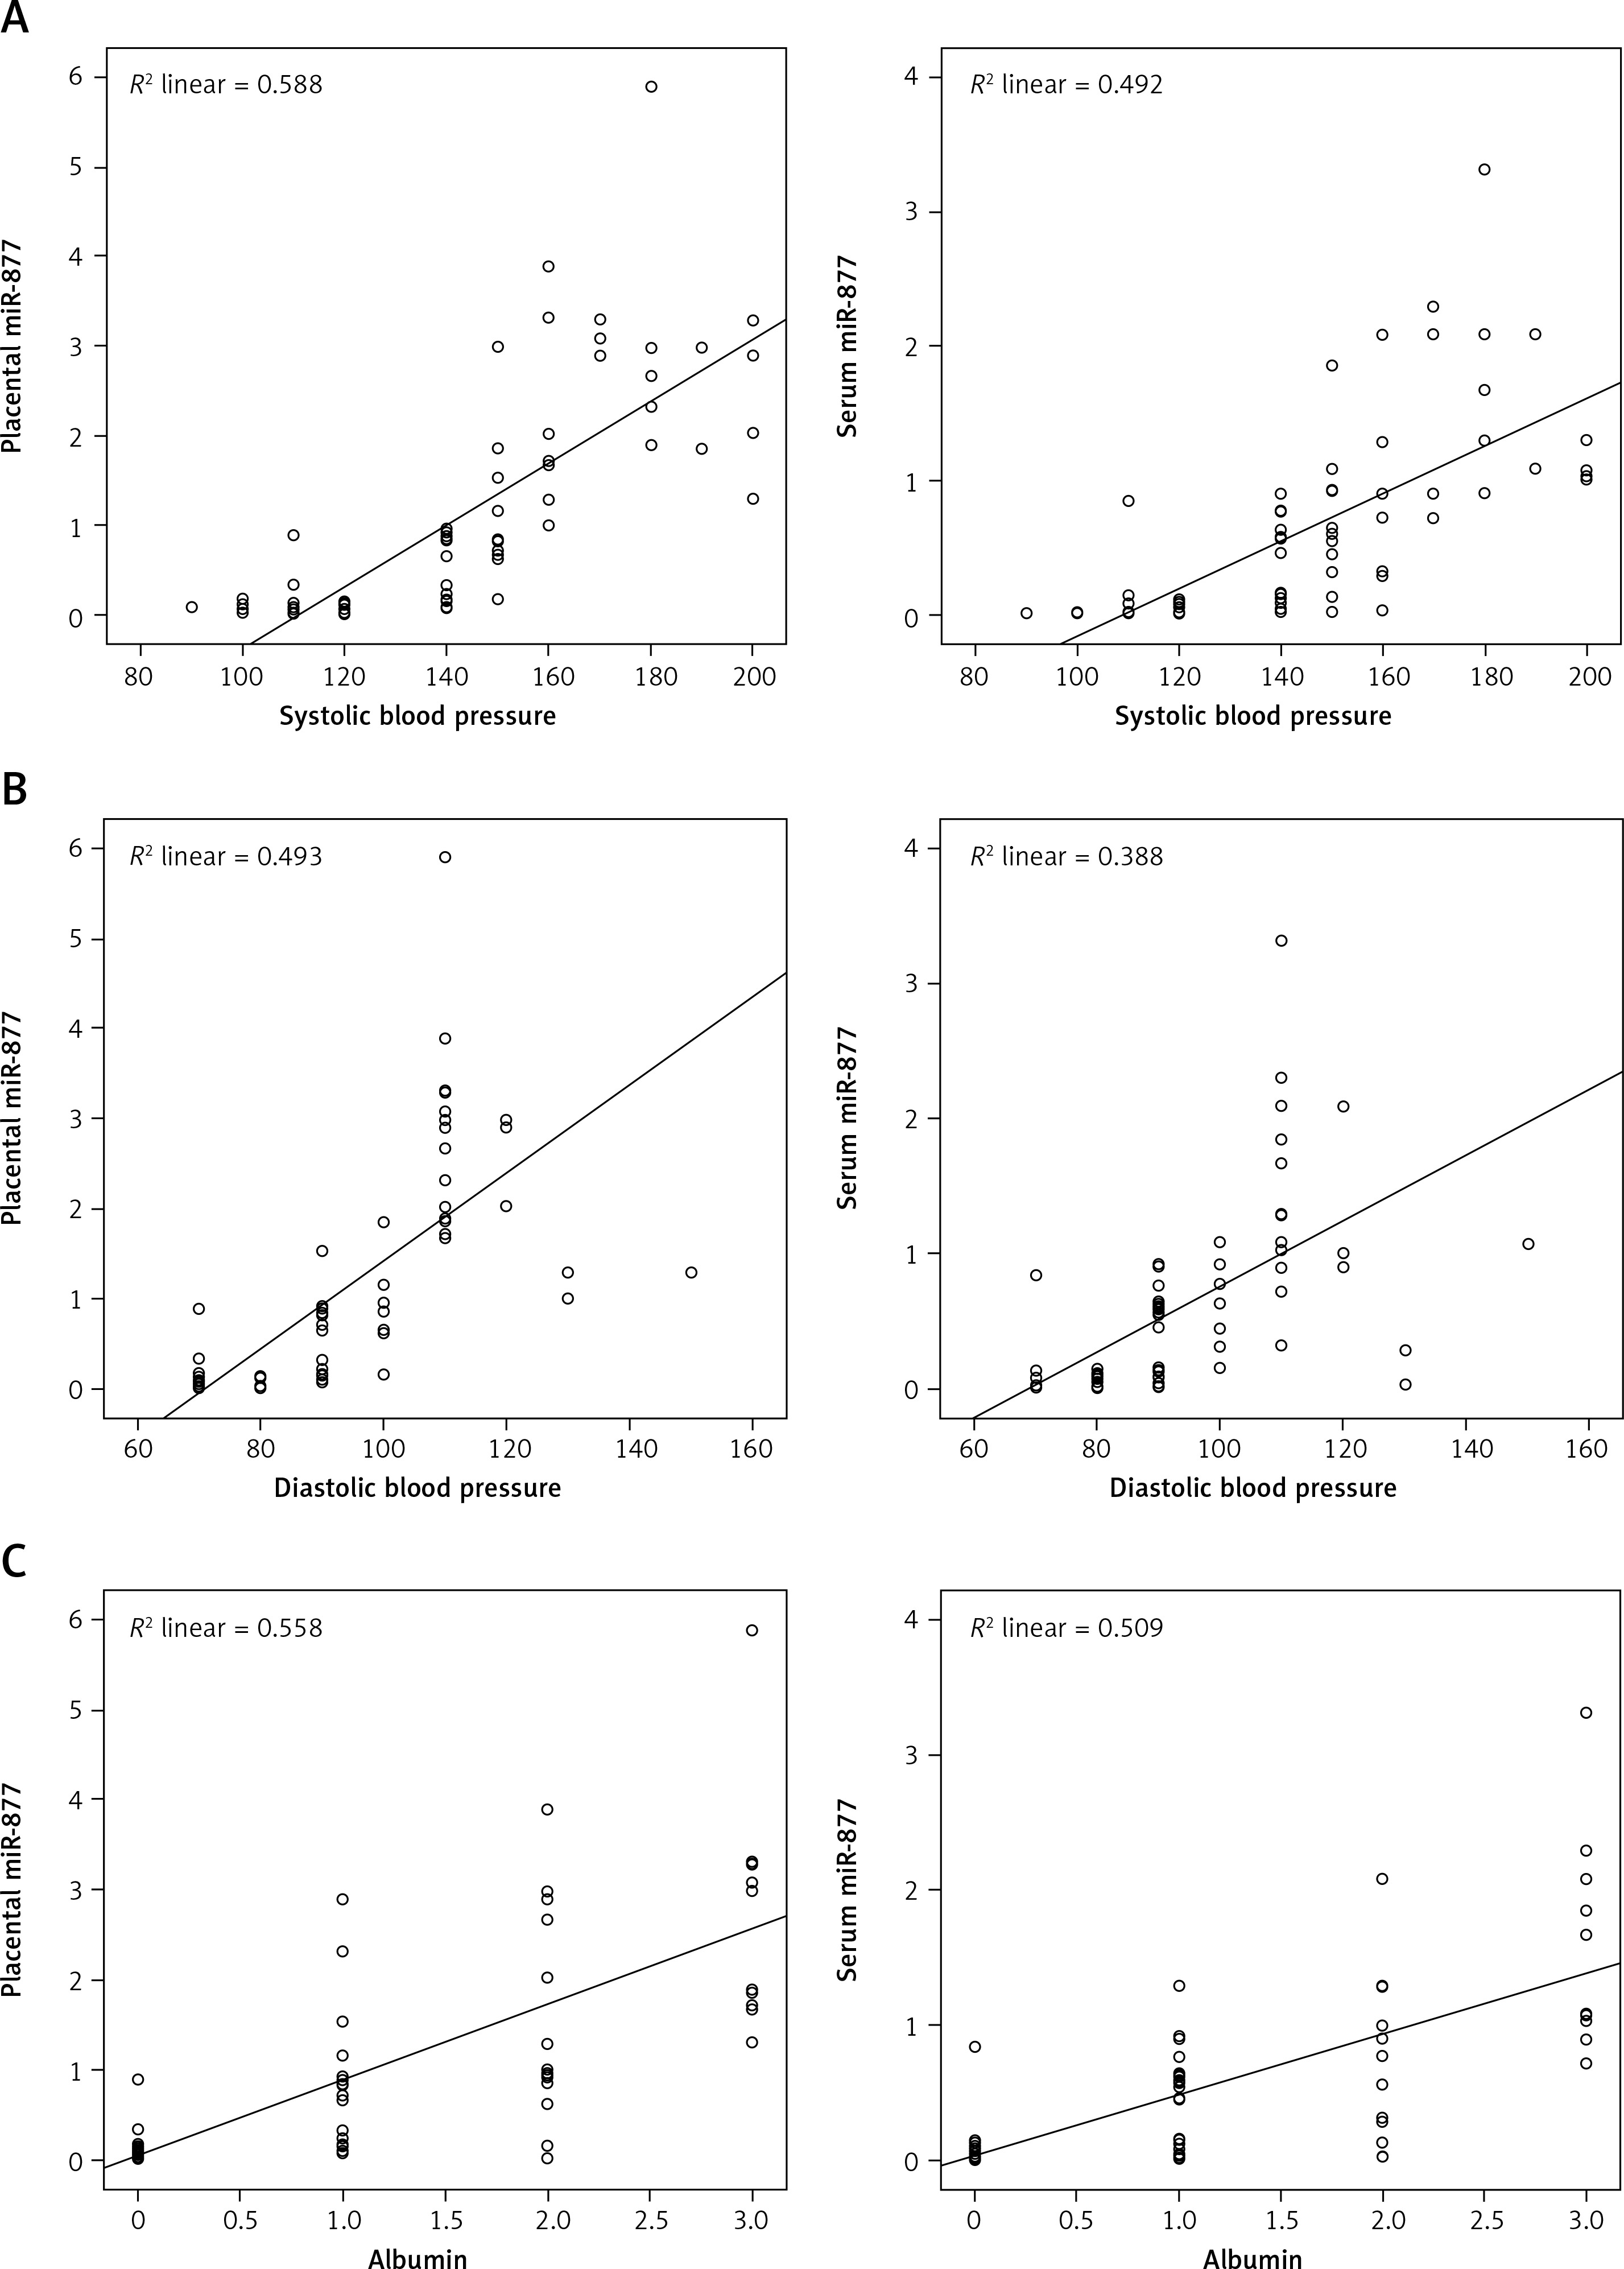
Correlation analysis was conducted between the two biomarkers – miR-877 and HRG – and various clinical parameters such as systolic and diastolic blood pressure level, urinary albumin level, gestational age, and birth weight among the different study groups. Spearman’s test revealed that serum miR-877 level showed a noticeable positive correlation with placental miR-877 (r = 0.893) and HRG (r = 0.538) levels as well as a highly significant negative correlation with serum HRG level (r = –0.456) (p < 0.01). Spearman’s test results indicated a highly significant positive correlation of miR-877 placental and serum levels with systolic blood pressure level (r = 0.864 and 0.809), diastolic blood pressure level (r = 0.859 and 0.785), and urinary albumin level (r = 0.815 and 0.783, respectively) (all p < 0.01). This suggests that higher levels of miR-877 are associated with more severe manifestations of PE.
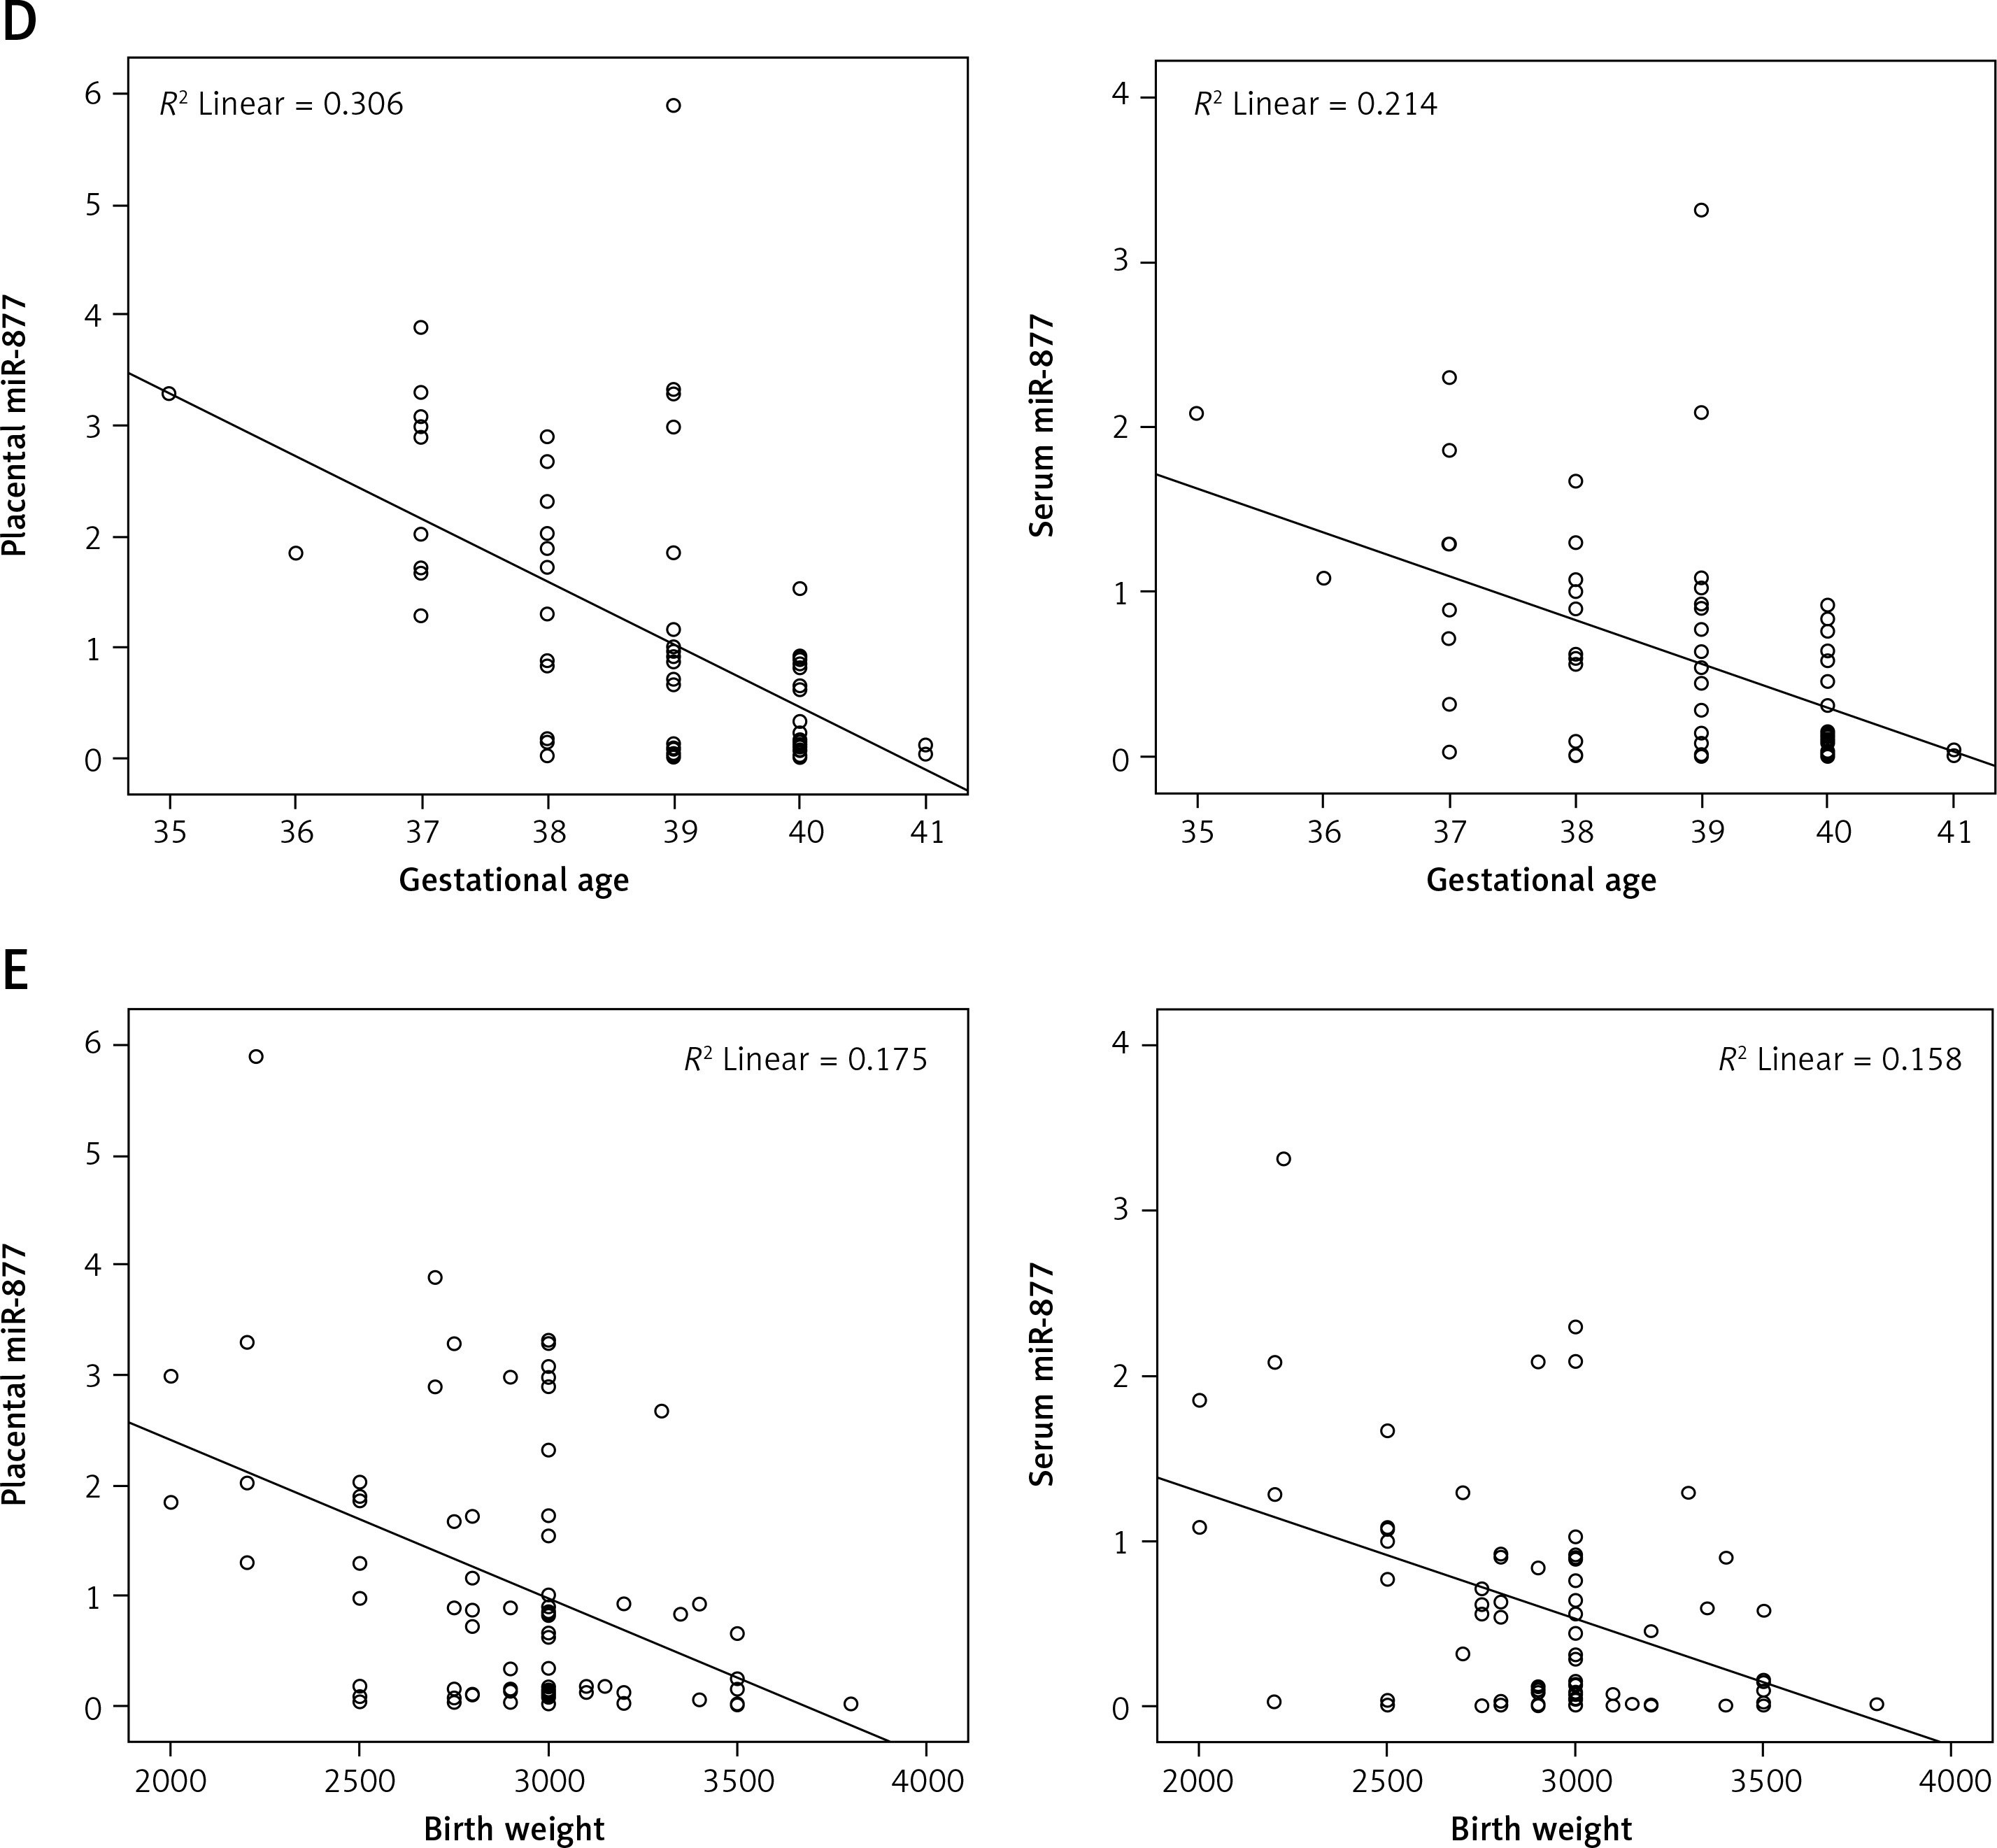
Conversely, the results revealed a significant negative correlation of miR-877 placental and serum levels with gestational age (r = –0.565 and –0.484) and birth weight (r = –0.383 and –0.306, respectively) (all p < 0.01) (Table V and Figure 3 A–E). This indicates that higher miR-877 levels are associated with lower gestational age and birth weight.
Table V
Correlation between investigated biomarkers and clinical data among the different groups of the study
| Spearman’s ρ | Placental miR-877 | Serum miR-877 | Placental HRG | Serum HRG | Systolic blood pressure | Diastolic blood pressure | Albumin in urine | Gestational age (weeks) | Birth weight [g] |
|---|---|---|---|---|---|---|---|---|---|
| Placental miR-877 | |||||||||
| r-value | 1.000 | 0.893 | 0.560 | –0.538 | 0.864 | 0.859 | 0.815 | –0.565 | –0.383 |
| p-value | – | 0.001** | 0.001** | 0.001** | 0.001** | 0.001** | 0.001** | 0.001** | 0.001** |
| Serum miR-877 | |||||||||
| r-value | 0.893 | 1.000 | 0.538 | –0.456 | 0.809 | 0.785 | 0.783 | –0.484 | –0.306 |
| p-value | 0.001** | – | 0.001** | 0.001** | 0.001** | 0.001** | 0.001** | 0.001** | 0.008* |
| Placental HRG | |||||||||
| r-value | 0.560 | 0.538 | 1.000 | –0.236 | 0.545 | 0.576 | 0.509 | –0.302 | –0182 |
| p-value | 0.001** | 0.001** | – | 0.042* | 0.001** | 0.001** | 0.001** | 0.008** | 0.118 |
| Serum HRG | |||||||||
| r-value | –0.538 | –0.456 | –0.236 | 1.000 | –0.582 | –0.558 | –0.550 | 0.265 | 0.275 |
| p-value | 0.001** | 0.001** | 0.042* | – | 0.001** | 0.001* | 0.001** | 0.022* | 0.017* |
Figure 3
Scatter plot for correlation analysis of placental and serum miR-877 expression with clinical parameters in the study groups. Placental and serum miR-877 levels revealed a highly significant positive correlation with (A) systolic blood pressure level, (B) diastolic blood pressure level, and (C) urinary albumin level as well as a highly significant negative correlation with (D) gestational age and (E) birth weight
Additionally, Spearman’s test revealed a highly significant positive correlation of placental HRG level with systolic blood pressure level (r = 0.545), diastolic blood pressure level (r = 0.576), and urinary albumin level (r = 0.509). These findings are similar to those for miR-877, suggesting HRG involvement in severe PE. A highly significant negative correlation was observed between placental HRG level and gestational age (r = –0.302, p < 0.01), with no significant correlation observed with birth weight (p > 0.05). Spearman’s test revealed a significant negative correlation of serum HRG level with systolic blood pressure level (r = –0.582), diastolic blood pressure level (r = –0.558), and urinary albumin level (r = –0.550) (p < 0.01). These results indicate that lower serum HRG levels are associated with more severe PE symptoms. Moreover, serum HRG levels showed a significant positive correlation with gestational age (r = 0.265) and birth weight (r = 0.275) (p < 0.05). Therefore, the differential expression of HRG levels in the serum and placenta are significant independent predictors of PE risk.
Furthermore, regression analysis revealed that HRG levels in the serum and placenta, after identifying the cutoff, were significant independent predictors of PE risk (p < 0.05) (Table VI). These results suggested that miR-877 and HRG can be used as biomarkers for assessing the severity of PE, with their levels correlating with key clinical parameters.
Table VI
Predictive power of histidine-rich glycoprotein (HRG) level for development of pre-eclampsia by logistic regression analysis
Discussion
Preeclampsia, a hypertensive disorder, accounts for 26% of maternal deaths in low-income and 16% in high-income countries [32]. Preeclampsia is linked to ethnicity and race, highlighting the need for early diagnostic biomarkers [33]. Previous studies have investigated HRG’s role in PE [7, 34, 35], and several studies have compared miRNA dysregulation between patients with PE and healthy pregnant controls [23, 36]. Among the miRNAs, miR-210 and miR-155 have been extensively studied as potential biomarkers for PE [37]. This study assessed the role of miR-877, as it is the highest-ranked miRNA targeting HRG in PE.
Initially, different qualitative and quantitative clinical parameters were assessed in pregnant women diagnosed with PE and healthy controls. In the current study, the BMI patterns were comparable between the PE and control groups, and most participants were overweight or obese. A meta-analysis showed that BMI can be a predictive factor because of its strong association with PE [38]. Infants delivered by patients with PE in our study had lower birth weights than those delivered by the controls, indicating that early hypertensive symptoms can impact fetal development and newborn survival [39, 40]. Additionally, this study showed significant differences in systolic and diastolic blood pressure levels between the PE and control groups, which was expected because hypertension is the primary indicator of PE.
Numerous bioinformatics analyses have revealed that miR-877 is linked to many genes involved in cancer, apoptosis, angiogenesis, and proliferation-related pathways [25, 41]. A previous study revealed that various miRNAs, including miR-877, are differentially expressed in PE, suggesting their involvement in the molecular mechanisms of the disease [24]. Our findings demonstrated significant upregulation of miR-877 in placental and serum samples in patients with PE, particularly in severe cases, which aligns with the hypothesis that miR-877 plays a role in the progression of PE. Therefore, the role of miR-877 in the transcriptional regulation of critical genes, such as HRG, a gene responsible for angiogenesis and PE coagulation imbalance, was explored in this study [34]. The current study presents an integrated validation of miR-877 and HRG expression in placental tissues and serum samples of patients with PE. ELISA was performed for HRG quantification owing to its ability to provide quantitative protein measurements. Moreover, qRT-PCR was selected for miRNA analysis because of its high sensitivity and specificity.
During normal pregnancy, the vascular endothelial cell surface is thromboresistant, conferring protection against clot formation. However, in PE, endothelial cell dysfunction leads to altered local anticoagulant activity, resulting in enhanced clot formation and disturbances in coagulation and fibrinolytic systems [42]. In general, the plasma fibrinogen level increases in healthy females during pregnancy; however, in patients with PE, the fibrinogen level is even higher [34]. Fibrinogen interacts with HRG, a protein involved in hemostasis and the angiogenic pathway. During PE, changes in the angiogenic/antiangiogenic pathway and coagulation/fibrinolysis system cause the activated vascular endothelium to elicit a widespread inflammatory response within blood vessels. HRG acts as a negative acute-phase reactant because plasma levels are reduced in response to tissue injury. HRG, produced by liver cells, is abundant in the plasma, circulates as a free protein, and is released upon thrombin stimulation [43]. Therefore, HRG interacts with coagulation and fibrinolytic systems, and its altered levels during PE may reflect changes in these pathways, contributing to the hypercoagulable state associated with PE. The current study supports this fact by highlighting the dysregulation of miR-877 and its potential impact on HRG levels, potentially influencing PE pathogenesis through effects on coagulation and angiogenesis. Additionally, these findings underscore the importance of further research to elucidate the precise mechanisms by which miR-877 and HRG contribute to the development and progression of PE.
Several studies have used next-generation sequencing (NGS) to identify miRNAs associated with PE. A previous meta-analysis evaluated the diagnostic and predictive effects of circulating miRNAs in PE [44]. Techniques such as qRT-PCR and microarray analysis have been used to profile miRNA expression in pregnancy-related body fluids and tissues [45]. Mavreli et al. [46] reported that downregulation of the levels of two specific miRNAs – miR-99b-5p and miR-23b-5p – in first-trimester maternal plasma is associated with the subsequent development of late-onset PE. Considering the potential role that miR-877 plays in the pathology of PE, future studies should conduct screening for miR-877 expression across various gestational stages using NGS, allowing greater confidence in conclusions regarding differential expression. By incorporating placental samples from different gestational stages, our understanding of the temporal expression of miR-877 can be expanded. Additionally, future studies could employ in situ hybridization to investigate the spatiotemporal expression of miR-877 in placental tissue. This would provide valuable insights into its localization and function within the placenta [47]. These approaches may help delineate miR-877 expression patterns and regulatory mechanisms in PE, potentially improving management and outcomes for pregnant women and their fetuses.
In this study, increased miR-877 expression in placental and serum samples correlated with the severity of PE. Additionally, serum HRG levels were significantly affected by PE, correlating with the severity of the disorder, as explored in several studies. Bolin et al. [8] reported that patients with PE had decreased circulating HRG levels compared with control participants, which aligns with the findings of the current study. In contrast, another study revealed no significant difference in HRG levels between PE and control groups [7, 8, 48]. Meanwhile, Kårehed et al. [34] reported high placental HRG levels in the PE group, and this increase in HRG levels was associated with the severity of PE. The presence of HRG in placental tissue results from the penetration of serum HRG into the reproductive tract [49]. In this study, the placental HRG level was significantly higher in the PE group than in the control group, which emphasizes its potential role in disease pathogenesis. However, this higher level of HRG could not significantly differentiate mild PE from severe PE, which may be due to the small sample size.
The predictive values generated from the abovementioned characteristic test revealed high reliability of miR-877 and HRG as biomarkers. Although there were some variations in specificity between miR-877 and HRG, the combined biomarkers emphasize the cooperative role of miR-877 and HRG in distinguishing patients with PE from healthy pregnancies. A similar study applied a combination of two parameters, HRG and uterine artery pulsatility index, in PE prediction [7]. This study revealed similar positive and negative correlations of the clinical parameters with miR-877 and HRG levels. These findings reflect the association of miR-877 and HRG biomarkers with the clinical characteristics of PE, highlighting the potential role of miR-877 in regulating HRG expression in PE. Therefore, dysregulation of miR-877 expression may affect the synthesis of HRG in the liver, reducing its concentration in the serum. Furthermore, the decrease in serum HRG levels due to hypercoagulability and angiogenic imbalance could justify the increase in HRG levels in placental tissue.
Although this study offers valuable insights into the roles of miR-877 and HRG in the pathogenesis of PE within the study population, these findings may not be directly applicable to all populations. Therefore, external validation of our findings in a larger, more diverse cohort is essential to confirm the utility of miR-877 and HRG as clinical biomarkers for PE. Such validation studies should involve multiple centers from different geographic regions to capture a broader range of ethnic and socioeconomic backgrounds, thereby enhancing the generalizability of the results. Additionally, the small sample size of patients and controls was a limitation. Further studies with larger sample sizes would enhance the reliability and statistical power of these biomarkers for the diagnosis, prognosis, and monitoring of PE. Further investigations are warranted to obtain a clear understanding of the association between miR-877 and its potential target gene HRG.
In conclusion, this study illustrated the role of miR-877 dysregulation in PE and the impact of miR-877 and HRG on the severity of PE. The similarity between miR-877 and HRG expression patterns emphasizes the relationship between the two biomarkers in distinguishing patients with PE from healthy participants. Additionally, these patterns could aid in distinguishing severe PE from mild PE cases. Therefore, these findings contribute to our understanding of PE pathogenesis and demonstrate that miR-877 and HRG can be used as novel potential diagnostic and prognostic biomarkers or even therapeutic targets in PE. Considering the complexity of PE pathogenesis, future studies should explore specific molecular interactions and pathways involving miR-877 and HRG. These studies should include in vitro and in vivo experiments to investigate the effects of miR-877 and HRG modulation on endothelial cell function, trophoblast invasion, and angiogenesis. Furthermore, comparing the levels of these two biomarkers between nonpregnant women and healthy pregnant women may provide further insights into the specificity of these biomarkers for PE and their potential roles in normal pregnancy physiology.