Iron is crucial for host immunity and hemoglobin (Hb) synthesis. The ability to fight an infection and provide aerobic metabolism is especially important for sepsis patients; however, iron is also used by certain bacteria and fungi for growth. Bacteria evolved transport systems for both free iron and its organic forms [1]. Therefore iron concentration has to be kept at optimal levels in sepsis patients.
Ferritin and transferrin, used in standard iron tests, are acute phase proteins and cannot be used for accurate iron deficiency (ID)/ID anemia (IDA) diagnosis in critically ill patients with systemic inflammation [2]; therefore there are no reliable data regarding prevalence of ID/IDA in sepsis patients.
The aim of the study was to determine the prevalence of ID/IDA in patients with sepsis or septic shock hospitalized in the intensive care unit (ICU) using new laboratory biomarkers devoid of aforementioned limitations, namely reticulocyte (Ret) Hb equivalent (Ret-He) and hepcidin (Hep) concentration.
Methods
This prospective clinical study was carried out in a 10-bed mixed medical-surgical ICU between September 24th 2021 and August 31st 2022. We enrolled consecutive patients diagnosed with sepsis or septic shock using the third international definition and appropriate diagnostic criteria [3]. Additionally procalcitonin (PCT) was used to improve the accuracy of sepsis diagnosis. We set the PCT cut-off value at > 0.5 ng/ml, as it has been shown that with lower concentrations systemic infection is unlikely [4].
The detailed description of the methodology is covered in Appendix 1.
Results
We analyzed data of 90 study subjects. The median age in the study group was 65 (IQR 51–72) years. Acute kidney injury was present in 21% of study subjects, and 11% required renal replacement therapy. Common anatomical sites of infection were pulmonary (36%), abdominal (21%), and urinary (21%).
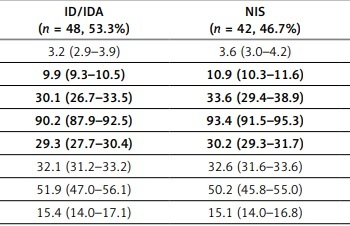
There were 6 (6.7%) study subjects diagnosed with ID and 42 (46.7%) with IDA. Comparison of hematological indices and Hep concentration in patients with ID/IDA and normal iron status (NIS) is presented in Table I. Ret-He in the ID/IDA and NIS group was 26.5 (IQR 25.6–27.3) and 33.4 (IQR 32.7–34.1) pg, respectively (p < 0.01). Statistically significant differences between ID/IDA and NIS groups were noted for Hb, hematocrit, mean corpuscular volume (MCV), mean cell Hb, percentage and number of Rets. AUROCs for these hematological parameters in prediction of ID/IDA were 0.64–0.69. The most accurate in this context was number of Rets, with AUROC of 0.69 (95% CI: 0.58–0.78, p < 0.01) and the optimal cut-off value at ≤ 0.07 106/µl.
Table I
Hematological indices and hepcidin concentration in the study subjects with and without iron deficiency/iron deficiency anemia
The difference in Hep concentration between ID/IDA and NIS groups was close to statistical significance; therefore we decided to analyze this biomarker in the separate subgroups of ID and IDA patients. A significant difference in Hep concentration was noted only between IDA and NIS patients (Me 750 (IQR 413–22870) vs. Me 1184 (IQR 664–2462) pg/ml, p = 0.05). AUROC for Hep concentration in prediction of IDA was 0.62 (95% CI: 0.51–0.72, p = 0.049), with the optimal cut-off value at ≤ 493 pg/ml. Comparison of hematological indices and Hep concentration in ID and IDA groups is presented in Table II. RBCs, Hb, and hematocrit were significantly lower in the IDA compared to the ID group (p for all < 0.01).
Table II
Hematological indices and hepcidin concentration in the study subjects with iron deficiency and iron deficiency anemia
Discussion
Diagnosis of ID/IDA in our study was based on Ret-He. Different Ret-He cut-off values have been used for diagnosis of IDA in the past: 25 [5], 28 [6], 29 [7], and 30 [8] pg. We decided to use as the cut-off the lower limit of the local laboratory reference range (i.e. < 30.2 pg) as our intention was to identify even mild ID. Based on our diagnostic approach we identified high prevalence of ID/IDA in sepsis patients hospitalized in the ICU – 53.3%. The only study that used Ret-He for ID diagnosis in the ICU was carried out in a general ICU population. The reported ID prevalence was 37% [9]. This result was lower than in our study, but the cut-off value used was also lower (< 28 vs. < 30.2 pg).
Another new biomarker that we researched was Hep. There is however no gold standard method for measuring Hep concentration and there is no standard reference. Moreover, Olinder et al. observed variability in Hep concentration over the first 4 days of hospitalization in the ICU and a negative correlation with Ret-He [10]. Despite the enthusiastic approach towards Hep exploitation, the wide array of clinical conditions influencing its levels may limit its value as an IDA biomarker. In order to compare Hep concentrations obtained in our study to the results of other authors we searched for studies that used the ELISA test for Hep determination. In the study investigating Hep concentration in patients with hepatitis C virus (HCV) infection, the authors reported median baseline Hep concentration of 75 pg/ml in the study group and 60 pg/ml in the control group [11]. The results obtained in our study were much higher than those obtained in patients with HCV or healthy controls. In the study performed in an inflammatory bowel disease population, mean Hep concentration in ulcerative colitis and Crohn’s disease patients was 4090 ±1005 pg/ml and 3798 ±1337 pg/ml, respectively [12]. This result on the other hand was much higher than that obtained in our study; however, concentrations in our study were in the wide range 32.0–32,628.6 pg/ml.
Our study is not without limitations. The first limitation is the number of study subjects. However, we performed a posteriori power calculations for a sample size and we discovered that we would require a minimum of 86 patients to verify the differences in values between NIS, ID, or IDA, with an α ≤ 0.05 and a β 0.20. Therefore, we consider that our sample size is sufficient to draw conclusions, and our study was not underpowered. The other limitation is the fact that ID/IDA diagnosis was not confirmed by the diagnostic gold standard – staining of a bone marrow sample with Prussian blue [13]. However, this method is highly invasive and routine aspiration of the bone marrow is rarely performed. Lastly we did not analyze markers of hemolysis, which could have had an impact on Ret number.
In conclusion, based on Ret-He, approximately half of sepsis patients hospitalized in the ICU may have either ID or IDA. Number of Rets may be used for diagnosis of ID/IDA when Ret-He is not available. Hepcidin concentration seems to be a poor predictor of IDA in sepsis patients.