Introduction
Sepsis is a life-threatening condition characterized by organ dysfunction resulting from a dysregulated host response to infection [1]. It remains a major public health challenge and is a leading cause of mortality among critically ill patients in the intensive care unit (ICU) [2]. Sepsis affects more than 19 million people worldwide each year, with a persistently high mortality rate [3]. Effective prognosis improvement can be achieved by accurately identifying the pathogen and administering targeted antibiotics [4]. Rapid microbiological techniques, such as blood culture, play a crucial role in identifying sepsis pathogens [5]. These results can guide timely adjustments to antimicrobial therapies, enhancing patient outcomes, reducing hospital stays, and minimizing healthcare costs [5].
Most sepsis cases are found to have bacterial origins, according to existing studies [6]. Blood cultures are used to distinguish between culture-positive sepsis (CPS) and culture-negative sepsis (CNS), based on pathogen detection within 24 h before or after ICU admission [7]. CNS refers to sepsis cases where no causative organism is detected within this time frame, while CPS indicates the presence of identifiable pathogens [1]. The relationship between blood culture results and patient prognosis is debated, with mixed conclusions in current literature [2]. Kim et al. suggest a possible association between culture-negative sepsis and organ dysfunction, although the data do not indicate a significant association between blood culture results and sepsis mortality [8]. Conversely, Hazwani et al. reported lower mortality rates and reduced organ dysfunction among culture-negative sepsis patients [9]. Meanwhile, Baker et al. found that patients in the CPS and CNS groups exhibited similar symptoms upon admission and received comparable treatments [10].
Among studies to date, sepsis research has predominantly focused on CPS, with fewer investigations into CNS. However, CNS comprises 28–49% of sepsis cases [8], making it a significant subset. Due to the absence of clear pathogenic diagnoses, CNS patients often miss out on targeted antibiotic treatments, potentially resulting in higher morbidity, mortality, and prolonged hospital stays [11, 12]. Additionally, the empirical use of broad-spectrum antibiotics for CNS patients can elevate the risk of antibiotic resistance and complicate treatment [11]. CNS cases may involve diverse pathogens such as viruses, fungi, and parasites or even non-infectious factors such as autoimmune disorders and drug reactions [1]. Understanding the prognosis and underlying factors of CNS can shed light on sepsis etiology and mechanisms, paving the way for broader therapeutic strategies and improved patient management.
Several factors influence ICU mortality in sepsis patients, with blood culture results being just one aspect [1]. Accurate prediction of high-risk patients can aid clinicians in assessing disease severity, optimizing treatment, and reducing poor outcomes [3]. In recent years, machine learning (ML) has been increasingly applied to sepsis research [13]. Persson et al. developed a high-performing ML algorithm for sepsis prediction using routine ICU data [14], while Yao et al. demonstrated that the XGB model excelled at predicting in-hospital mortality for postoperative sepsis patients [15]. Zhou et al. created an ML-based mortality prediction model for S-AKI patients, with the CatBoost model showing the best predictive results [16]. Yang et al. highlighted the superior predictive performance of XGB and random forest models for predicting sepsis onset [17].
Identifying high-risk subgroups is essential for managing CPS and CNS patients and improving their prognosis, with machine learning playing a key role in this process [14–17]. However, existing models have limitations, as most research focuses on CPS, with limited analysis of ICU mortality risk factors in CNS patients. This gap exists for several reasons. First, identifying the infection source is more straightforward in CPS, while it is often challenging in CNS cases [11, 12]. Second, positive bacterial cultures provide reliable results, whereas negative cultures can be affected by factors such as improper sampling or prior antibiotic use [1]. Consequently, CNS studies are more complex and may yield less consistent conclusions compared to CPS. Additionally, CPS treatment is more targeted, whereas CNS patients typically receive broad-spectrum antibiotics based on clinical judgment [1]. Lastly, CNS patients are more heterogeneous due to the involvement of various pathogens or non-infectious causes, complicating their analysis and treatment.
Given these limitations in mortality prediction for sepsis patients and the potential of machine learning in healthcare, there is a pressing need to develop predictive models that evaluate risk factors for both CPS and CNS patients. This study aimed to identify in-ICU mortality risk factors, compare the prognostic differences between CPS and CNS patients, and create predictive models using machine learning techniques.
Material and methods
Sources of data
This study was conducted based on clinical records of sepsis patients who meet the diagnostic criteria of the Sepsis-3 definition obtained from the Medical Information Mart for Intensive Care database-IV version 0.4 (MIMIC-IV v0.4). The MIMIC-IV database is a freely accessible critical care database released by the Laboratory for Computational Physiology at the Massachusetts Institute of Technology [18]. Detailed descriptions of this database are available in the literature [18].
Study population
In this study, sepsis was defined according to the Third International Consensus Definitions [1]. The selection of study samples was based on the following inclusion and exclusion criteria.
Inclusion criteria: (1) patients diagnosed with sepsis: diagnosed according to the Sepsis 3.0 criteria, i.e., infection + Sequential Organ Failure Assessment (SOFA) score ≥ 2, or patients diagnosed with sepsis in discharge diagnosis according to ICD-9.0; (2) age ≥ 18 years old; (3) stayed in ICU for more than 24 h; (4) microbial cultures performed within 24 h before and after ICU admission.
Exclusion criteria: (1) patients diagnosed with sepsis after 24 h of ICU admission; (2) patients with multiple ICU admissions were only included based on their first ICU admission information; (3) patients with microbial culture results indicating fungal or viral infections were excluded.
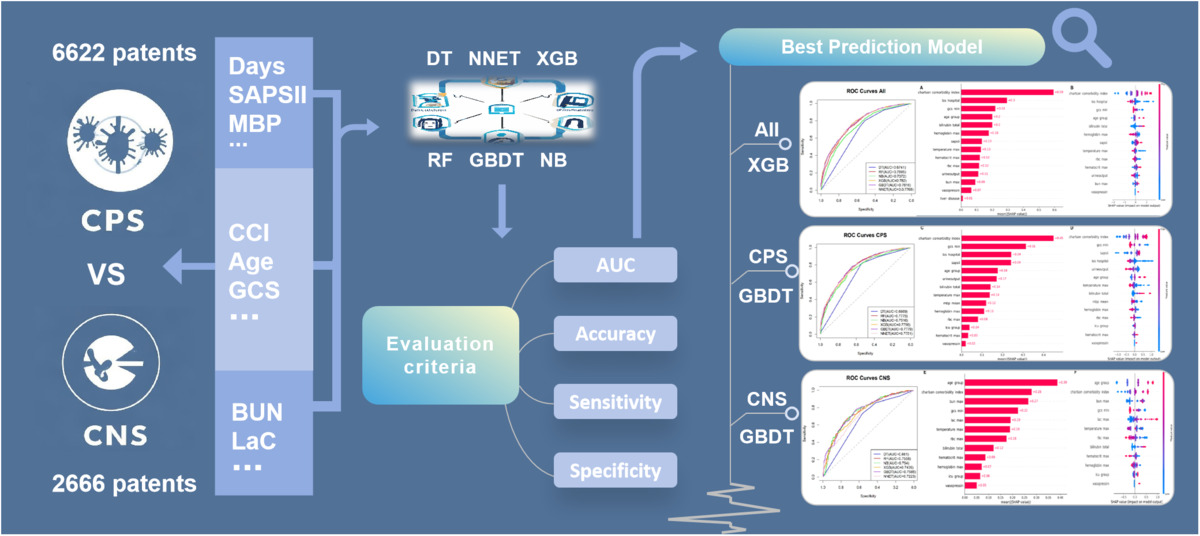
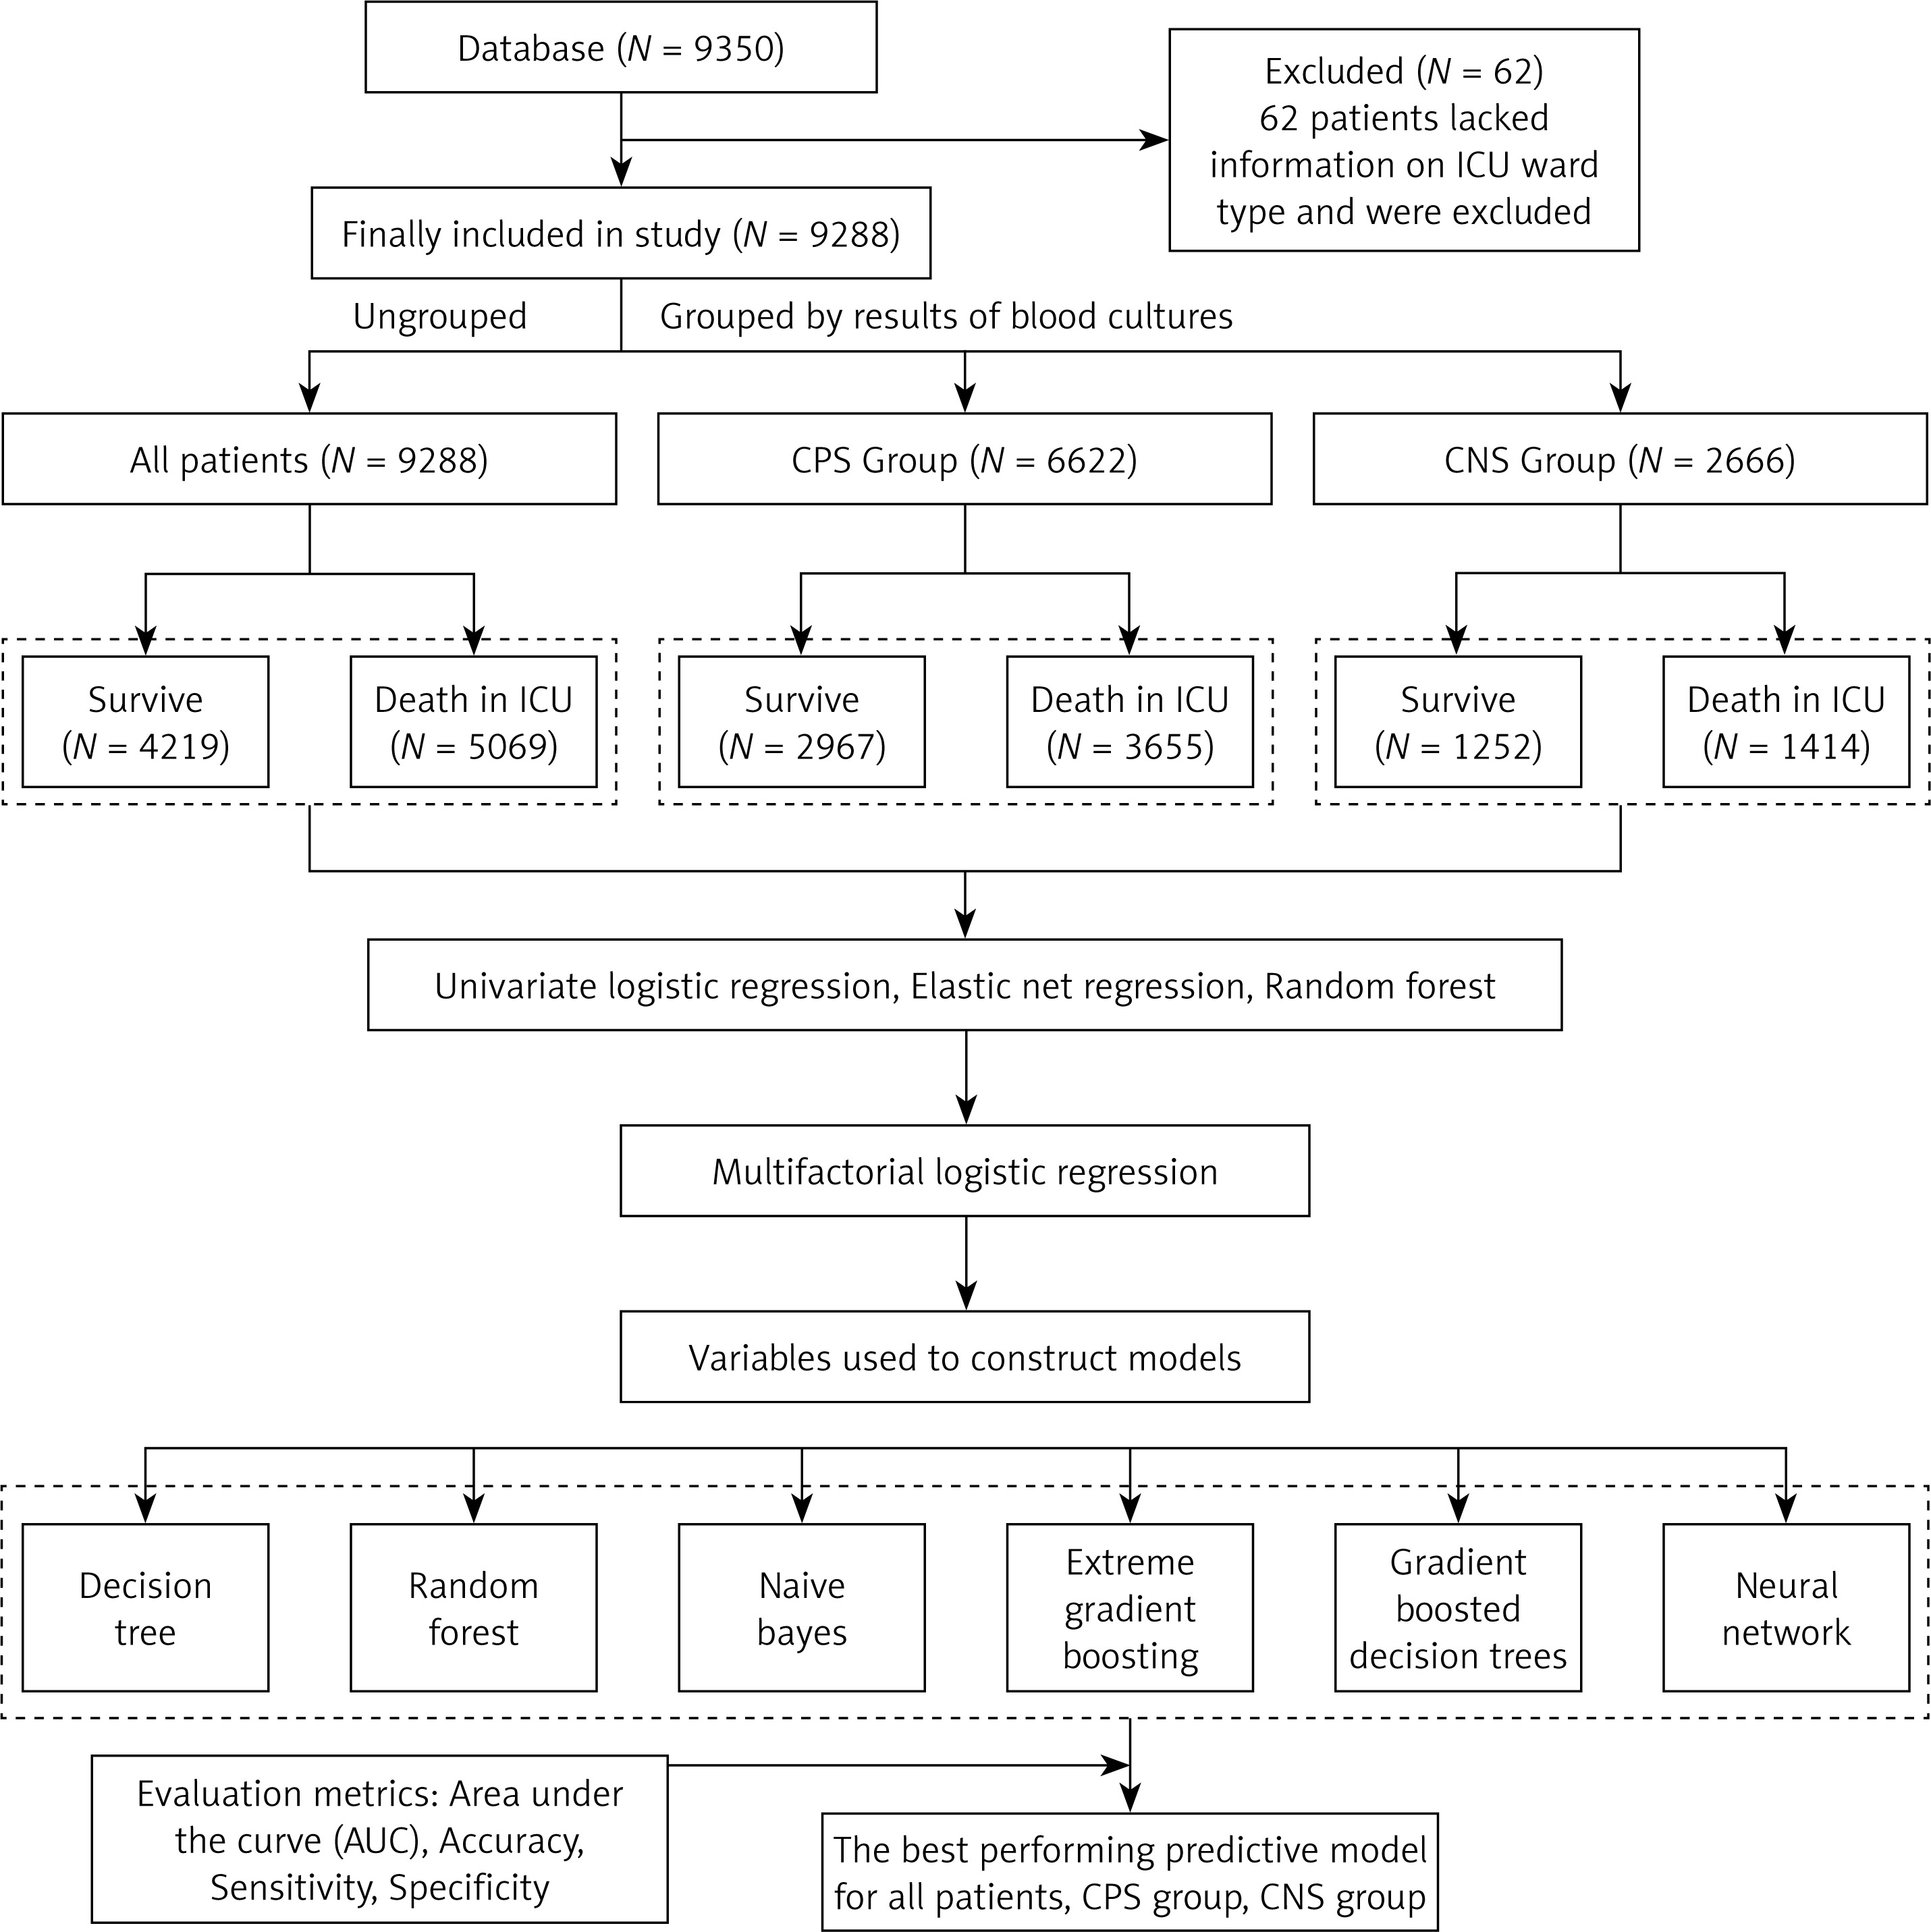
A total of 9350 patients from MIMIC-IV met the inclusion and exclusion criteria. Among them, 62 patients lacked information on ICU ward type and were excluded. Consequently, a total of 9288 patients were included in the study, with 6622 (71.30%) cases in the CPS group and 2666 (28.70%) cases in the CNS group (Figure 1).
Study outcome
The primary outcome event of this study, based on its significance, is in-ICU death of the selected septic patients.
Data pre-processing
Variables with ≥ 30% missingness were excluded from the analysis. Multiple imputation was performed on the remaining missing variables. To further validate the robustness of the interpolation method, we used the “mice” package nested in the R programming language to generate five interpolation datasets using the multiple interpolation technique for variables containing missing values, and trained the machine learning model on each of the interpolation datasets separately to obtain the prediction results. Then the interpolated datasets were integrated using the pool function to achieve the final dataset for analysis. Multiple interpolation effectively reduces the error due to missing data by generating multiple datasets and integrating the interpolation uncertainty. We also transformed the continuous factor age in the database into an ordered factor age group. We recorded all cases of patients who had received vasopressin or ventilation or dialysis as 1. (The filtered variables and variable missingness rates are shown in Supplementary Table SI.)
Variable selection
To capture a broader range of variables associated with in-ICU death in the analysis, the following steps were taken. Firstly, we used three methods for factor screening in the training set [19], combining their results: (a) Univariate logistic regression (LR): each factor was analyzed individually, and factors with a two-tailed p < 0.05 were selected. (b) Elastic net regression: this regularized method optimized model complexity to identify important, sparse sets of factors [20]. (c) Random forest: feature importance was assessed using the Gini index to measure the contribution of each factor. Secondly, we fit a multifactorial logistic regression model with the selected variables. Then, the variables with p < 0.05 in multifactorial logistic regression were screened in conjunction with clinical significance. In addition, the above steps of screening variables were repeatedly conducted for the whole study sample, as well as the CPS and CNS subgroups. Finally, the valid variables identified from the overall sample, CPS group, and CNS group were input into the corresponding six machine learning models for each group.
Statistical analysis
Descriptive analysis was performed on all included patients. Continuous variables conforming to a normal distribution were described using means ± standard deviations (SD). Skewed continuous variables were described using medians (interquartile ranges), and categorical variables were described using frequencies (proportions).
The datasets for the overall sample, CPS, and CNS were randomly sampled using the R programming language, and all were randomly divided into a training set and a test set in a ratio of 7 : 3. The training sets were used for selecting variables and building models, and the test sets were used for validation.
Six machine learning methods – Decision Tree (DT), Random Forest (RF), Naive Bayes (NB), Extreme gradient boosting (XGB), Gradient Boosted Decision Trees (GBDT), and Neural Network (NNET) models – were employed to establish predict models. The training and testing process involves 5-fold cross-validation. Subsequently, the accuracy, sensitivity, specificity, and area under the curve (AUC) of the receiver operating characteristic (ROC) curve were compared across the models to evaluate their performance and identify the optimized model for predicting in-ICU mortality of septic patients. In order to compensate for the lack of machine learning algorithms in variable interpretation, we applied SHAP to explain the importance of each feature in the best model.
All statistical analyses were conducted using R programming language (version 4.3.3, the R Foundation, Vienna, Austria) and R Studio software (version 2023.12.1.402,R Studio, PBC, Boston, MA), with R packages including “tidyverse”, “mice”, “rpart”, “dplyr”, “randomForest”, “e1071”, “XGB”, “gbm”, “nnet”, and “shapr”. Statistical significance was decided at a two-sided p-value less than 0.05.
Results
Baseline characteristics
This study included 9288 study participants and 43 variables, covering basic demographic information, laboratory indicators, and comorbidities. Baseline clinical characteristics included ICU ward type, number of days in ICU, pulse, heart rate, temperature, systolic blood pressure, diastolic blood pressure, hemoglobin (Hb), white blood cell (WBC) count, platelet (PLT) count, CCI, SOFA score, SAPSII, etc. Additionally, comorbidities such as diabetes, liver disease, chronic obstructive pulmonary disease, etc., were also incorporated.
Among the 9288 patients included in the study, 5069 patients died in the ICU, with a mortality rate of 54.58%. The CPS group comprised 6622 individuals, among whom 3655 died in the ICU, resulting in a mortality rate of 55.19%. The CNS group consisted of 2666 individuals, with 1414 deaths in the ICU, yielding a mortality rate of 53.04%.
The majority of participants were in the age group of 45 to 79 years (65.20%). There was a slightly different proportion between males and females in the study population, with 57.55% being male and 42.45% female. The majority of patients were of white ethnicity. Chronic lung disease was the most common comorbidity, affecting 1866 out of 9288 (30.60%) septic patients. This was followed by hypertension and liver disease, present in 23.41% and 8.5%, respectively. Selected features of included patients are shown in Table I. This table compares the baseline characteristics of CPS and CNS sepsis patient subgroups in the ICU. Statistically significant differences were observed in age distribution, ethnicity, and ICU ward type (p < 0.05). Severity scores (SOFA, SAPSII) were generally higher for CPS patients, indicating greater illness severity (p < 0.01). CNS patients showed slightly lower mortality rates and were more likely to be in certain ICU wards such as the Coronary Care Unit (CCU) and Trauma and Surgical Intensive Care Unit (TSICU). Both groups had similar comorbidity patterns, but CPS patients required more vasopressin treatment (p < 0.01). Lengths of hospital stay were also significantly different between the groups (p < 0.01).
Table I
Comparison of baseline characteristics between the two subgroups in the ICU
[i] CCU – coronary care unit, CVICU – cardiac vascular intensive care unit, MICU – medical intensive care unit, MICU/SICU – medical/surgical intensive care unit, SICU – surgical intensive care unit, Neuro SICU – neurosurgical intensive care unit, TSICU – trauma surgical intensive care unit, SOFA – Sequential Organ Failure Assessment, SAPSII – Simplified Acute Physiology Score II, CCI – Charlson Comorbidity Index.
Variable selection
The final selection results are illustrated in the Figure below.
Based on the selection results, we considered the following 14 variables for machine learning modeling analysis with the whole study sample, including number of days in hospital, Hb, hematocrit (Hct), temperature, urine output, GCS, CCI, RBC count, SAPSII, alkaline phosphatase (ALP), blood urea nitrogen (BUN), liver disease, vasopressin, and age group.
In addition, we found that BUN and liver disease were not significant, and they were excluded from the analysis of the CPS group, while mean blood pressure (MBP) and ICU ward type were included due to their significance (p < 0.05) in screening stage. Four variables – number of days in hospital, urine output, SAPSII, and liver disease – were not significant in the CNS group and were excluded from its analysis, whereas blood lactic acid (LaC) count and ICU ward type were meaningful variables and included in the modeling analysis of the CNS group.
Model development and validation
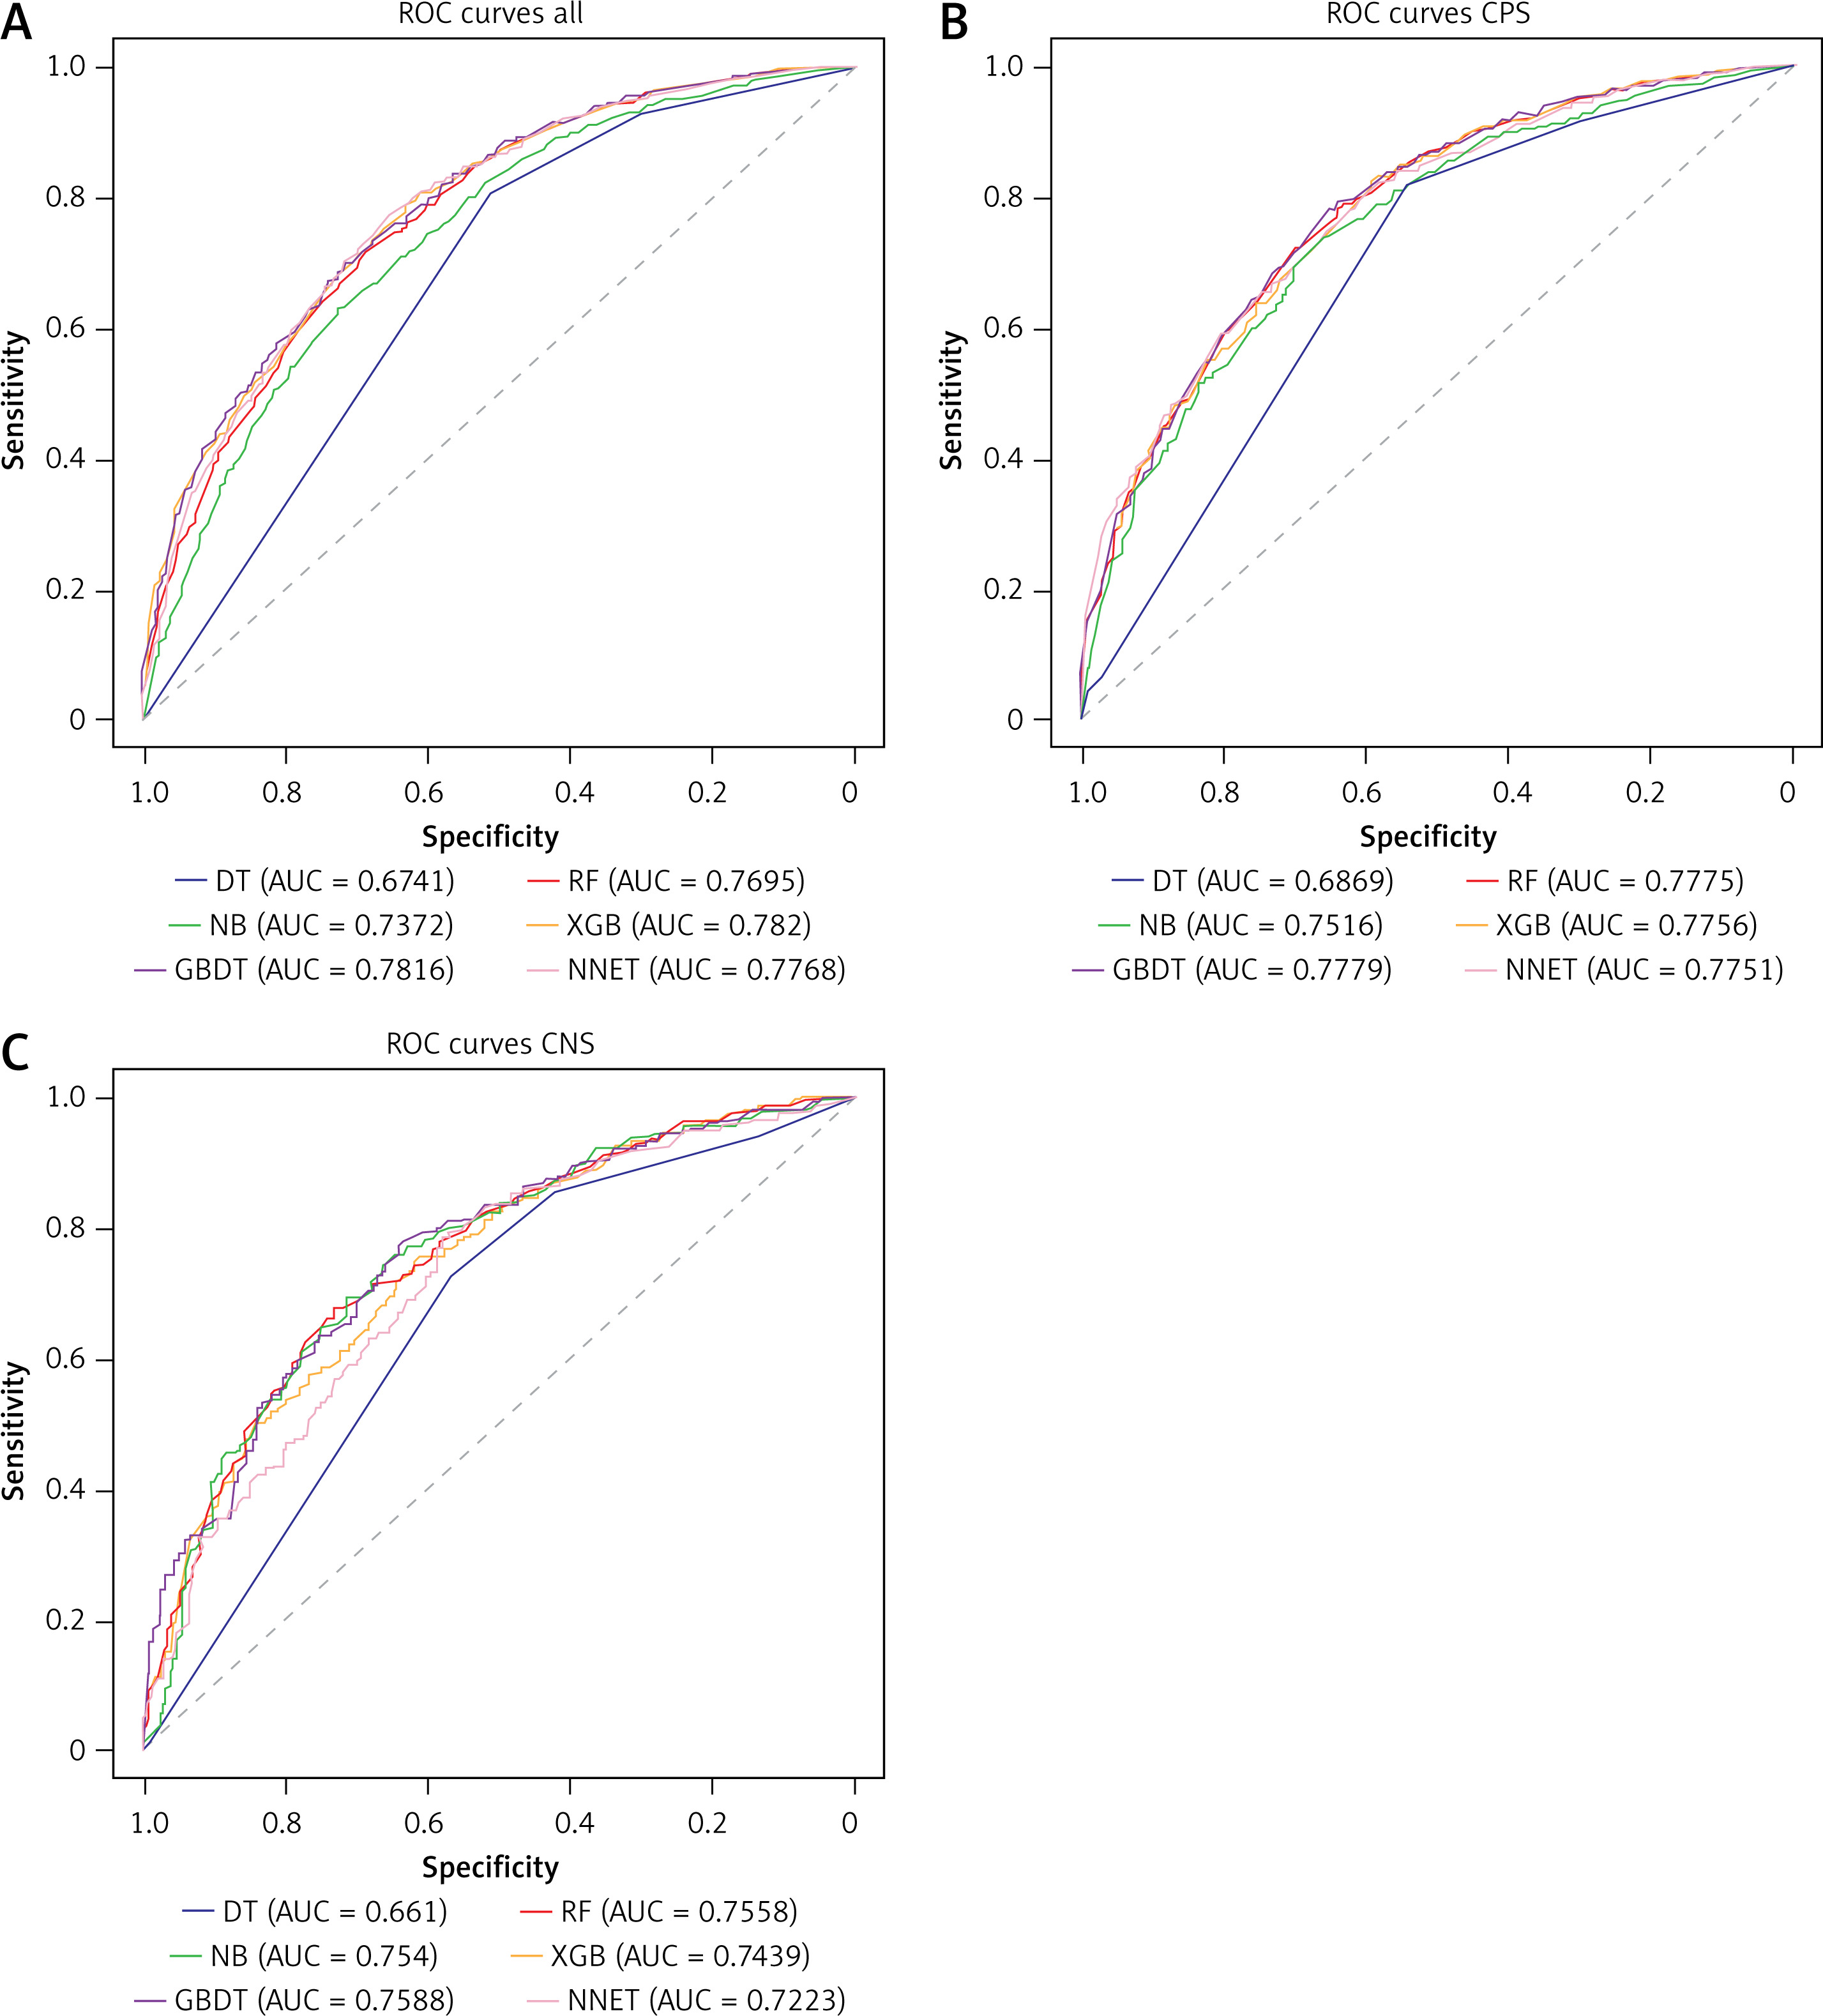
Six machine learning models were constructed to predict the risk of in-ICU mortality among septic patients. We divided datasets into training and test sets in a ratio of 7 : 3, and the prediction results of the six machine learning algorithms based on test sets are shown in Table II. The table describes the prediction performance of the six machine learning models (DT, RF, NB, XGB, GBDT, and NNET) in predicting the in-ICU mortality rate of patients with sepsis, including the CPS and CNS subgroups, which mainly includes accuracy, sensitivity, specificity, and AUC. (The prediction results of the six machine learning models on training sets are shown in Supplementary Table SII.)
Table II
Predictive results of six machine learning models based on test sets for septic patients who died in the ICU
For septic patients (the whole study sample), the XGB model achieved the highest AUC of 0.782, while the AUCs of the remaining five models were lower, with the AUC of the DT model being the lowest at 0.6741. Regarding predictive accuracy, the RF, XGB, GBDT, and NNET models all achieved around 70%, while the DT and the NB achieved the lowest accuracy of around 67%. In terms of sensitivity and specificity, XGB, GBDT, and NNET performed better.
Considering the above four evaluation indicators collectively, the XGB algorithm demonstrated the best predictive performance, followed by the NNET model. Additionally, under the same evaluation indicators, the best prediction model for both the CPS and CNS groups was GBDT. XGB outperformed other models in the overall sample, mainly due to its strong generalization ability and adaptability to large datasets. The superiority of GBDT in the two subgroups of CPS and CNS, on the other hand, may stem from its flexibility and robustness in dealing with small samples and data with large feature differences. The ROC curves for the established models are shown in Figure 2.
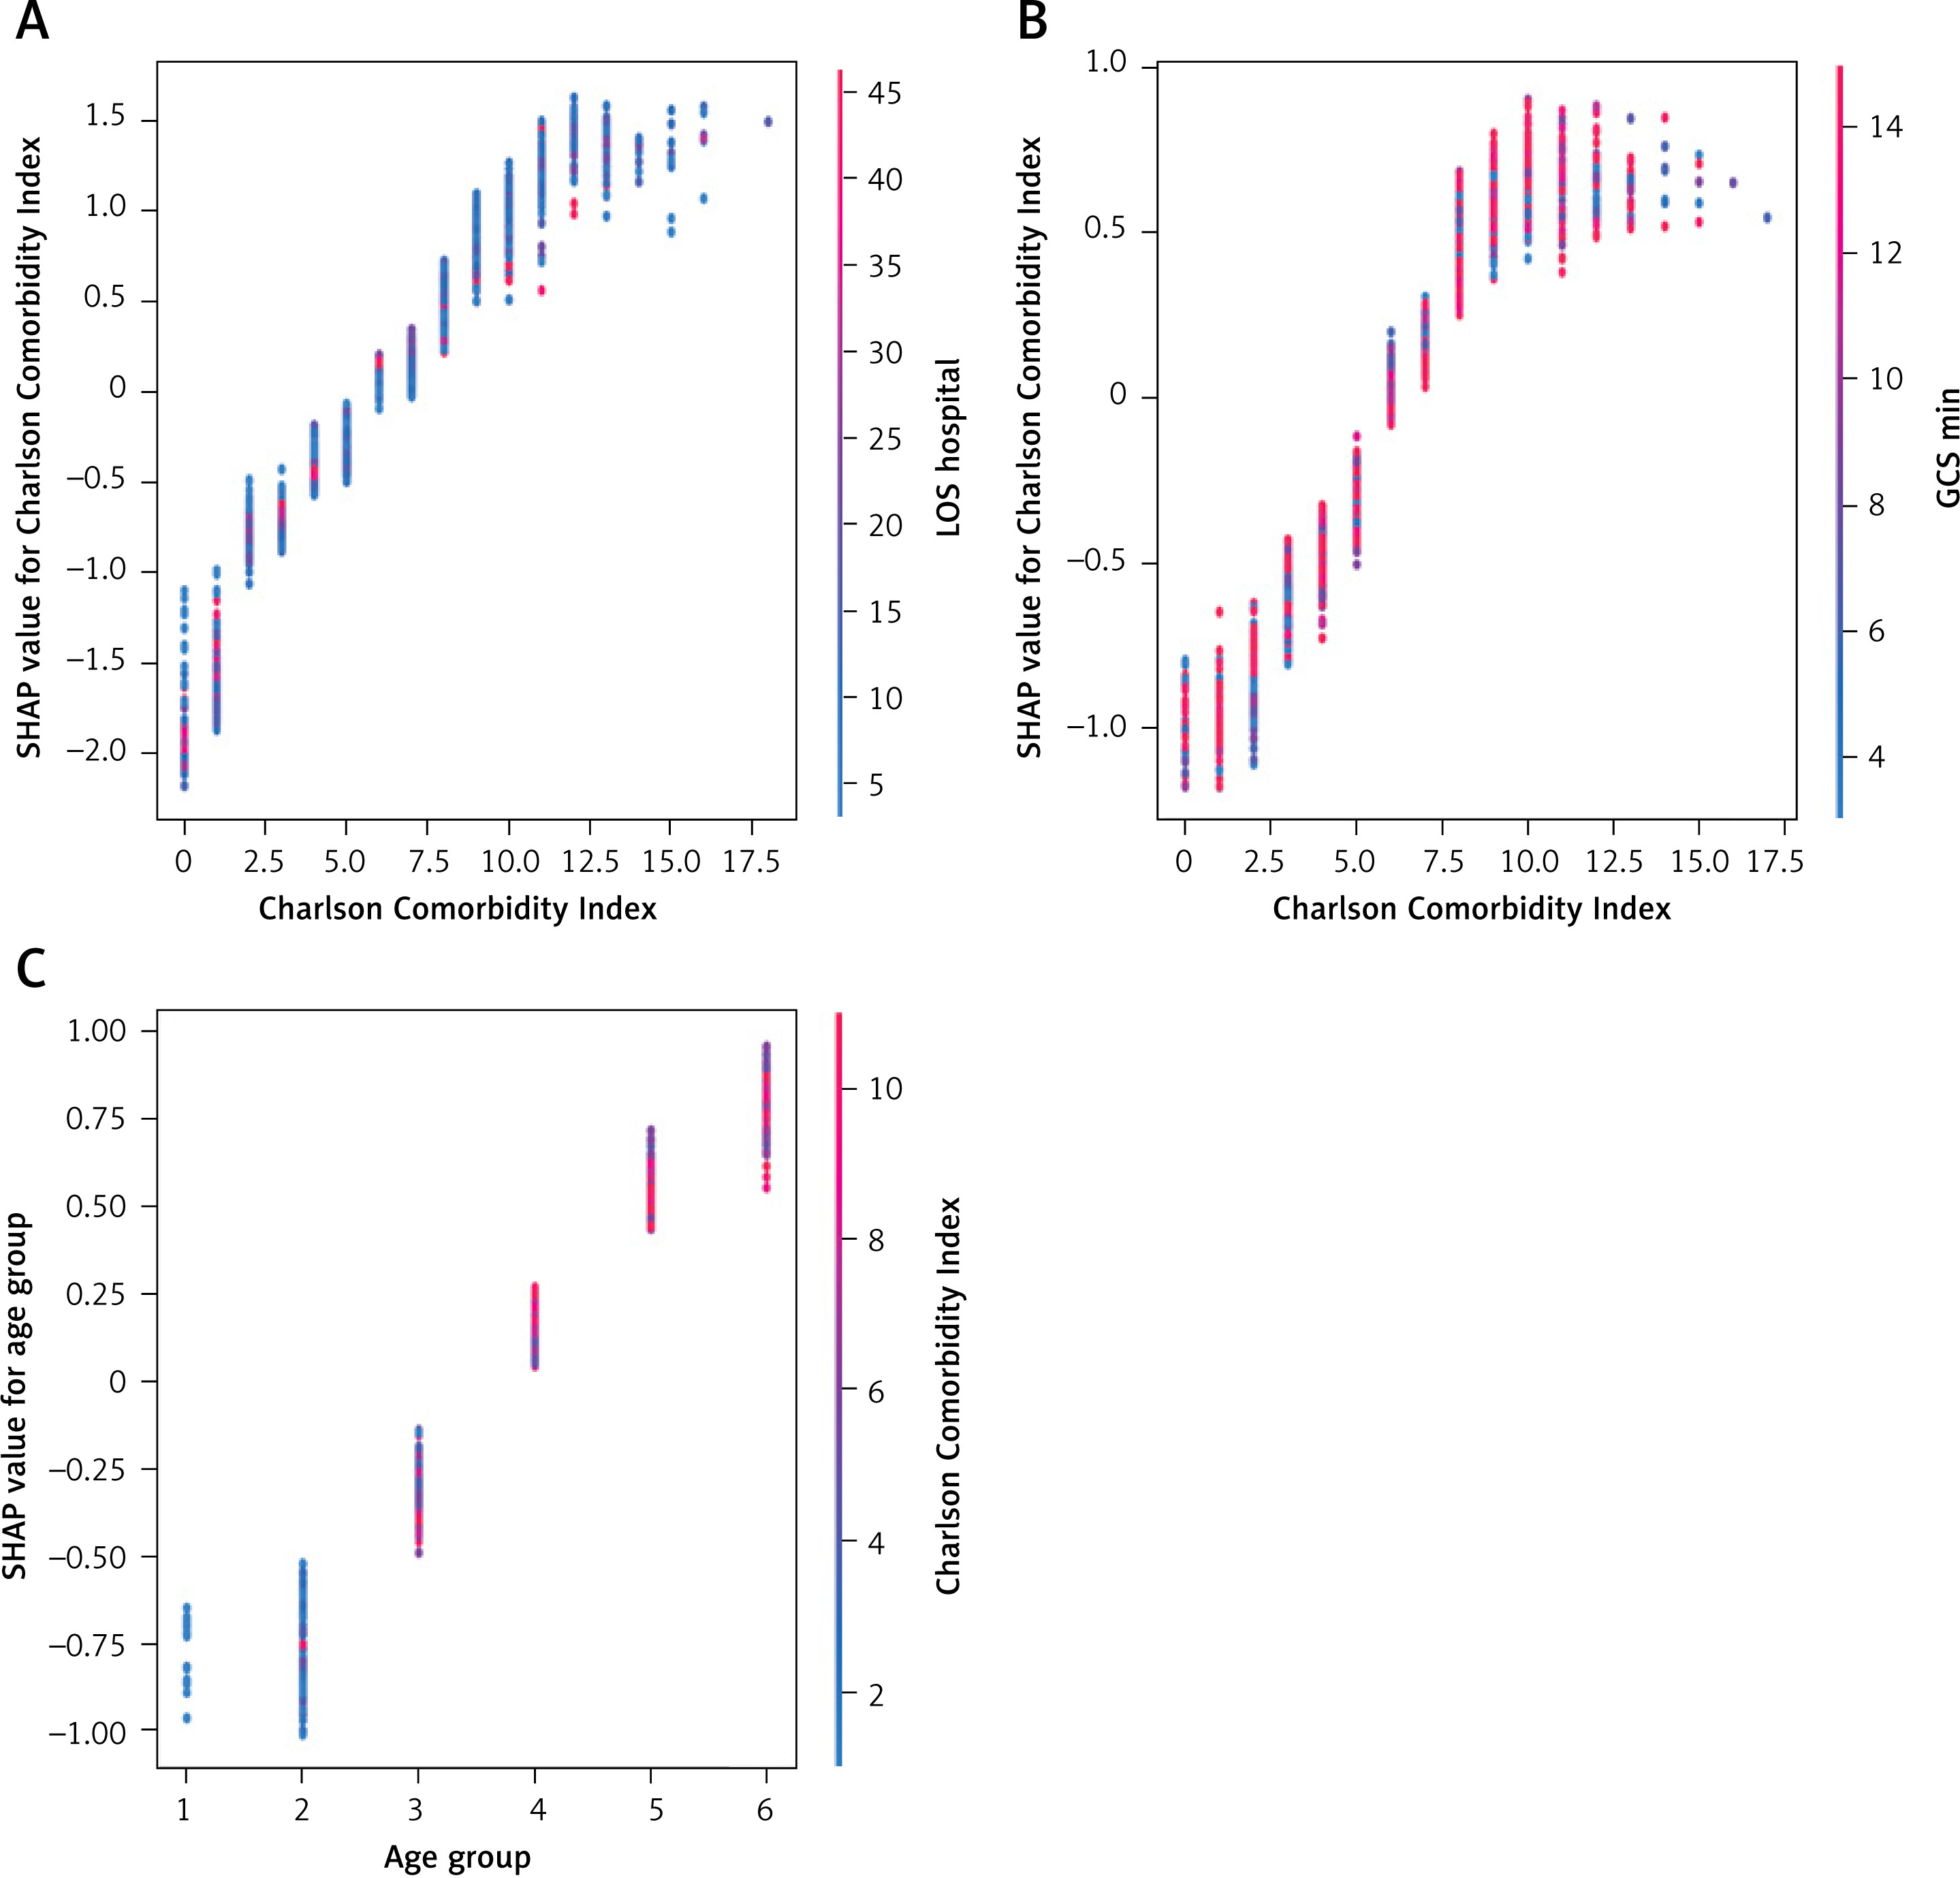
Significance of features
CCI, SAPSII, BUN, liver disease, vasopressin, and age were associated with a higher risk of in-ICU death. As their levels increased, the patient’s risk of death increased. Number of days in hospital, Hb count, temperature, urine output, GCS, and RBC count were associated with lower in-ICU mortality. Patients in Cardiac Vascular Intensive Care Unit (CVICU), Surgical Intensive Care Unit (SICU), and Trauma SICU (TSICU) had a higher risk of in-ICU mortality compared to the Coronary Care Unit (CCU). Risk factors that were the same between the CPS and CNS subgroups were CCI, age, GCS, bilirubin total, temperature, Hb, RBC count, ICU ward type, hematocrit, and vasopressin. In terms of differences between the two subgroups, days of hospitalization, urine output, SAPSII, and MBP were risk factors specific to the CPS group that may lead to an increased risk of death in the ICU, whereas in the CNS group, higher levels of BUN and LaC were specific risk factors (Figures 3 and 4).
Figure 3
Summary of SHAP for the XGB model for all patients, the GBDT model for the CPS group, and the GBDT for the CNS group. A – Feature importance from the XGB model of all patients. Feature importance is represented by the absolute mean of the SHAP values for each feature. B – The higher the SHAP feature value, the higher the risk of death in the ICU for patients with sepsis. A point created in the model represents a characteristic attribute value for 1 patient, so that there is a point on each characteristic line for each patient. The points are colored according to the characteristic value of the corresponding patient and vertically cumulated to describe the density. Red color indicates higher eigenvalues and blue color indicates lower eigenvalues. C – Feature importance from the GBDT model of the CPS group. Feature importance is represented by the absolute mean of the SHAP values for each feature. D – The higher the SHAP feature value, the greater the risk of death in the ICU for CPS patients E – Feature importance from the GBDT model of the CNS group. Feature importance is represented by the absolute mean of the SHAP values for each feature. F – The higher the SHAP feature value, the greater the risk of death in the ICU for CNS patients
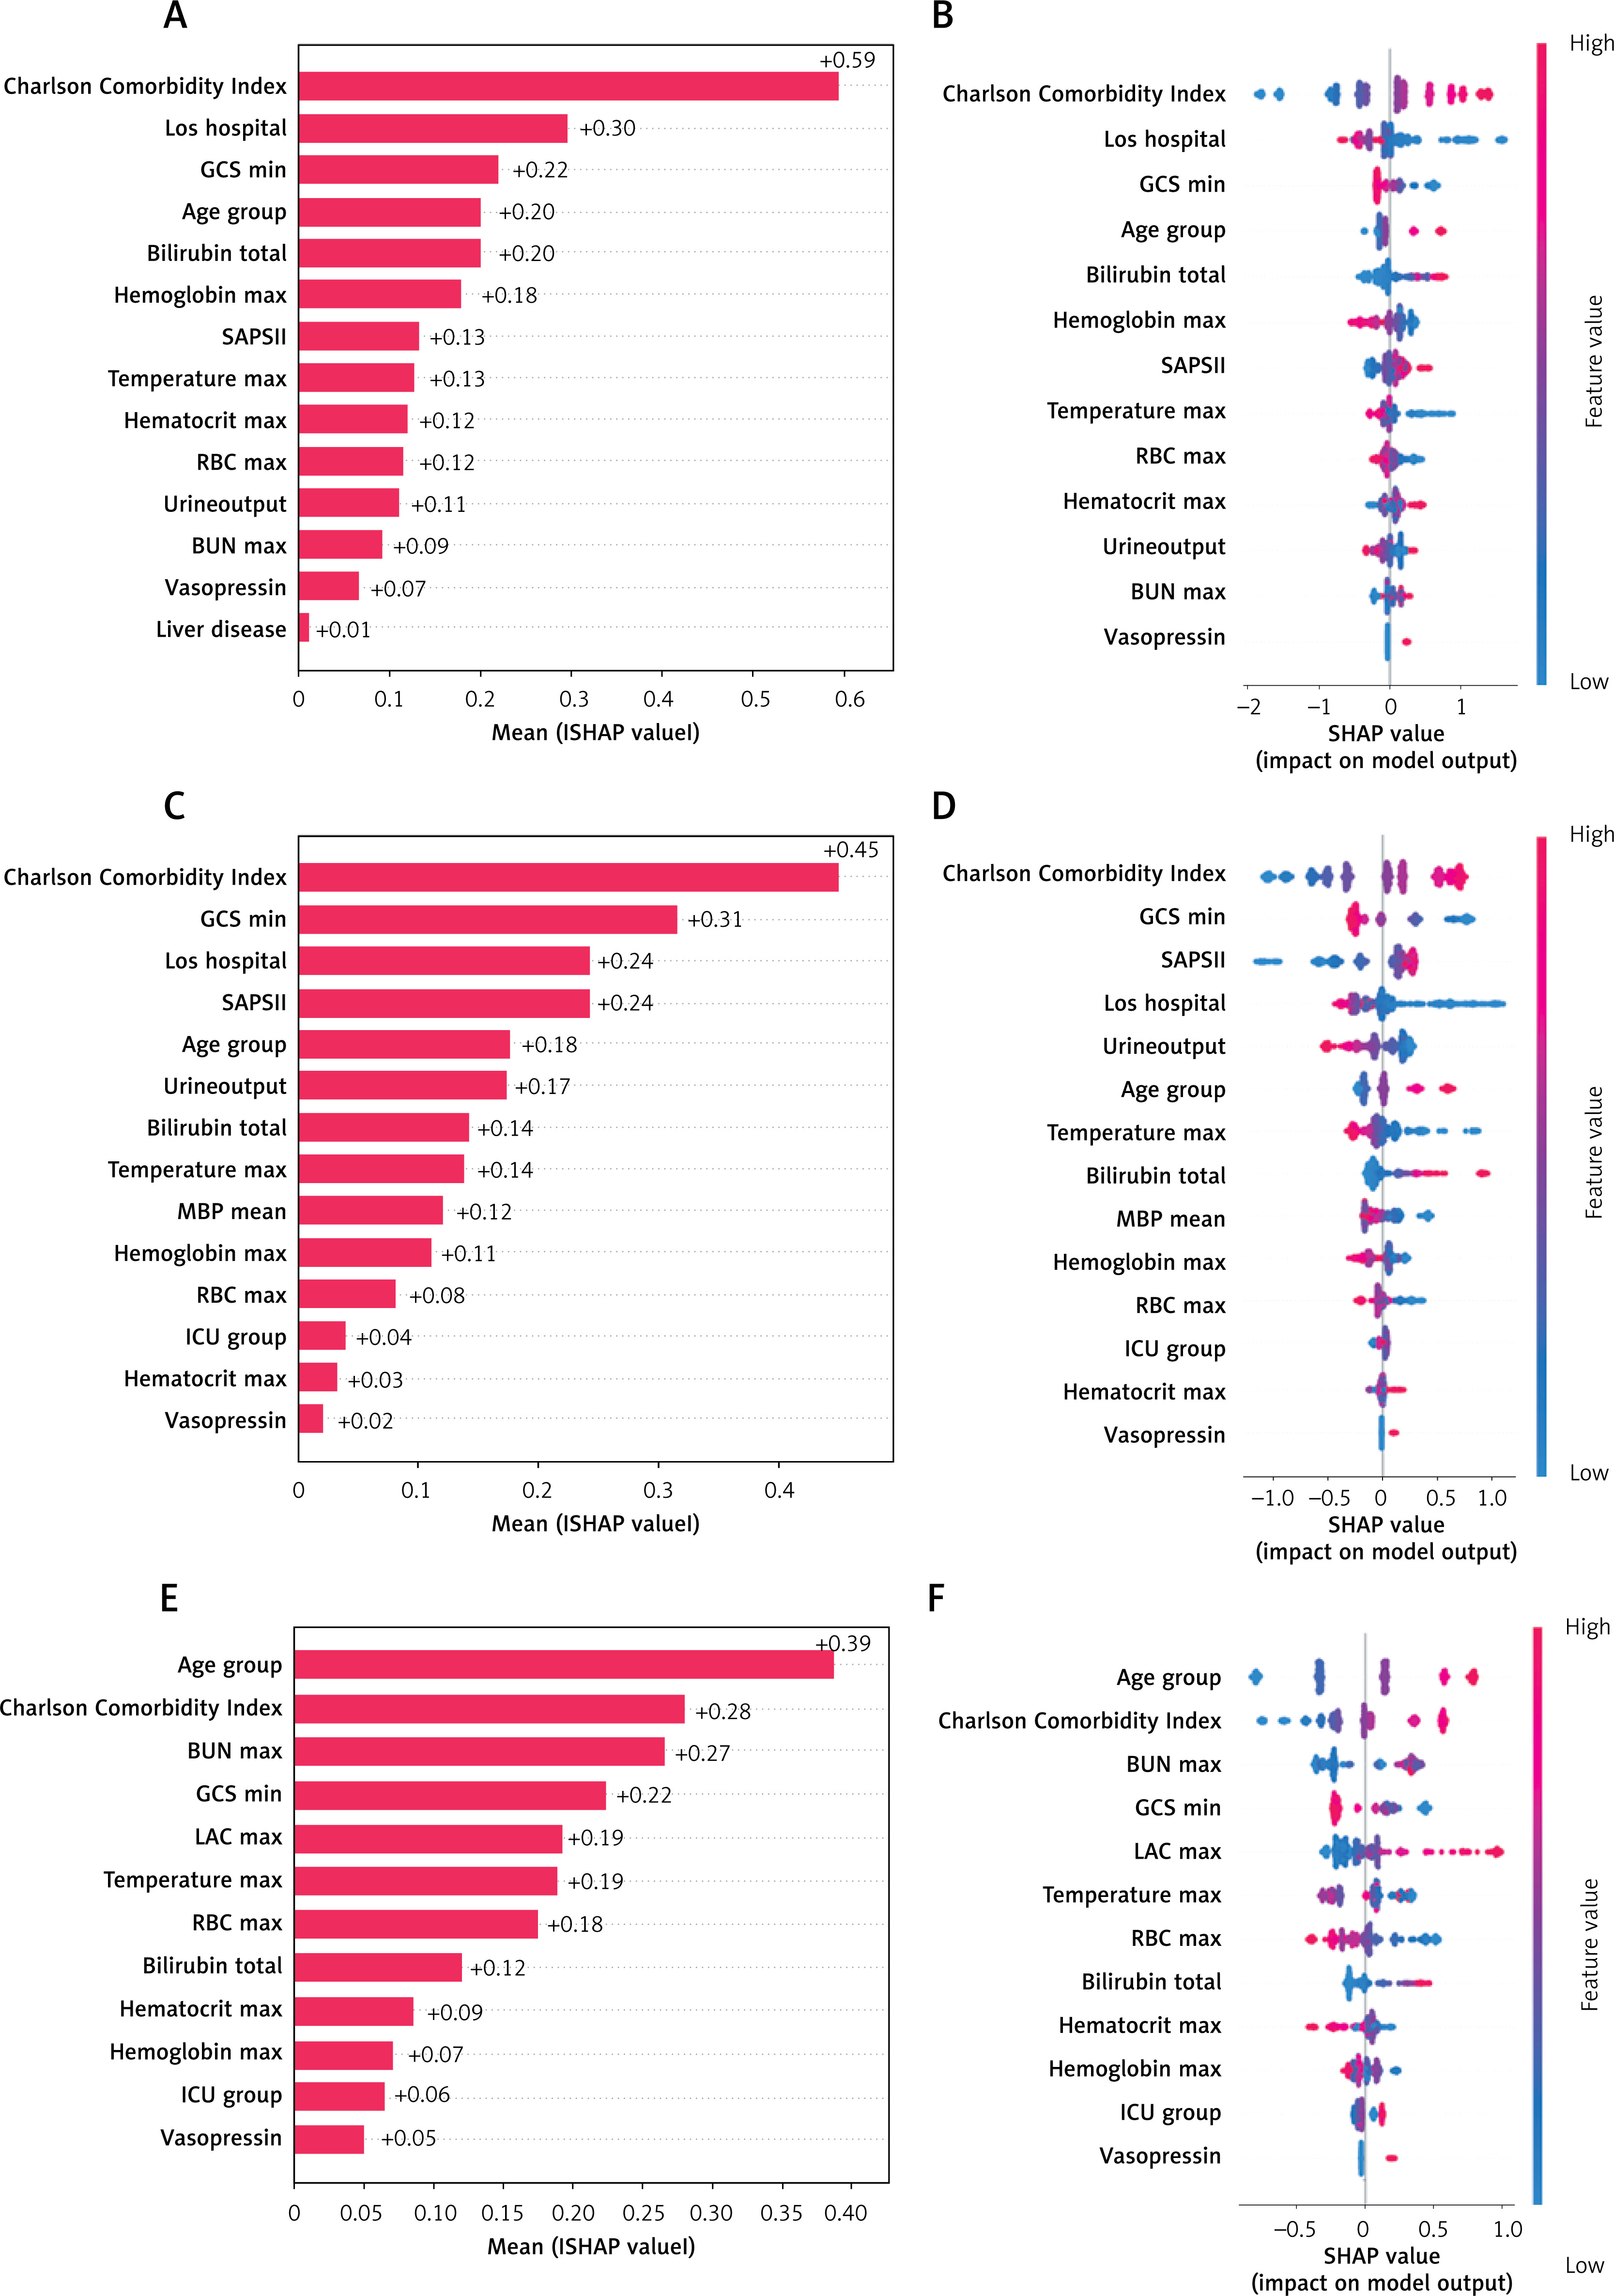
Figure 4
Summary of variable interaction dependency plot. A – Interaction effect between CCI and number of days in hospital on the risk of in-ICU mortality in patients with sepsis. B – Interaction effect between CCI and GCS on the risk of death in the ICU in patients with CPS. C – Interaction effect between AGE and CCI on the risk of death in the ICU in patients with CNS
Discussion
In this study, the clinical measurements of sepsis patients were extracted from the MIMIC-IV database. Then, we compared the baseline features and clinical characteristics of patients in the CPS and the CNS subgroups. We identified three different combinations of factors that may be associated with in-ICU death of sepsis patients. Based on six different machine learning algorithms, prediction models for in-ICU death were established for general patients with sepsis, as well as the CPS and the CNS groups. The optimized prediction model was selected by comprehensively considering the evaluation metrics, including AUC, prediction accuracy, sensitivity and specificity. The XGB model performed best for general patients with sepsis, while the GBDT model performed best for the CPS and the CNS groups. Based on the interpretable learning method, we explored the importance of the identified relevant factors for the prognosis of sepsis patients.
Despite the many challenges of studying patients with CNS, exploring the characteristics of patients with CNS can further reveal their prognostic features and influencing factors, which can contribute to treatment efficacy and improve prognosis [7]. By identifying specific biomarkers or clinical features, it is also possible to provide useful information for the development of treatment strategies for patients with CPS and CNS [5]. The machine learning models developed offer a valuable tool for ICU clinicians, helping to identify high-risk patients early and enabling timely, targeted interventions [13]. Integrating these models into electronic health record (EHR) systems could facilitate real-time risk assessment and personalized care [21]. Future steps include prospective validation in independent ICU cohorts and the incorporation of dynamic data (e.g., real-time vital signs) to enhance model accuracy. Ultimately, these models could improve patient outcomes by guiding interventions and resource allocation, potentially reducing in-ICU mortality.
Among the clinical features selected, low levels of hospital days, Hb, urine output, temperature, and GCS were found to be associated with increased risk of in-ICU death. Higher levels of age, Hct, CCI, SAPSII, TBil, BUN, the presence of liver disease, and use of vasopressin were also associated with a higher in-ICU death risk for sepsis patients.
Our analysis revealed little difference in comorbidities between the patients with CPS and CNS, but patients with CPS experienced more vasopressor support, which may be related to the severely impaired endothelial function of patients with CPS. It has been shown [22] that sepsis is an abnormal host response to infection, which is characterized by a variety of systemic disturbances, including increased vascular permeability and vasodilatation. Therapeutically, in addition to the use of antibiotics [23], early fluid resuscitation is also critical [24]. Su et al. reported that a large positive fluid balance worsens the condition of patients with hypoxemia [25]. However, not all patients respond effectively to fluid resuscitation, and its effects usually last for a shorter period [26], thus requiring the use of vasoconstrictive drugs to improve organ perfusion [27]. In addition, septic patients admitted to different types of ICU wards differ in their risk of in-ICU death, and a study by Ohbe et al. found a difference in case-fatality rates between patients in the ICU and those in the general ward [28], but no study has yet explored the association between the type of ICU ward and the risk of in-ICU death in septic patients.
Our study further compared the similarities and differences in identified influential factors and established models for patients with CPS and CNS. Risk factors that were the same between the two subgroups were CCI, age, GCS, bilirubin total, temperature, Hb, RBC count, ICU ward type, hematocrit, and vasopressin. This may be related to disease risk factors in sepsis patients, which did not seem to differ between the CPS and CNS groups. Nejtek et al. found that a higher CCI had a significant effect on mortality [29]. For differences between the two subgroups, number of days in hospital, urine output, SAPSII, and mean MAP were important factors related to increased risk of in-ICU death in the CPS group. However, in the CNS group, these variables were not included in the final model. In the CNS group, higher BUN and LaC levels were significant risk factors related to increased risk of in-ICU death, whereas they were not included in the final model in the CPS group. Sigakis et al. observed that blood transfusion within the first 24 h of onset was significantly associated with mortality in patients with CNS, but not in patients with CPS [30]. These differences may reflect variations in the type of pathogen infection and severity of the disease between the two groups, requiring targeted prevention and treatment measures for each group. Therefore, based on these differences, we can further explore the potential pathological and physiological similarities and differences between patients with CPS and CNS in order to achieve meaningful results in the prevention or treatment of sepsis in the future.
In terms of model performance, the XGB model performed best for predicting death in the ICU for all patients. For patients in the CPS and CNS subgroups, the GBDT model performed best. These findings are similar to those of Yang et al., who reported that XGB and RF models performed optimally for predicting sepsis onset [17]. However, the choice of model also needs to be based on practical clinical scenarios and needs to be weighed against other considerations.
In this study, the SHAP approach was also used to enhance the interpretation of the model established and to explore the main risk factors affecting sepsis patients’ mortality in the ICU. The results showed that some common risk factors, such as higher TBil, renal insufficiency (reflected in higher BUN levels), higher SAPSII, older age, and treatment with vasopressin significantly increased the risk of in-ICU death for the whole study sample and in two subgroups. This is consistent with the results of previous studies [1, 31, 32]. It has been shown that the prevalence of sepsis is increasing in the elderly population and age is an independent risk factor for death [31]. A study by Kübler et al. revealed that about 89% of septic patients admitted to the ICU in critical condition had dysfunction in three or more organs [32]. Organ dysfunction can be measured by the SOFA score, where an increase of 2 or more points implies an in-hospital mortality rate of more than 10% [1].
We also found that lower Hb levels, urine output, and GCS were associated with a lower risk of in-ICU death. These findings are also supported by previous studies [32–35]. Qi et al. found that when a patient’s Hb level falls below 80 g/l within 48 h of admission to the ICU, it will likely increase the risk of death in patients with sepsis [33]. Low urine output is an important indicator for detecting acute kidney injury [36], and also suggests an increased risk of death [34], which is often associated with renal dysfunction in patients with sepsis [32]. GCS is a rating scale that provides an objective assessment of patient consciousness [35], and a low GCS may be a simple and reliable predictor suggesting the need for initial resuscitation in patients with sepsis [37]. These findings are in line with the conclusions of previous studies, suggesting that, to improve the prognosis of septic patients, we may need to closely monitor the liver and kidney functions, SOFA score and other indicators of infected patients, actively correct the anemia, and maintain the patient’s urine output and mental status, so as to allow the patient to obtain a good therapeutic prognosis.
The SHAP approach applied provide better understanding of the final machine learning model and selected influential factors. A comprehensive analysis of the key factors affecting the prognosis of sepsis patients provided a potentially important guide for future risk assessment and individualized treatment in clinical practice. It also provides the quantitative evidence necessary for better understanding of the prognosis of septic patients.
Limitations of this study include the following: (1) Despite our rigorous screening of potential factors, we may not have been able to exclude all possible confounders due to the retrospective nature of this study, and we were unable to consider some important confounders such as antimicrobial use and timing of interventions due to lack of information about these factors. (2) Our analyses were based on retrospective data on the history of the first ICU admission, and potential bias in sample selection may not be totally avoided. (3) The aim of our study was to explore the major influences on bacterial sepsis. The inclusion of other pathogens (e.g., fungi and viruses) may greatly increase the complexity of the data and make it difficult to accurately differentiate the specific characteristics of bacterial infections. Future studies could take fungal and viral infections into account to fully assess the impact of multiple pathogens. (4) Our study has only established a preliminary prediction model, and further prospective validation and optimization are needed before application in practice.
In conclusion, this study found no significant difference in in-ICU mortality between CPS and CNS, but it identified key risk factors for in-ICU mortality in sepsis patients, revealing significant differences between CPS and CNS. These findings can inform personalized treatment strategies, particularly for CNS patients, who may require distinct management approaches.