Introduction
Systemic lupus erythematosus (SLE) is a complex autoimmune disease, in which the immune system fights against the body’s own structures with compounded mechanisms involving numerous genetic and environmental factors. Genetic content of patients with SLE is cumbersome and comprises multiple genes (human leukocyte antigen, interferon regulatory factor 5, signal transducer and activator of transcription 4, integrin α-M, and B lymphocyte kinase), encrypting different molecules with essential roles in the adjustment of the immune system [1–4]. Systemic lupus erythematosus most often affects the skin, joints, and kidneys, but the precise cause is still unknown.
In view of this, several studies have established the important role (modulating both the innate and adaptive immune responses) of cytokines in the pathogenesis, progression, and development of the SLE diseases [5–8]. One typical example of such cytokine that is relevant in relation to SLE is macrophage migration inhibitory factor (MIF).
In 1989, MIF cytokine was replicated [9] and after its endotoxin exposure, pituitary gland revealed it as a peptide [10]. Migration inhibitory factor performs a mediation role of innate immunity by stimulating host inflammatory reactions made by initiation of pro-inflammatory, hormonal, and enzymatic activities, and comes in a variety of many cell types like B cell, T cell, and macrophages [11, 12]. Furthermore, MIF controls host inflammatory reactions by adjusting cellular methods like T-cell spread, reduction of p53-dependent apoptosis, and counter adjustment of the immunosuppressive actions of glucocorticoids [13]. By now, studies have been conducted with genotype and allele of MIF recorded on its two functional promoter polymorphisms and chromosomes 22q11.2 [14]. Two of the MIF gene polymorphisms are G-to-C transition at -173 (rs755622) and (CATT) tetranucleotide repeat at -794. MIF-173 C allele makes an acceptable required platform for the stimulating enhancer binding protein 4 transcription factors and linked with elevated genotype and allele of MIF manifestation as well as protein measures in a cell type dependent mode [15].
Over the years, some studies have indicated plasma/serum MIF level in patients with SLE and demonstrated that plasma/serum MIF level differs in SLE patients. In addition, several studies have explored the association of MIF-173 C/G and -794 CATT polymorphisms with susceptibility to SLE, but with a smaller sample size compared to the overall sample size of this study [16–20]. However, the difference in the various studies cannot be elucidated by standard units, ethnicity, and characteristic differences in healthy controls. In order to critically and comprehensively assess the relationship between plasma/serum MIF and SLE, and also explore the likely functions of MIF into the pathophysiology of SLE, a systematic review and meta-analysis is conducted to ascertain a defined estimation on the association of MIF and SLE.
Material and methods
Systematic search
A systematic search was conducted electronically on MIF and SLE in all published articles, letters, abstracts, and reviews (up to 6th October 2017), using online databases of PubMed, Embase, Web of Science, and several Chinese databases (Wan-Fang, Chinese Biological Medical Literature, and China National Knowledge Infrastructure). Macrophage migration inhibitory factor, MIF, polymorphisms, genes, alleles, systemic lupus erythematosus, and SLE were the various keywords employed for the search. Furthermore, we went through all the cited references to possibly include all the excluded individual studies that were not captured electronically by the databases mentioned in the study. A letter was sent via emails to the corresponding authors to request for missing data but there was no response.
Criteria for inclusion
The inclusion of the articles in the meta-analysis was limited to only humans, with detailed data on plasma/serum MIF level in SLE patients and healthy controls, but no restrictions on the language or race/ethnicity were applied. Case control and cross-sectional or cohort studies that reported the mean and standard deviation of plasma/serum MIF levels in SLE patients and healthy controls, and tested MIF-173 C/G and/or -794 CATT polymorphisms in SLE and healthy controls were included in the analysis. Articles with values in median, standard error (SEM), range (minimum and maximum values), and interquartile range (IQR) were converted to mean and standard deviation for inclusion [21]. The most recent updated data was always considered when two or more articles reported the same data. The results obtained electronically were assessed independently by two investigators from the research team by first examining the titles and abstracts of the individual studies. A related article by topic and abstract was further examined for inclusion. In terms of doubt and differences among the two investigators over possible inclusion of an individual study, an additional investigator was invited to resolve this issue.
Exclusion of articles
Review papers, case reports, and studies with inadequate data (no values for MIF levels, allele frequencies, and genotype frequencies) were excluded from the analysis. Also, all duplicate articles and original articles on animals were excluded. No article was excluded based on the absence of body mass index (BMI), disease duration, or systemic lupus erythematosus diseases activity index (SLEDAI) estimates. A record was compiled for all individual articles on why they were exempted from the study.
Extraction of data
The author, publication year, country, sample size, age (mean and SD), sex, SLEDAI scores, disease duration, MIF assay, ethnicity, study type, MIF levels (mean and SD), allele frequencies, and genotype frequencies were extracted from the various articles of study. Body mass index was considered during data extraction. Data extraction was exclusively completed from original articles on human beings by two independent researchers. The preferred reporting items for systematic reviews and meta-analysis (PRISMA) guidelines were adopted for this study [22]. The methodology quality of the articles included was evaluated by Newcastle-Ottawa scale (NOS), with two researchers assessing and scoring the quality of all studies [23]. The Newcastle-Ottawa scale for case control study had ten items, whilst cohort study had thirteen items for assessment. The cross-sectional/prevalence study quality with eleven items was used to assess the quality of methodology for the cross-sectional studies in the study. Included articles were awarded ‘one’ for each item that was undoubtedly satisfied. An article with a better methodology quality had a score of 6 out of 10 and 13 on the NOS for both case control and cohort studies, respectively, and also 6 out of 11 on the cross-sectional/prevalence study quality for cross-sectional studies.
Statistical analysis
The mean and standard deviation (mean ± SD) were considered from the individual studies. All data in median and IQR, or median and range were converted to gain the approximate values [21]. We estimated the sample mean and standard deviation using an excel template that included all formulas for conversion. The values for the sample size, median, range, and/or interquartile range were entered into the excel template developed by Wan et al. [21], and the respective outputs were recorded for estimation. Studies that provided plasma/serum MIF level in units other than μg/ml were converted before the analysis. The standard mean difference (SMD) was used to compute the effect size for each study, and results were presented as SMD and 95% CIs’ for MIF level, whilst the relative risk (RR) was used to compute the effect size for each study, and results were presented as RR and 95% CIs’ for MIF gene polymorphisms. This was used to evaluate the strength of association between plasma/serum MIF levels in SLE patients and healthy controls, and also MIF gene polymorphisms in SLE patients and healthy controls. It reflects the real difference in the plasma/serum MIF level between SLE patients and healthy controls, and also MIF gene polymorphisms in SLE patients and healthy controls. Additionally, it may indicate significant difference.
In this article, heterogeneity was assessed statistically by using Cochrane’s Q statistics and the I2 statistics to quantify the consistency [24]. When p < 0.05 for the Q test or I2 > 50, heterogeneity was significant in the study. The I2 percentages 25%, 50%, and 75% were respectively interpreted as low, moderate, and high heterogeneity [25]. A random effect model was used for the analysis, since we allowed the variation of the true effects from one study to the other. Analysis of the subgroup was further performed in relation to the country, ethnicity, age, measurement method, disease duration, and SLEDAI scores to detect the sources of heterogeneity. Sensitivity analysis was also performed to identify studies that disproportionately contributed to the observed heterogeneity. It was accomplished by omitting each study uninterrupted to assess its impact on the summary estimate using random effect model. When any of the single study was omitted, the corresponding pooled results did not significantly change. The existence of potential publication bias was examined by Egger’s test and visual observation of the funnel plot [26]. It was visually evaluated by producing a funnel plot and Egger’s linear regression test was executed to assess the asymmetry of the funnel plot as well as evaluating the significance of publication bias. The Hardy-Weinberg equilibrium (HWE) was verified using the Χ2 test for all single nucleotide polymorphisms (SNPs) in controls [27]. We used p < 0.05 to indicate statistically significant data in our study. The version 12 of Stata was used to perform the analysis of this research.
Results
Literature search
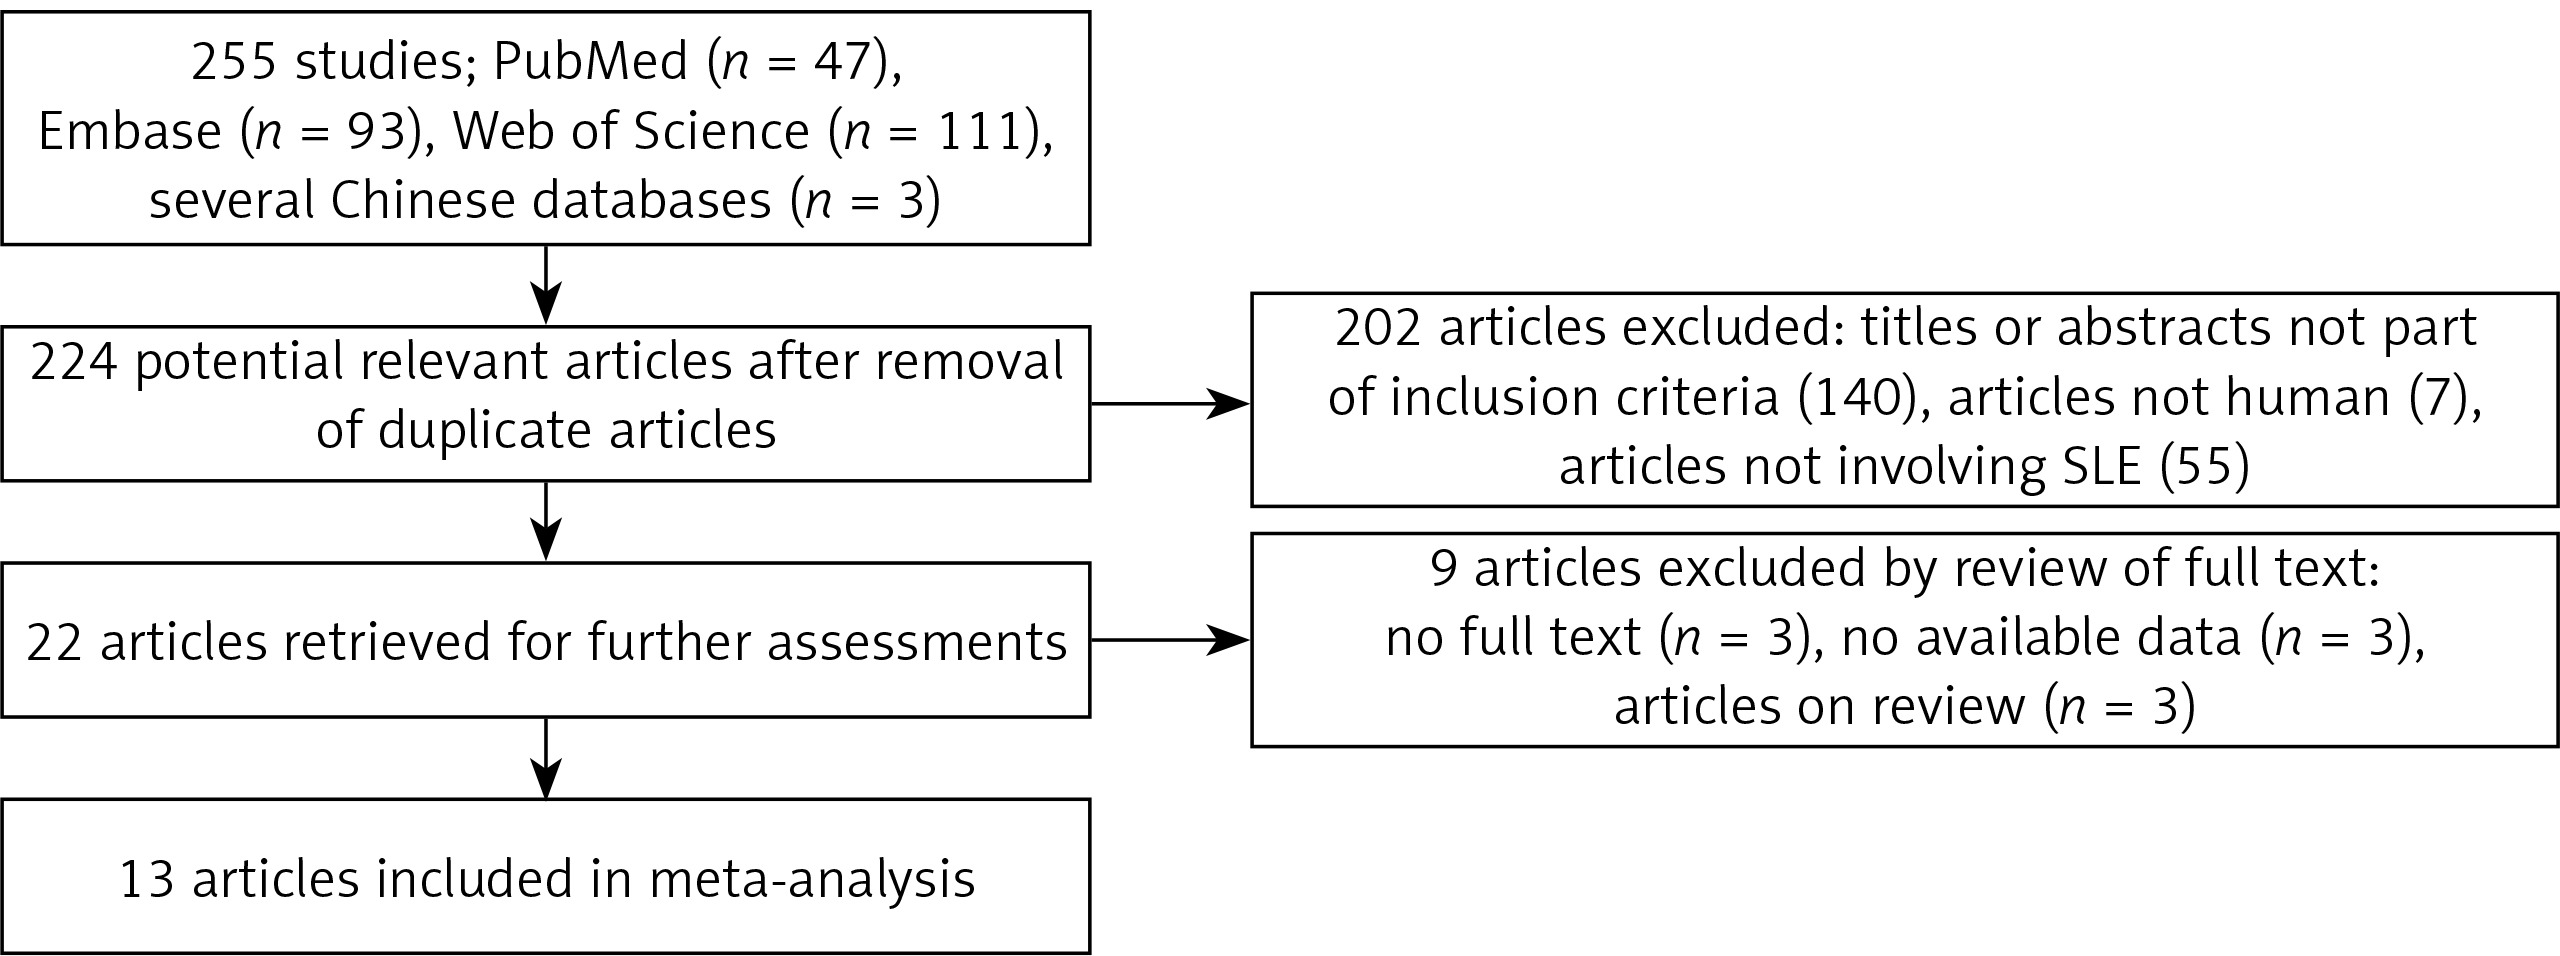
The total search produced 255 articles, of which 47, 93, 111, and 3 were from PubMed, Embase, Web of Science, and several Chinese databases, respectively. The articles were subjected to screening, and 31 duplicate articles as well as 202 articles with reviewed titles and abstract were excluded. Twenty-two articles were retrieved for further detailed assessments, and 9 articles were further excluded (3 have no full texts, 3 have no available data, and 3 were only review papers), leaving 13 articles meeting the inclusion criteria [16–20, 28–33] (Figure 1). Among the 13 included articles, 5, 3, 1, and 1 were from PubMed [16, 18, 20, 28, 29, 32], Embase [17, 30, 31], Web of Science [19], and several Chinese databases [33], respectively.
Study characteristics
Overall, 11 articles including a total of 620 SLE patients and 779 healthy controls were assessed for MIF levels, and four articles comprising of 2,159 SLE patients and 2,574 healthy controls were assessed for MIF gene polymorphisms (-173 C/G and -794 CATT). All included articles were case control studies. The measurement methods of plasma/serum MIF levels of the eleven articles and MIF gene polymorphisms of the four articles were enzyme-linked immunosorbent assay (ELISA) and polymerase chain reaction (PCR), respectively. The methodological quality assessment of the overall articles was satisfactory, with scores ranging from 6 to 9. The detailed features of both MIF levels and MIF gene polymorphisms of the individual articles in the study are presented in Tables I and II.
Table I
Characteristics of individual studies included in the meta-analysis (MIF levels)
| First author, year [ref.] | Country | SLE | Control | Assay method, sample | Ethnicity | Study type | MIF (SLE) | MIF (control) | NOS | Ethnicity | Study type | ||||||||
|---|---|---|---|---|---|---|---|---|---|---|---|---|---|---|---|---|---|---|---|
| N | Age Mean ± SD | BMI | Female (%) | SLEDAI | Duration Mean ± SD [years] | N | Age Mean ± SD | BMI | Female (%) | Mean | SD | Mean | SD | ||||||
| Feng 2017 [28] | China | 35 | 35.20 ±12.80 | NA | 97.14 | 8.91 ±4.05 | NA | 21 | 34.50 ±8.50 | NA | 90.48 | ELISA, serum | Asian | CC | 20.37 | 13.45 | 1.6 | 0.8 | 7 |
| Guan 2015 [32] | China | 106 | 39 ±36.83 | NA | 93.4 | NA | NA | 38 | 38.66 ±26.19 | NA | 92.11 | ELISA, plasma | Asian | CC | 19.35 | 6.98 | 9.37 | 3.98 | 7 |
| Wang 1 2012 [30] | China | 22 | 29.45 ±13.15 | NA | 81.82 | 15.05 ±5.27 | 2.74 ±4.14 | 27 | NA | NA | 100 | ELISA, serum | Asian | CC | 144.58 | 117.09 | 61.18 | 58.7 | 9 |
| Wang 2 2012 [30] | China | 40 | 30.78 ±11.76 | NA | 82.5 | 7.50 ±3.92 | 3.09 ±4.77 | 27 | NA | NA | 100 | ELISA, serum | Asian | CC | 96.56 | 52 | 61.18 | 58.7 | 8 |
| Sreih 1 2011 [17] | USSA | 116 | 38.70 ±12.60 | NA | 74 | NA | NA | 55 | 39.40 ±12.4 | NA | 78 | ELISA, plasma | Caucasian | CC | 4.60 | 4.60 | 8.9 | 7 | 8 |
| Sreih 2 2011 [17] | USSA | 44 | 38.70 ±12.60 | NA | 12 | NA | NA | 44 | 39.40 ±12.4 | NA | 10 | ELISA, plasma | AA | CC | 5.60 | 6.30 | 6.4 | 6.8 | 8 |
| Wada 2011 [31] | Japan | 65 | NA | NA | 100 | 16.6 ±16.7 | NA | 20 | NA | NA | 100 | ELISA, serum | Asian | CC | 9.86 | 8.44 | 4.07 | 1.87 | 6 |
| Foote 2004 [16] | Australia | 90 | 47.25 ±12.80 | 25.55±3.86 | 100 | NA | 11.58 ±6.64 | 279 | NA | NA | 100 | ELISA, serum | Australian | CC | 5.90 | 7.59 | 4 | 3.34 | 7 |
| Khattab 2006 [20] | Egypt | 20 | 35.15 ±10.42 | NA | 100 | 5.55 ±2.54 | 3.68 ±2.45 | 10 | 33.20 ±11.43 | NA | 100 | ELISA, serum | African | CC | 949.4 | 693.48 | 599.9 | 460.08 | 7 |
| Chen 2014 [33] | China | 55 | 26.7 ±8.20 | NA | 89.09 | NA | NA | 18 | 25.8 ±7.30 | NA | 77.78 | ELISA, serum | Asian | CC | 21.86 | 12.17 | 0.303 | 0.012 | 7 |
| Mizue 2000 [29] | Japan | 27 | NA | NA | 100 | NA | NA | 240 | NA | NA | 41.67 | ELISA, serum | Asian | CC | 20 | 11 | 5 | 2.3 | 9 |
[i] SLE – systemic lupus erythematosus, NA – not available, BMI – body mass index, SLEDAI – systemic lupus erythematosus disease activity index, ELISA – enzyme-linked immunosorbent assays, CC – case-control, NOS – Newcastle-Ottawa Scale, USSA – United States, Sweden and Argentina, AA – African American, MIF – macrophage migration inhibitory factor.
Table II
Characteristics of individual studies (MIF polymorphisms)
| First author, year [ref.] | Country | Ethnicity | SLE | Control | -794CATT(N) | AMT | HWE p-value (SLE) | HWE p-value (control) | |||||||
|---|---|---|---|---|---|---|---|---|---|---|---|---|---|---|---|
| N | GG | GC | CC | N | GG | GC | CC | SLE | Control | ||||||
| de la Cruz-Mosso 2014 [19] | Mexico | MM | 186 | 43 | 49 | 8 | 200 | 53 | 43 | 4 | 30 | 22 | PCR | 0.361 | 0.291 |
| Sreih 1, 2011 [17] | USSA | Cauca-sian | 1,082 | 701 | 300 | 41 | 1,439 | 913 | 440 | 42 | 210 | 320 | PCR | 0.215 | 0.220 |
| Sreih 2, 2011 [17] | USSA | AA | 180 | 90 | 64 | 25 | 180 | 62 | 89 | 22 | 25 | 35 | PCR | 0.024 | 0.334 |
| Sánchez, 2006 [18] | Spain | Spanish | 711 | 503 | 175 | 33 | 755 | 570 | 171 | 14 | 141 | 136 | PCR | 0.001 | 0.751 |
Meta-analysis results
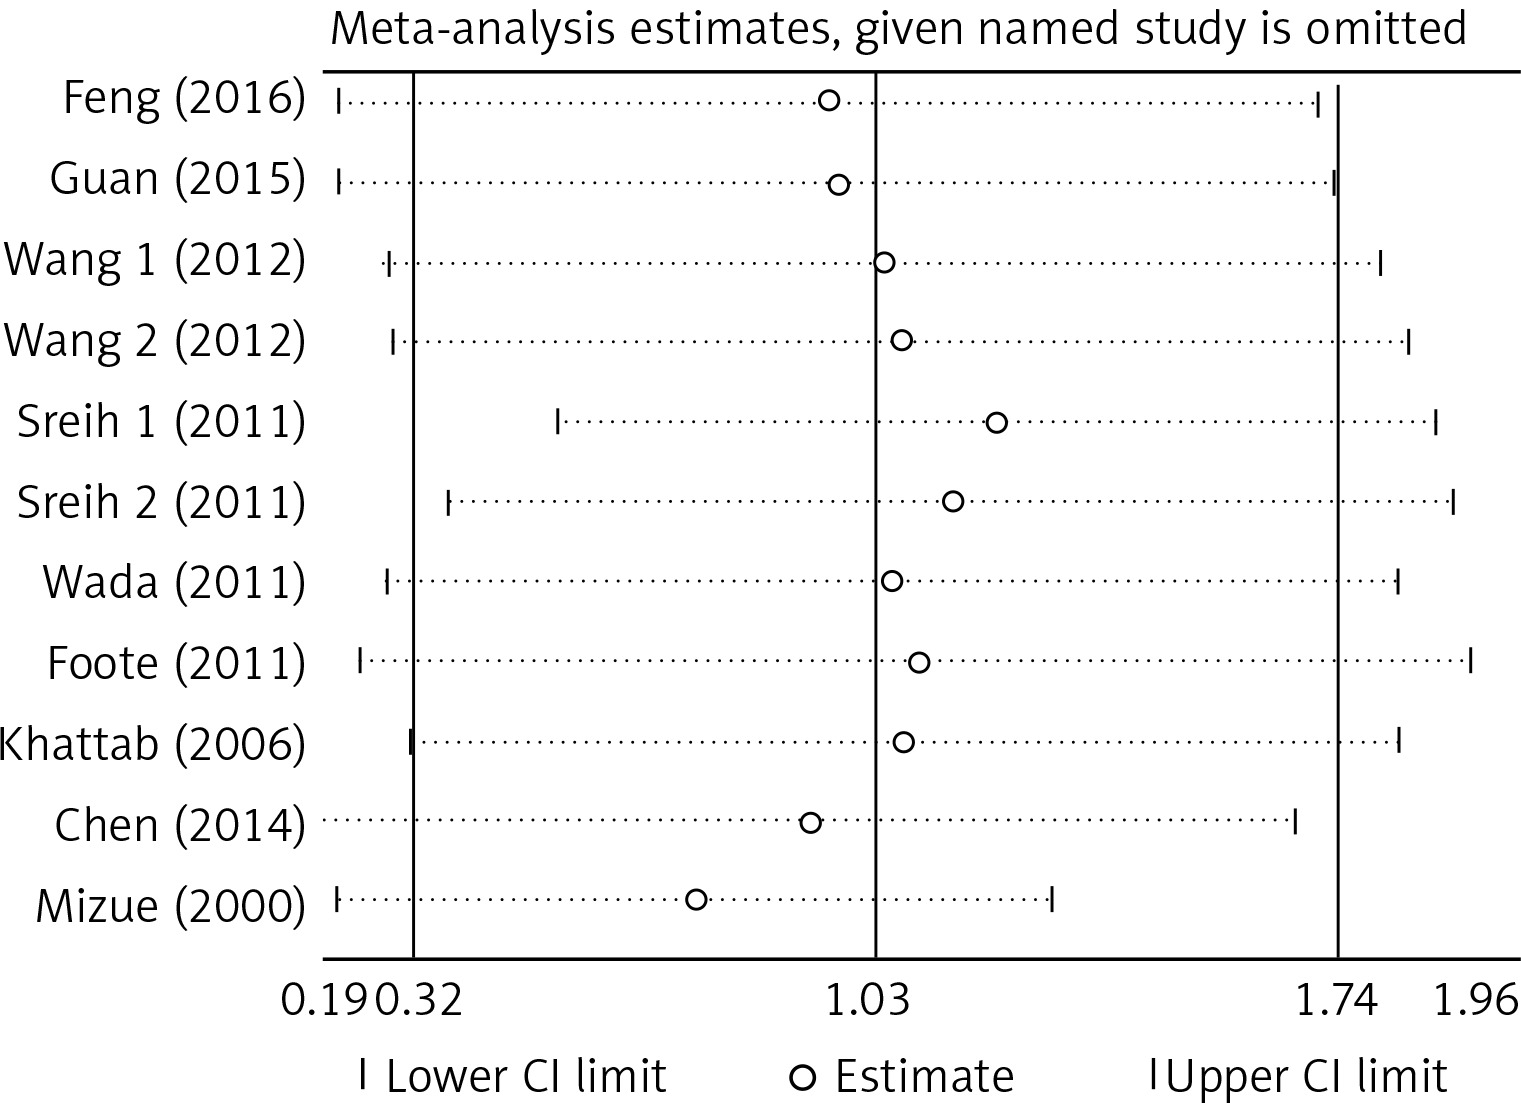
There was no significant publication bias across the included articles according to tests by both Begg’s (p > 0.05) and Egger’s (p > 0.05). Heterogeneity was significant across studies (p < 0.01) for plasma/serum MIF levels, but not significant for MIF gene polymorphisms. Sensitivity analysis by sequentially omitting individual study did not significantly change the pooled results, suggesting stability of these results (Figure 2). A random effect model was used, since we allowed the variation of the true effects from one study to the next.
Plasma/serum MIF levels and subgroup analysis
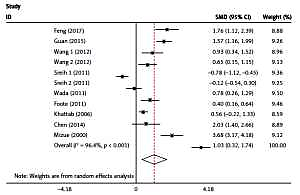
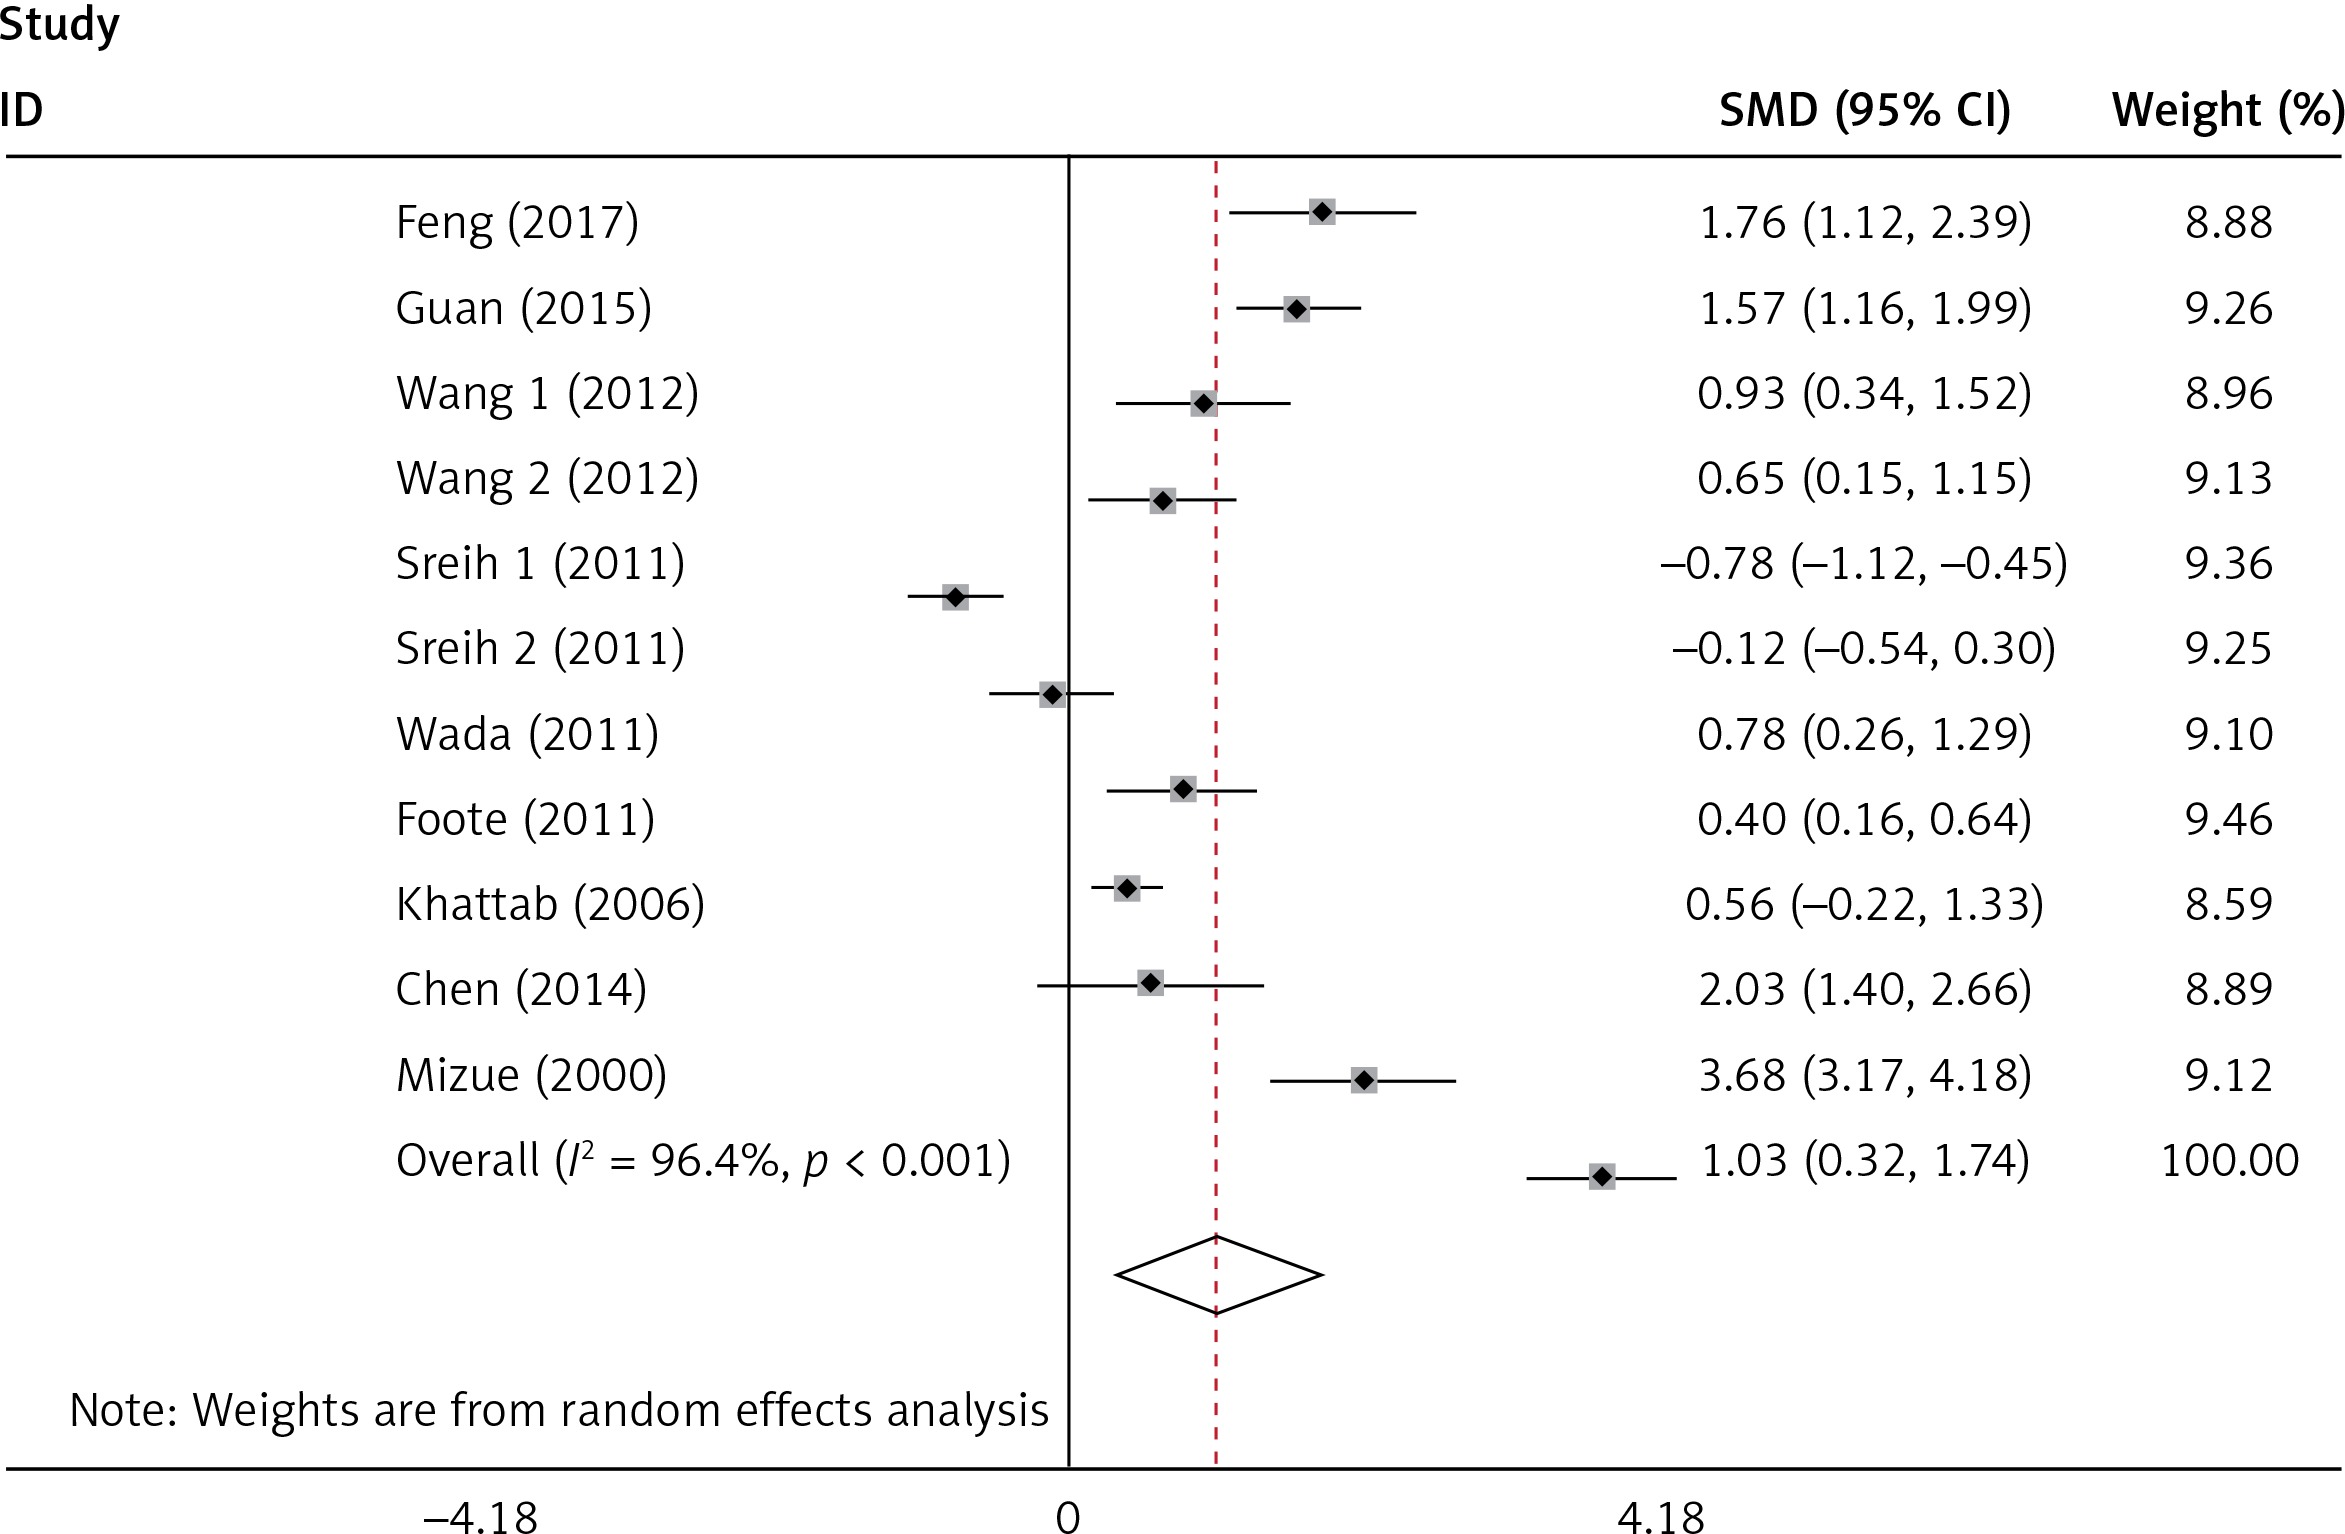
The plasma/serum MIF levels was significantly higher in patients of SLE than in healthy controls (p = 0.004) (Figure 3). Subgroup analysis stratified by ethnicity, age, SLEDAI, and disease duration were performed, and the results are shown in Table III. It revealed that Asians and ages < 30 had higher plasma/serum MIF levels in SLE patients than the healthy controls. It was evident that patients with SLEDAI score of < 8 and SLEDAI score of ≥ 8 of SLE had significant higher plasma/serum MIF levels when compared to healthy controls. It was also revealed that disease duration in SLE patients for both year < 5 and year ≥ 5 had significant higher plasma/serum MIF levels compared to healthy controls.
Table III
Subgroup analysis of migration inhibitory factor levels in systemic lupus erythematosus
MIF gene polymorphisms analysis
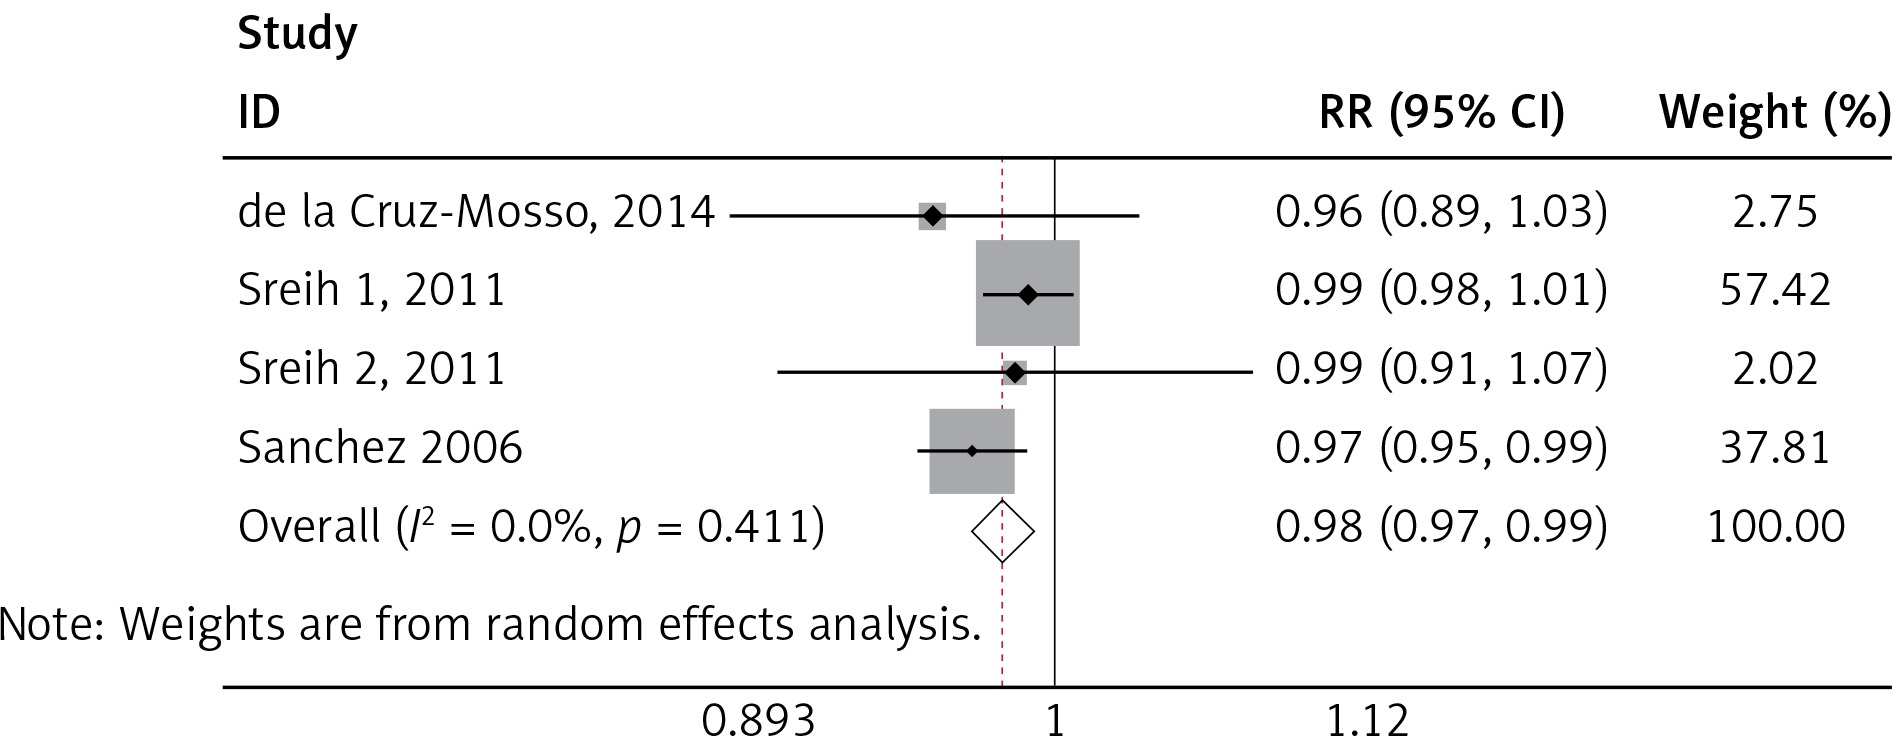
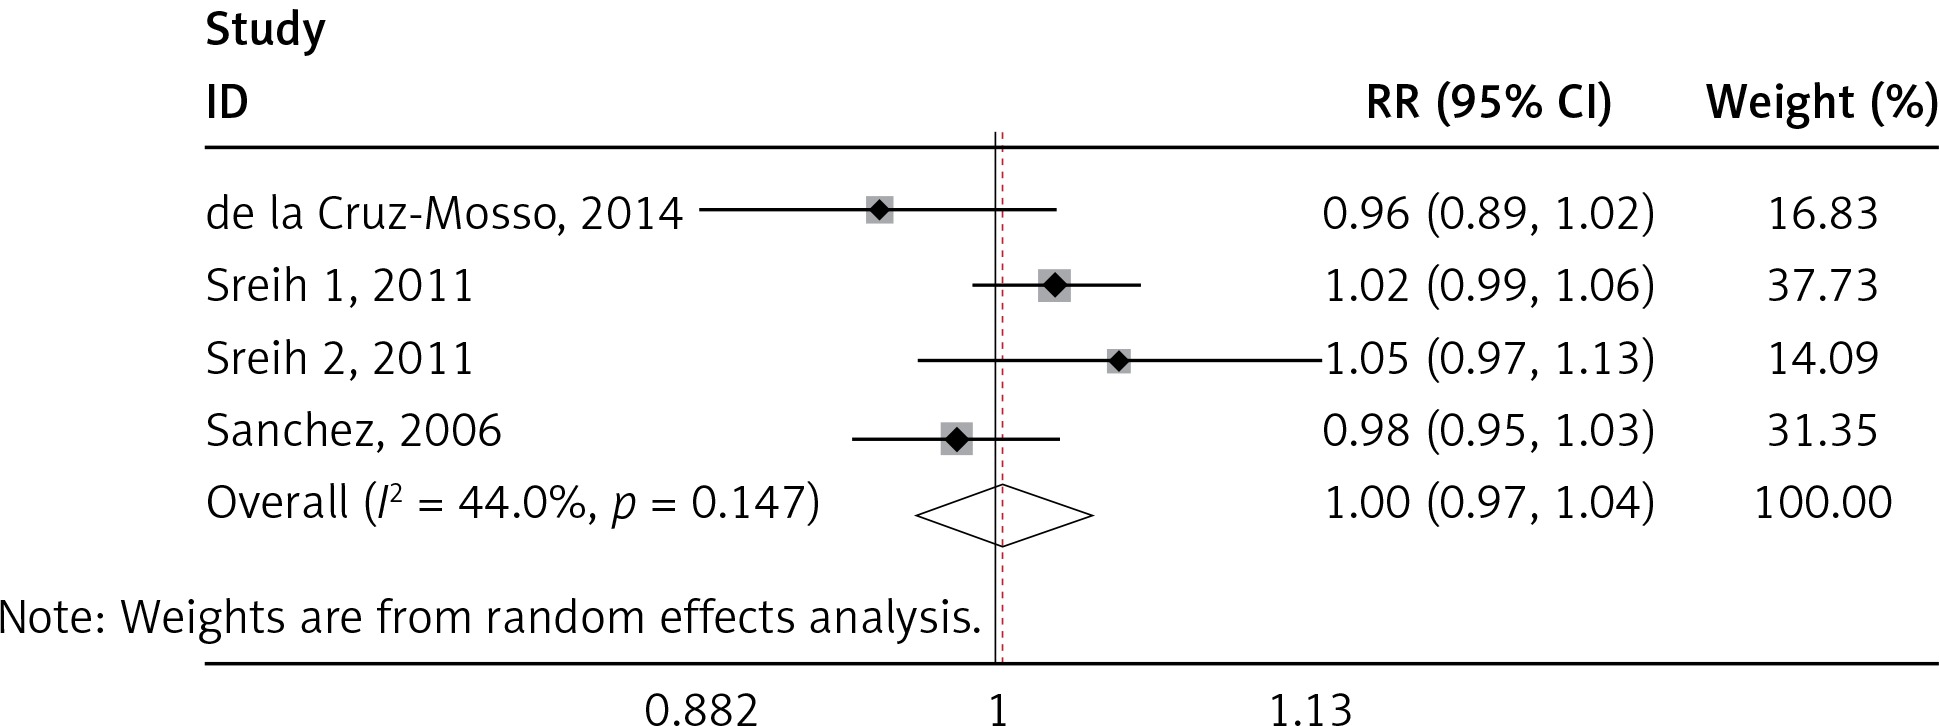
We found a significant association of the MIF-173 C/G and SLE (p = 0.003) (Figure 4), but there was no significant relationship between MIF-794 CATT and SLE patients (p = 0.854) (Figure 5).
Discussion
This study broadly investigated the plasma/serum MIF levels of patients with SLE and healthy controls as well as the relationship between the MIF gene and SLE patients. Migration inhibitory factor is present in inflammatory processes, and the mechanisms of chronic inflammatory diseases like SLE is supported with several evidences suggesting that MIF gene is a correct candidate in inflammatory diseases like SLE [34]. In this meta-analysis, the plasma/serum MIF levels were significantly higher in patients of SLE than in healthy controls. Bae et al. have reported similar results on ethnicity, age, and sex for matched population, which did not also vary from our findings [35]. Mizue et al. revealed a comparable outcome that MIF levels were significantly higher with SLE patients, as compared to the control group [29]. Likewise, Foote et al. ascertained significant relationship between MIF levels and SLE [16]. This really revealed MIF as a very important inflammatory facilitator of the continuation of immune activation in SLE through the influence of endothelial, effector cells, T cells, and B cells [36].
In subgroup analysis, our study discovered a significant association of MIF levels and age. It is not surprising that many previous studies were conducted among women, as a known fact that SLE is more frequent in females than males with a ratio of 9 : 1, and does appear commonly at fertility period within the ages of 15 to 50 years, consequently reflecting a hormonal impact in the mechanisms of SLE [37]. However, Sreih et al. and Mizue et al. revealed no significant association of MIF levels and mean age [17, 29]. Our findings also showed that ethnicity was significantly associated with MIF levels in SLE patients, when compared with healthy controls. It was obvious that seven out of eleven included studies were Asian or from Asian countries; therefore, further studies from different geographic areas and various ethnic groups investigating the levels of MIF in SLE patients compared with healthy controls may enlighten the pathophysiology of SLE and identification of patients at risk of developing severe disease activity. For instance, better understanding of MIF in the immune system and its possible roles in SLE may contribute to better clinical practice.
Systemic lupus erythematosus is characterized by widespread inflammation, which can affect every organ in the body. Environmental factors that are thought to trigger SLE in genetically predisposed individuals need to be carefully elucidated in further studies. Many factors such as host and environment, relate to the mechanisms of SLE, but the major defect is a loss of self-tolerance, which results in the production of autoreactive lymphocytes [38]. In this study, we found that there was a significant association between MIF levels and SLEDAI scores (of both < 8 and ≥ 8) of SLE patients, and this finding is similar to Diaz Rizo et al. [39] and Feng et al. [28]. Our findings further revealed that disease duration in SLE patients for both year < 5 and year ≥ 5 had significantly higher plasma/serum MIF levels, compared to healthy controls patients in a matched population. According to Khattab et al., the mean serum MIF showed no significant difference between cases and control, and this contradicts our findings [20]. This might be as a result of the small sample size and the serum MIF being over-expressed in SLE patients, compared to large sample size and accurate extraction of results in our study. This study indicates ethnicity, SLEDAI, disease duration, and age being associated with plasma/serum MIF levels.
We identified significant associations of the SLE and MIF -173 C/G, but no significant association between MIF-794 CATT and SLE was established. This finding was not in accordance with Renner et al., where the association of SLE was significant to both MIF-173 C/G and MIF-794 CATT [40]. Our results seem to be more accurate, because of larger sample size used than in other studies as well as considering only one disease (SLE) as compared to many autoimmune diseases [40]. Our finding was also not in line with Bae et al., where the results revealed no correlation between SLE and MIF-173 C/G and MIF-794 CATT polymorphisms [35]. These variations may be attributed to the number of studies and sample size employed in each research. It must also be noted that the inclusion criteria of the individual studies and assay method sample may play a role in the variation of studies. Since SLE had been demonstrated to be a multigenic disease, there had been a lot of researches in the area of polymorphisms in SLE. However, large-scale genome wide association studies (GWAS) and genetic association studies cannot even identify all susceptibility genes. In our study, MIF-173 C/G was associated with SLE susceptibility, which was very helpful to better understand the pathogenesis of SLE. MIF gene might be a novel therapeutic target for SLE.
During this study, we were able to extract valid and accurate results from individual articles and, with greater sample sizes of 620 patients of SLE and 779 of healthy controls for MIF levels, and 2,159 patients of SLE and 2,574 healthy controls for MIF gene, compared to the original studies. Sensitivity analysis was conducted to know the real impact of the individual studies over general summary effect size. However, this study has some limitations. Firstly, some publications including conference abstracts and academic dissertations were excluded and could cause bias to the results. Secondly, subgroup analysis and meta-regression evaluated only the sources of heterogeneity for limited factors due to insufficient data. Some other factors such as drug use, BMI, and other clinical features might account for high heterogeneity among these studies.
In conclusion, our study showed a significant higher plasma/serum MIF levels for SLE patients than in the control group, and also significant associations of the SLE and MIF-173 C/G. These results suggest an important function of MIF in the mechanisms of the SLE patients. However, a more detailed analysis with larger sample studies is still required to further reveal the mechanism of MIF gene polymorphisms in SLE.