Introduction
Cholesteatoma is defined as a well-demarcated non-neoplastic cystic lesion, which is derived from an abnormal existence and growth of keratinising squamous epithelium in the middle ear cavity and temporal bone [1]. The cystic wall contains stratified squamous epithelium and is mainly composed of keratinocytes. Therefore, it can also be described as “skin in the wrong place” [2]. Cholesteatoma epithelial cells with high proliferative activity can result in destruction of the middle ear and adjacent structures, causing conductive and sensorineural hearing loss, labyrinthine fistula, peripheral facial paralysis, and intracranial infection. Although there has been substantial research on this disease and many theories have been proposed, the pathogenesis of cholesteatoma, especially the molecular mechanism and cellular processes of keratinocyte proliferation and apoptosis in cholesteatoma, have not been fully elucidated [1, 3].
MiRNAs are one kind of non-coding small RNA, which are evolutionarily conserved and involved in the degradation of mRNA and/or translational suppression, after which they negatively regulate mRNA expression activity [4, 5]. MiRNAs can regulate hundreds of targets and have a significant impact on the regulation of cell proliferation, apoptosis, and other biological processes [4, 6]. MiR-125b is generally low expression or even absent in many malignant tumours, and its high expression can have anticancer functions [7, 8]. In addition to neoplastic disease, previous studies have demonstrated that miRNA-125b is down-regulated in psoriasis, which is characterised by hyperproliferation of keratinocytes, and that miRNA-125b can regulate the growth of keratinocytes in psoriasis [9–11]. Cholesteatoma is mainly composed of keratinocytes and has characteristics of abnormal proliferation [12]. However, reports on miR-125b in cholesteatoma have yet to be published.
STAT3 may be an important downstream target gene of miR-125b that can be found in some bioinformatics software, such as TargetScan and MiRanda. STAT3 belongs to the stat family, which can be transferred to the nucleus and bind to DNA to initiate the downstream target gene transcription. It is an important transducin for many cytokines and growth factors and is the focal point of many signalling pathways [13]. STAT3 gene expression regulates cell function in most tissues. Over-expression of STAT3 can stimulate cell proliferation, survival, and malignant transformation [14, 15]. Several studies have shown that STAT3 is an important regulator of keratinocyte function and plays a significant role in promoting proliferation of keratinocytes by targeting cyclin D1, survivin, and VEGF [16–18]. Meanwhile, existing studies have confirmed that STAT3 is up-regulated and associated with the proliferation and growth of cholesteatoma [19–21]. Furthermore, cyclin D1, survivin, and VEGF have also been found to be highly expressed in cholesteatoma [22–25]. However, the relationship between MiR-125b, STAT3, and their downstream target genes in cholesteatoma remains unclear.
The pathogenesis of cholesteatoma is a complex process and has not yet been fully elucidated. At present, reports on miRNAs involved in the growth and proliferation of cholesteatoma are extremely rare. Specifically, reports on miR-125b, its predicted target gene STAT3, and downstream regulatory genes in the cholesteatoma have never been seen. We hope this study can provide a deeper understanding of cholesteatoma pathomechanism and determine a possible targeted molecular therapy.
Material and methods
Tissue collection and cell culture
A total of 24 pairs of primary acquired cholesteatoma and the corresponding retroauricular normal skin specimens as controls were collected from August 2016 to February 2017 in our department. After cleaning and drying, the collected specimens were divided into two parts; one was put in a –80°C refrigerator, and the other was put in formaldehyde. All patients with middle ear cholesteatoma were confirmed by clinical and pathological examination. This study was approved by the Ethics Committee of China Medical University, and all patients signed informed consent documents. The experimental cell line was human immortalised keratinocyte (HaCaT cell), which was acquired from the Dermatology Key Laboratory of China Medical University. HaCaT cells were cultured in DMEM high-glucose medium (HyClone, Thermo Fisher) containing 10% foetal calf serum (Corning, Thermo Fisher) and grown in a 5% CO2 humidified atmosphere at 37°C.
Real-time, fluorescence-based quantitative PCR and cell transfection
Total RNA was isolated from HaCaT cells, cholesteatoma, and the corresponding skin with RNAiso plus (TaKaRa Biotechnology Co. Ltd., Dalian, China). The integrity, purity, and concentration of total RNA were analysed by spectrophotometry and gel electrophoresis. Then, the RNA was polyadenylated using E. coli Poly (A) Polymerase (New England Biolabs, MA) and reverse-transcribed into cDNA with a PrimeScriptTM RT reagent Kit with gDNA Eraser (TaKaRa). Finally, quantitative real-time PCR was carried out using a SYBR®Premix Ex Taq™II (TaKaRa) and 7500 real-time PCR system (Applied Biosystems, USA). The relative expression of gene levels was calculated using the 2–ΔΔCT method. U6 served as an internal control normalised the expression data of miR-125b. The sequences of the primers: miR-125b-5p: 5’-TCCCTGAGACCCTAACTTGTGA-3’ miR-reverse: n5’-GCTGTCAACGATACGCTACG-3’; miR-RT primer: 5’-GCTGTCAACGATACGCTACGTAACGGCATGACAGTGTTTTTTTTTTTTTTTTTTTTTTT-3’; U6 forward: 5’-CTCGCTTCGGCAGCACA-3’ and reverse: 5’-AACGCTTCACGAATTTGCGT-3’; HaCaT cells were transiently transfected with miR-125b mimics, miR-125b inhibitor, control miRNA, STAT3 siRNA, and control siRNA (all from RiboBio Co. Ltd., Guangzhou, China), using Lipofectamine® 3000 reagent (Invitrogen, Carlsbad, CA, USA).
Dual luciferase assay
Overlap extension PCR was used for site-directed mutagenesis, and the following primers were used: STAT3-F: 5’-GGCCTCGAGTGGTGAAGGTGCTGAAC-3’; STAT3-R: 5’-TTGCGGCCGCTTTTACGGTTCCTATATAAC-3’; STAT3-Fm: 5’-TGGTTGAGGA-GTCCCTATATGGTTCTTAGCC-3’; STAT3-Rm: 5’-AACCATATAGGGACTCCTCAACCAGACACGTC-3’. The mu-tated or wild STAT3 3′-UTRs, including putative miR-125b target sites, were cloned into the pmirGLO dual-luciferase reporter vector (Promega, Madison, WI, USA). HaCaT cells were seeded in a 96-well plate and adjusted to 1.5 × 10⁴ cells per well. After 48 h of culture, miR-125b mimics and STAT3-3’UTR-wild or STAT3-3’UTR-mutant reporter vector were co-transfected into the cells by using Lipofectamine® 3000 (Invitrogen, USA). The luciferase activity was evaluated with the Dual-Glo® Luciferase Assay System (Promega, USA) following incubation for another 48 h post-transfection.
Immunohistochemistry and western blot
The tissue samples were sliced at a thickness of 4 μm. The sections were incubated with primary antibody (STAT3, surviving, VEGF (all from Proteintech Group, USA) and cyclin D1 (Santa Cruz Biotechnology, USA)) overnight, followed by a biotin-labelled secondary antibody. The evaluation of immunostaining included both positivity rate and staining intensity of cells [22]. The proportion of positive cells was graded as follows: 0 for no staining, 1 for < 30%, 2 for 30–60%, and 3 for > 60%. The grading of staining density was 0 for no staining, 1 for light brown, 2 for brown, and 3 for dark brown. All specimen sections were analysed independently by two researchers with the double-blind method. The final score was obtained from the product of the percentage score and the staining intensity score. The final result was evaluated as positive when the score was ≥ 3 or negative when the score was < 3. The cholesteatoma tissues, control skin, and HaCaT cells were lysed with RIPA lysis buffer. Then, the proteins were separated and transferred to a polyvinylidene fluoride (PVDF) membrane (Millipore, MA, USA), which was incubated with primary antibody (STAT3, surviving, VEGF, β-actin (all from Proteintech Group, USA) and cyclin D1 (Santa Cruz Biotechnology, USA)). The enhanced chemiluminescence ECL detection system (Thermo Fisher Scientific, MA) was used to present the results.
Colony formation and MTS cell proliferation assay
For cell colony formation test, the transfected cells following 24 h of culture were inoculated into six-well plates and adjusted to 400 per well and were then incubated for 15 days in a DMEM high-glucose medium. When the forming colonies were macroscopically visible, the numbers of colonies were counted. The transfected cells were made into a single cell suspension after 24-h culture. Then, the cells were inoculated on a 96-well plate at a density of 3000 cells/well. Cell proliferation was detected by the CellTiter 96® AQueous Single Solution Cell Proliferation Assay Kit (MTS, Promega, USA). A microplate reader (Infinite M200pro, TECAN, Switzerland) was used to record the absorbance at 490 nm (OD490) daily. Data were continuously recorded for 4 days and plotted as a cell growth curve.
Cell cycle and apoptosis assays
The transfected cells were cultured for 48 h and then collected for adjustment to a cell density to 1 × 10⁶/ml. The cells in cell-cycle analysis were fixed and stained by a cell-cycle detection kit (Key-Gen Biotech, Nanjing, China). The cells for apoptosis analysis were stained by a dead cell apoptosis kit (Alexa® Fluor 488 annexin V and PI, Invitrogen). The apoptosis level and cell cycle distribution were analysed by flow cytometry (FACSCalibur, BD Biosciences).
Statistical analysis
All experiments were repeated at least three times independently. Results were presented as mean ± standard deviation (SD). Correlation analysis was performed with Pearson’s correlation (normal distribution). Student’s t-test was used for data comparison. The count data were analysed with χ2 test. All data were analysed using GraphPad Prism 7.0 software (GraphPad Software, USA). Value of p < 0.05 was determined to be a statistical significance.
Results
MiR-125b had low expression and was inversely associated with STAT3 in cholesteatoma
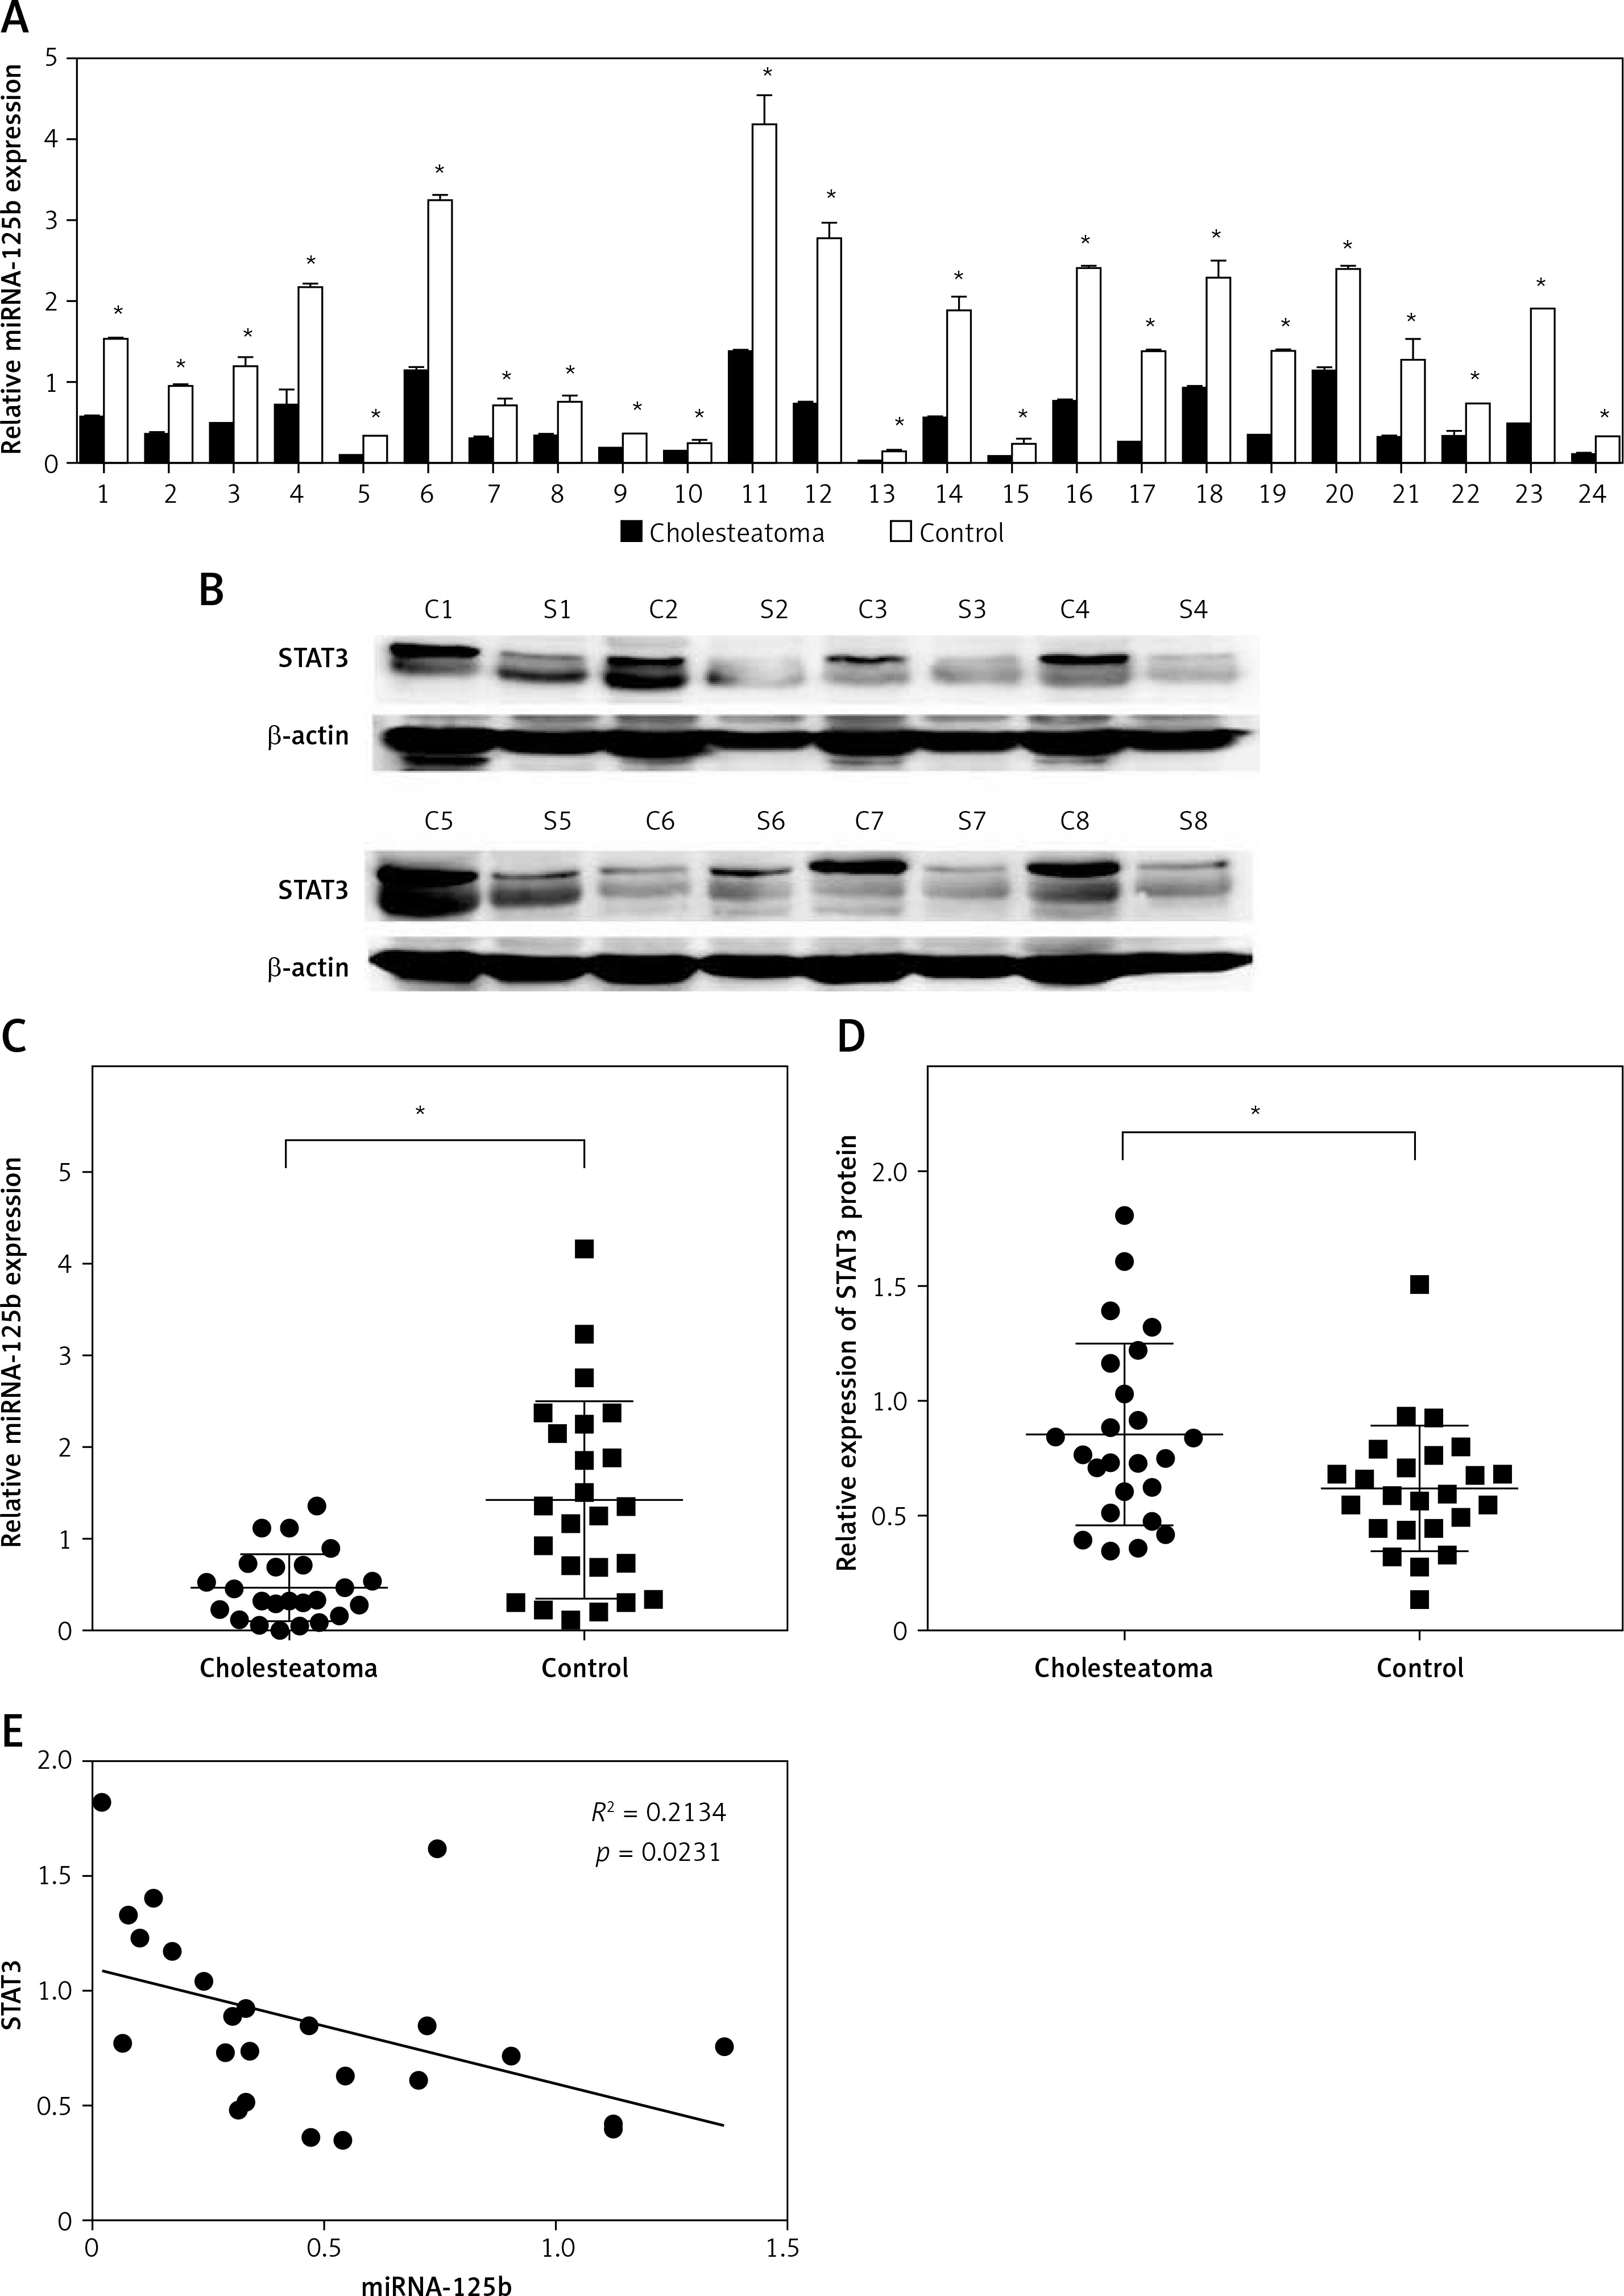
We selected 24 pairs of cholesteatoma specimens with their own controls (cholesteatoma and retroauricular skin from the same patient) as the research objects. The results of real time fluorescence quantitative PCR showed the expression of miR-125b in 24 cases of cholesteatoma was significantly lower than that in the corresponding retroauricular skin (Figures 1 A, C). Conversely, the expression of STAT3 protein in cholesteatoma was higher than that in corresponding retroauricular skin (p < 0.05) (Figures 1 B, D and Supplementary Figure S1). The results of Pearson correlation analysis demonstrated that miR-125b and STAT3 were negatively correlated in cholesteatoma (p < 0.05) (Figure 1 E).
Figure 1
MiR-125b has low expression and is negatively correlated with STAT3 expression in cholesteatoma. A, C – Expression and statistical analysis of miR-125b in cholesteatoma and paired retroauricular skin (tested by real-time PCR and normalised by internal control U6, *p < 0.05, n = 24). B, D – Expression and analysis of STAT3 in cholesteatoma and paired retroauricular skin (tested by western blot and normalised by β-actin, *p < 0.05, C – cholesteatoma, S – skin, n = 24). E – Analysis of the correlation between miR-125b and STAT3 in cholesteatoma (n = 24, *p < 0.05). Data presented as mean ± SD are from three independent experiments
STAT3 is a direct target of miR-125b
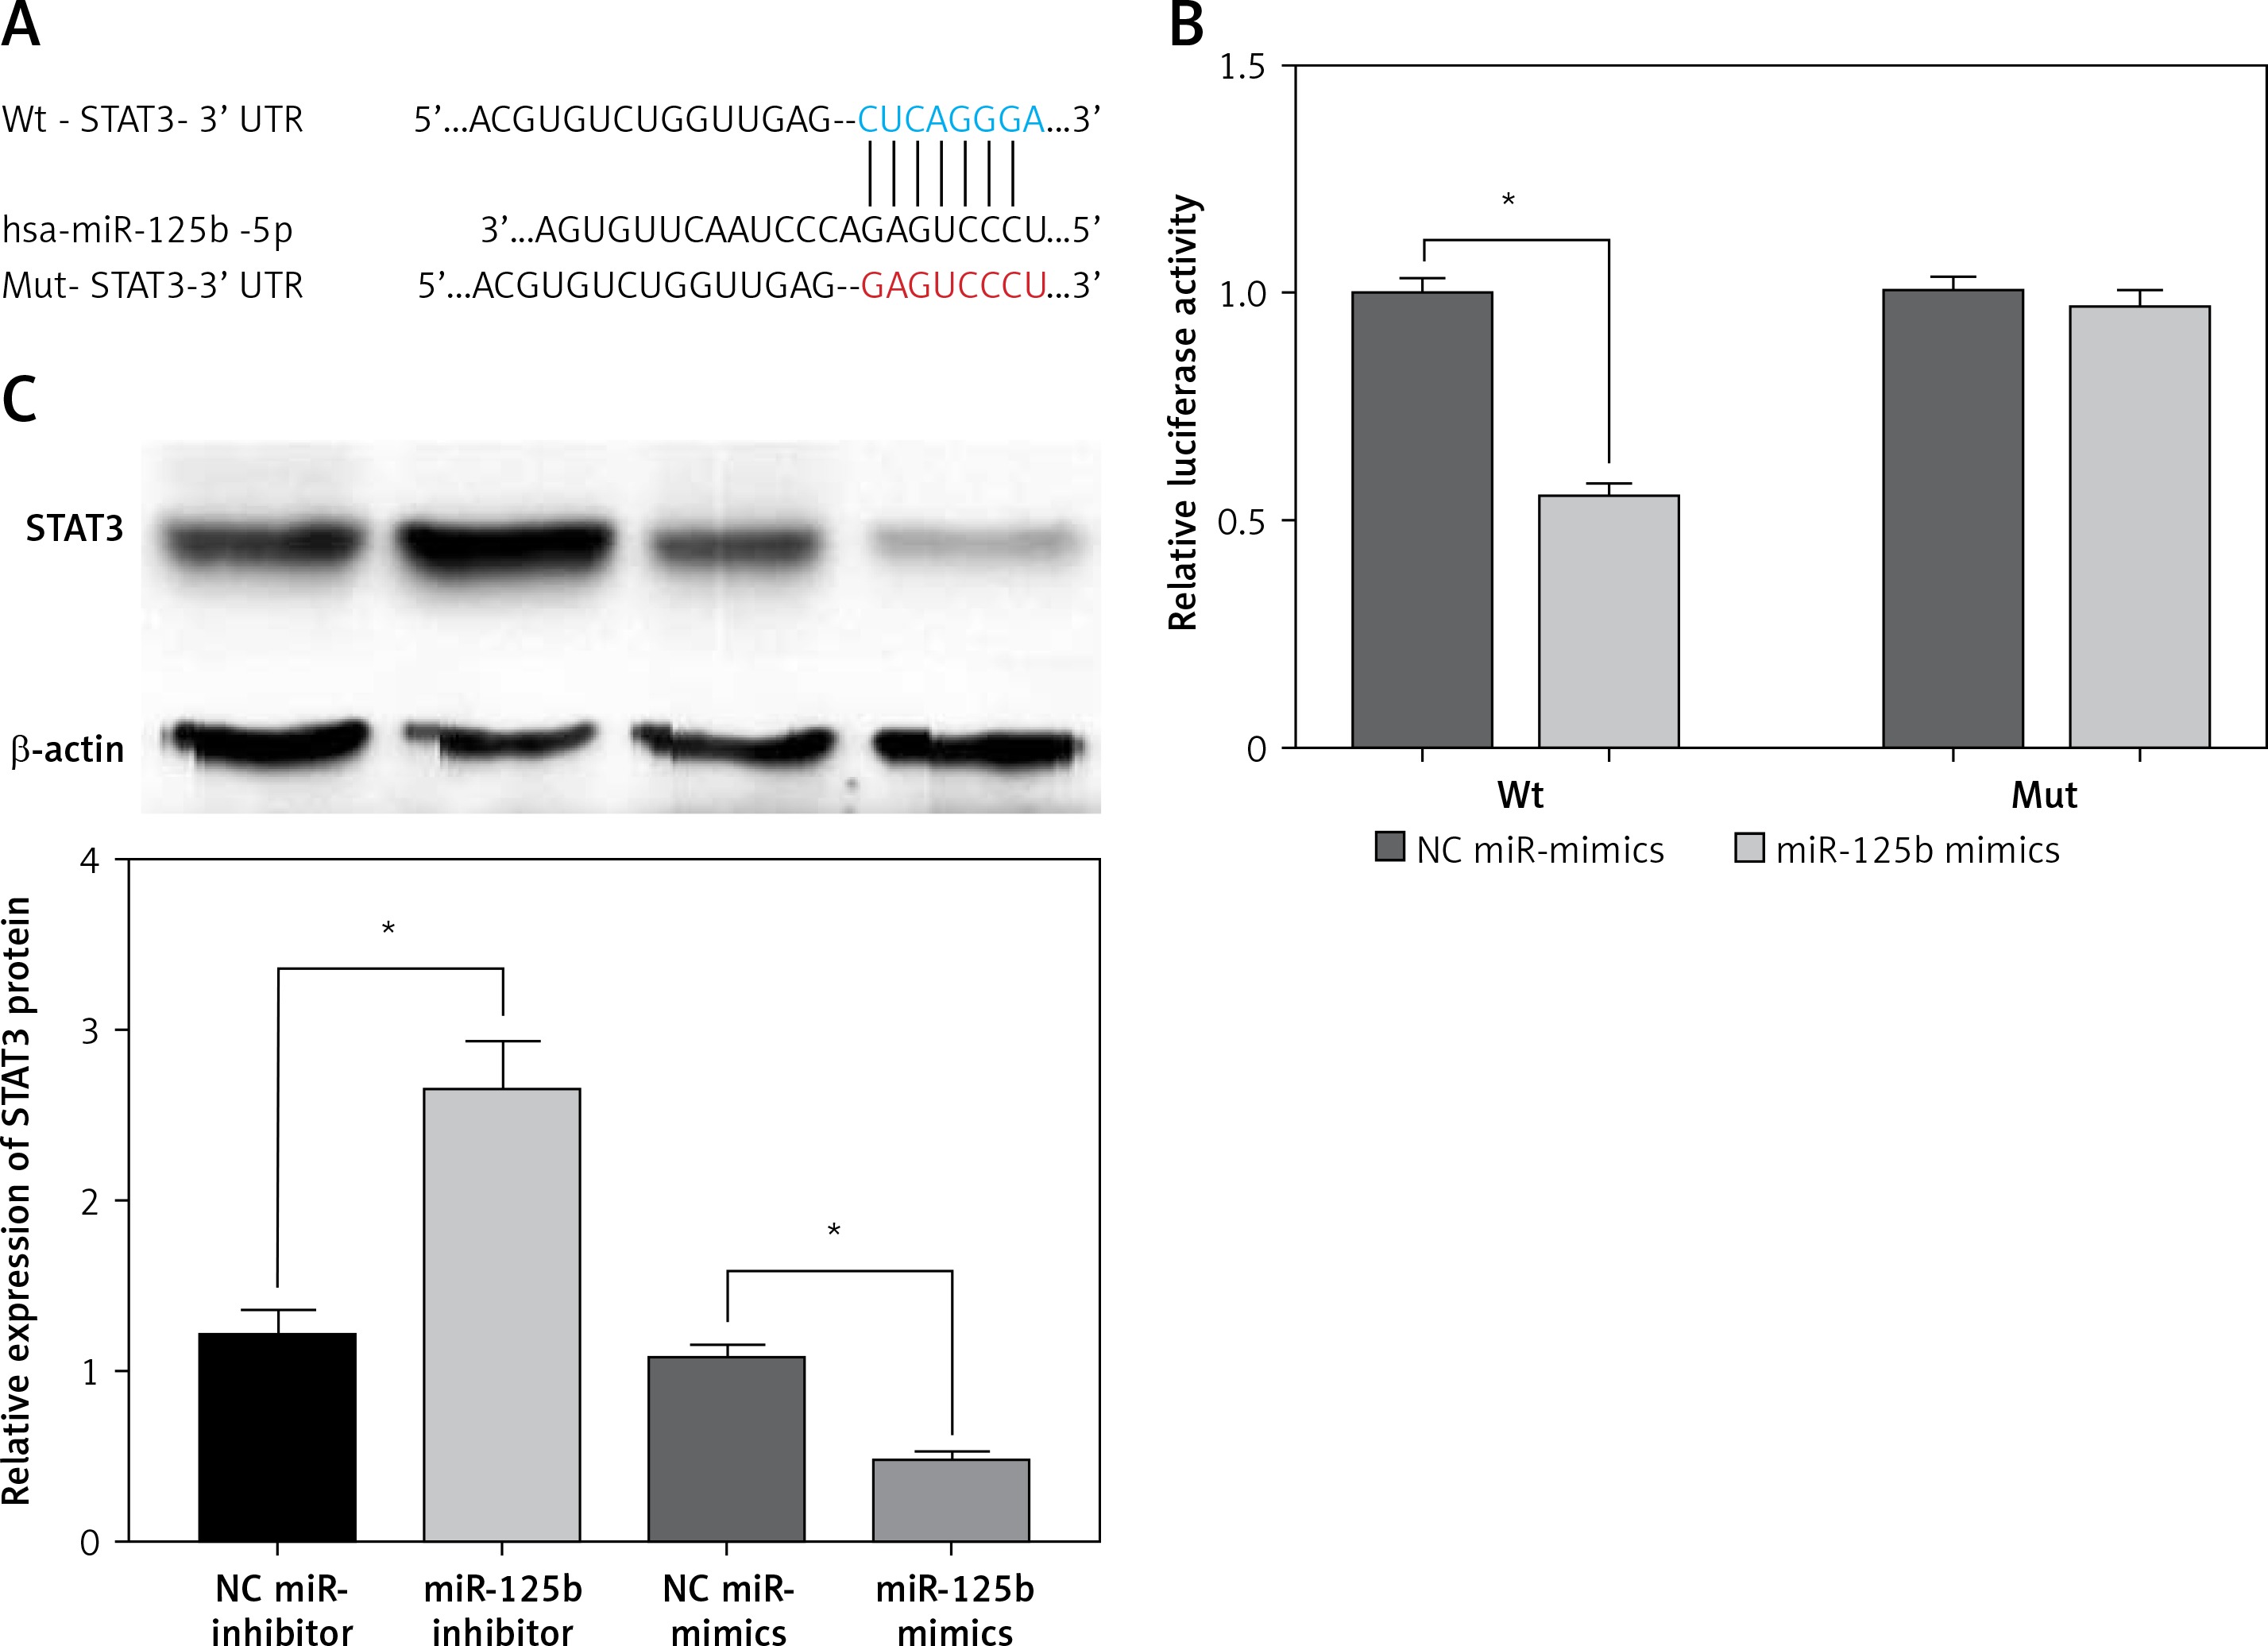
To verify the targeted regulatory relationship between miR-125b and STAT3, we constructed the wild-type and mutant STAT3-3 ‘UTR reporter gene vector (Figure 2 A). The miR-125b mimics or NC miR-mimics with wild-type or mutant STAT3-3’UTR reporter gene vector were co-transfected into HaCaT cells, and the luciferase activity was tested. The outcomes revealed that the activity of luciferase in the co-transfected wild-type STAT3-3’UTR reporter gene vector and miR-125b mimics group was markedly decreased (p < 0.05) (Figure 2 B). However, when miR-125b mimics and mutant STAT3-3’UTR reporter vectors were co-transfected into HaCaT cells the activity of luciferase did not change markedly (Figure 2 B). The above results indicate miR-125b can directly connect to the binding site of STAT3-3’UTR and negatively regulate STAT3. As shown in Figure 2 C, the protein content of STAT3 was remarkably reduced in over-expressing miR-125b HaCaT cells but was remarkably increased in low-expression miR-125b HaCaT cells (p < 0.05).
Figure 2
STAT3 is a target gene of miR-125b. A – Predicted binding sites of miR-125b to STAT3-3 ‘UTR and the design of mutant STAT3-3’UTR reporter gene vectors. B – Mutant or Wild-type STAT3-3’UTR reporter gene constructs were co-transfected with miR-125b mimics or negative-control miR-mimics into HaCaT cells separately. Luciferase activities in transfected HaCaT cells were detected after 48 h (*p < 0.05). C – MiR-125b inhibitor, miR-125b mimics, and their NC-controls were transfected into HaCaT cells separately, and STAT3 protein was then detected by western blot (*p < 0.05). Data are from three independent experiments and presented as mean ± SD
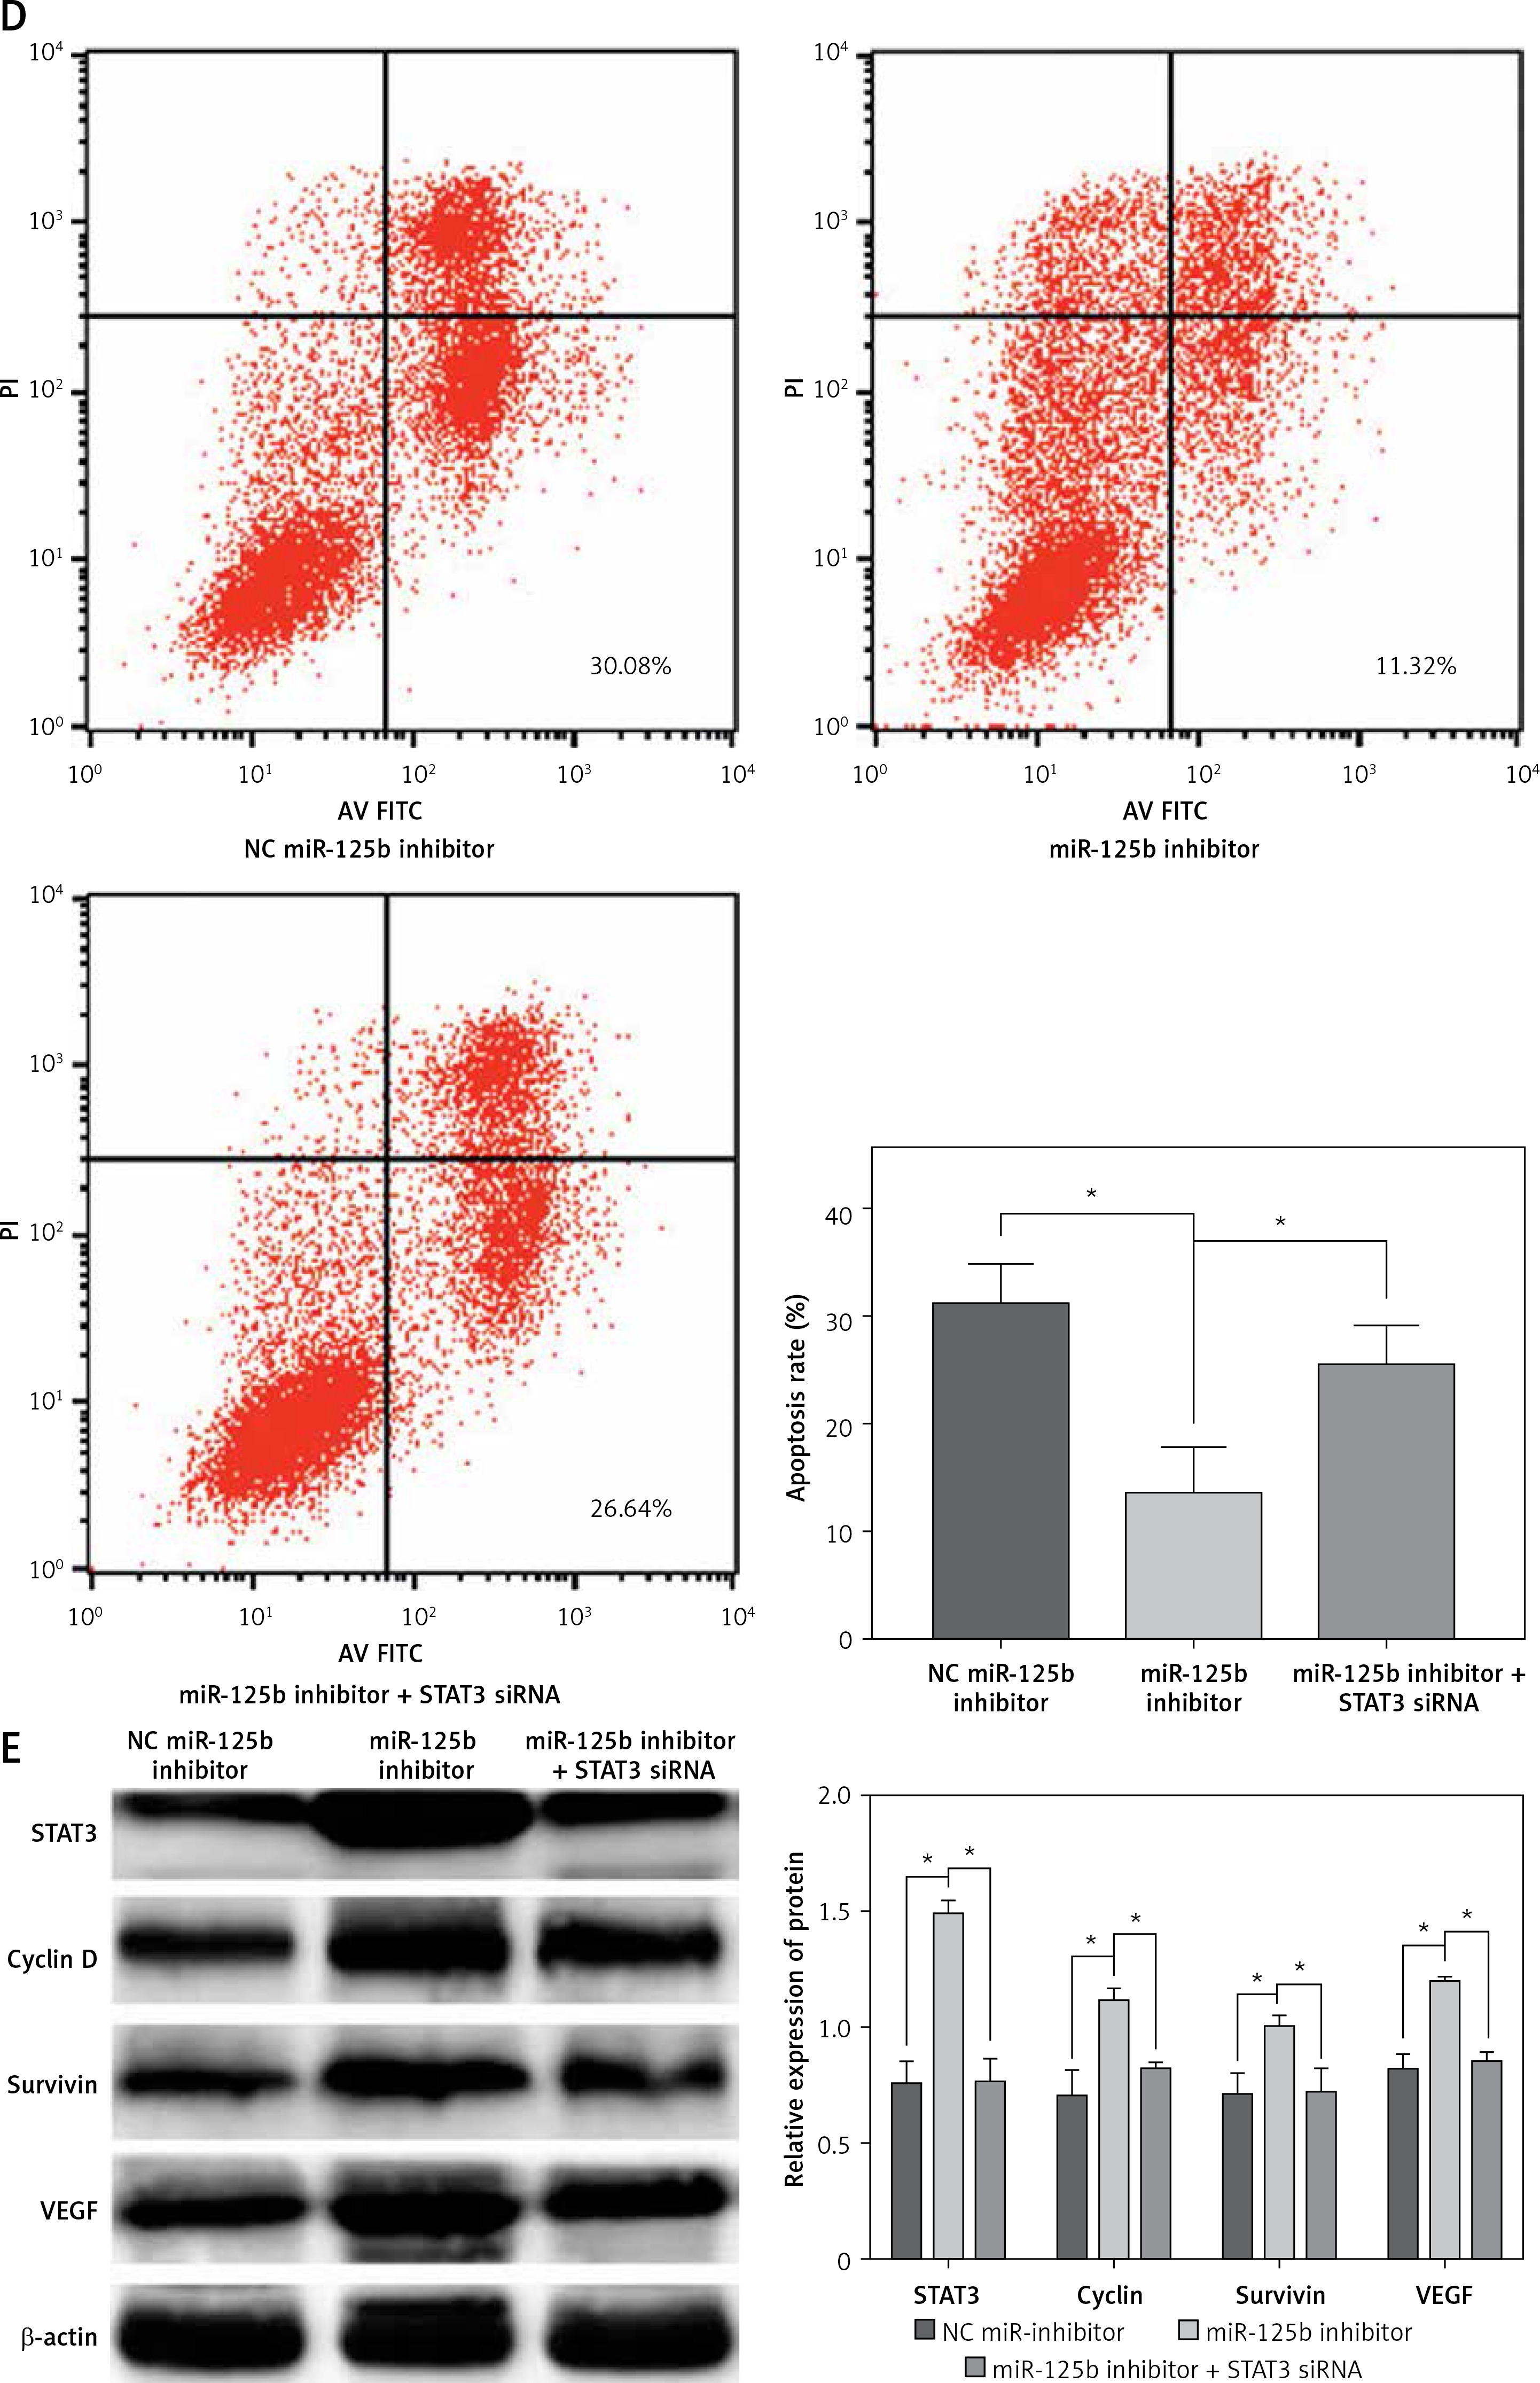
Inhibition of miR-125b enhances proliferation and reduces apoptosis in HaCaT cells through up-regulation of STAT3 and downstream genes
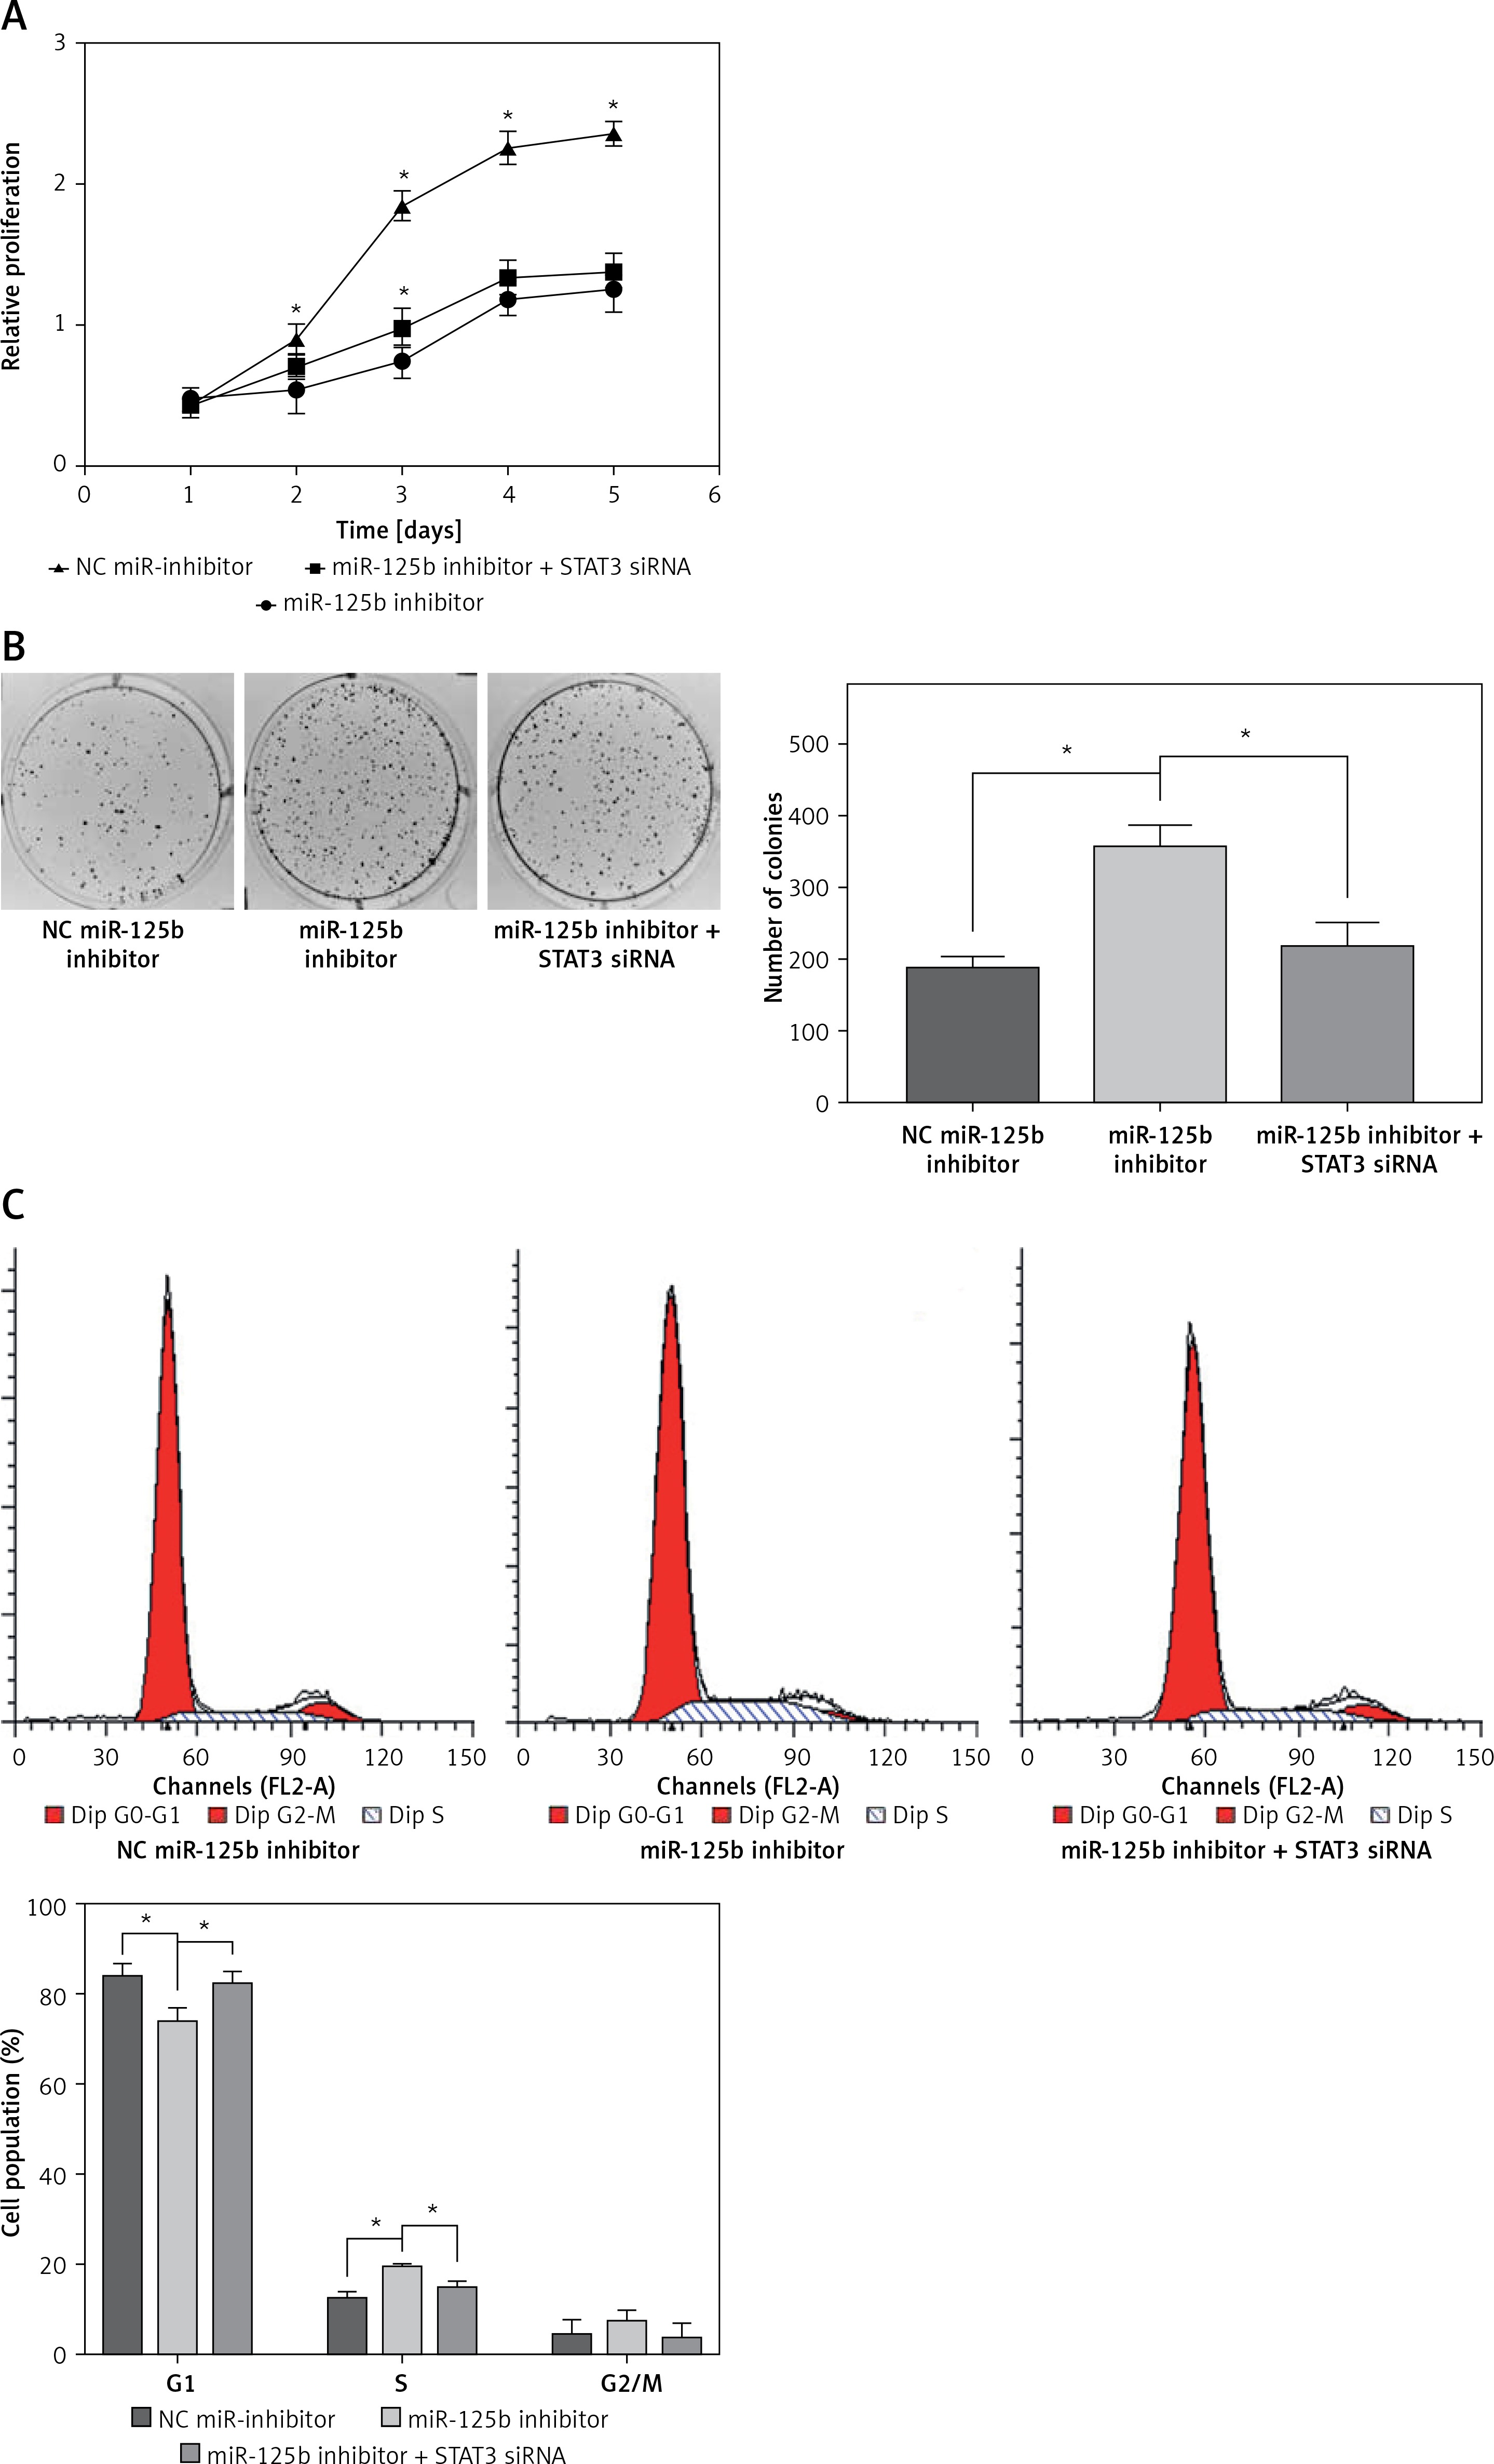
MiR-125b in cholesteatoma was low expression, as previously demonstrated, so we inhibited the expression of miR-125b and observed the changes of cell biological behaviour in HaCaT cells. At the same time, the miR-125b inhibitor and STAT3 siRNA were co-transfected into the HaCaT cells to observe whether the changes in the biological behaviour of the cell were reversed. The results of colony formation and MTS cell proliferation demonstrated that inhibition of miR-125b expression could significantly enhance the proliferation of cells (p < 0.05) (Figures 3 A, B). The outcomes of flow cytometry revealed that the proportion of cells was increased in the S phase and decreased in the G1 phase. The proportion of early apoptotic cells was significantly reduced (p < 0.05) (Figures 3 C, D). However, through co-transfection with STAT3 siRNA and miR-125b inhibitor, the ability for proliferation and anti-apoptosis was restored (p < 0.05) (Figures 3 A–D). The results of western blot revealed that the expressions of STAT3 and its downstream genes, including cyclin D1, survivin, and VEGF, were all significantly increased in HaCaT cells when miR-125b was inhibited (Figure 3 E) (p < 0.05). When HaCaT cells were co-transfected with miR-125b inhibitor and STAT3 siRNA, the expressions of STAT3, cyclin D1, survivin, and VEGF were down-regulated to the level of the control group (Figure 3 E).
Figure 3
Inhibition of miR-125b enhances proliferation and reduces apoptosis in HaCaT cells through up-regulating STAT3 and downstream genes. HaCaT cells were divided into three groups and transfected with NC miR-inhibitor or miR-125b inhibitor or miR-125b inhibitor + STAT3 siRNA, respectively. A, B – Cell proliferation was analysed by MTS and colony formation assay. C, D – Analysis of changes in cell cycle and apoptosis was by flow cytometry (*p < 0.05). D – Analysis of changes in cell cycle and apoptosis was by flow cytometry (*p < 0.05). E – Expression and analysis of STAT3, cyclin D1, survivin, and VEGF proteins in the three groups (*p < 0.05). Data are shown as the mean ± SD of three independent experiments
The expression of STAT3, cyclin D1, survivin, and VEGF in cholesteatoma and skin
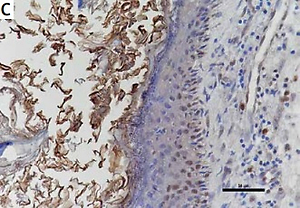
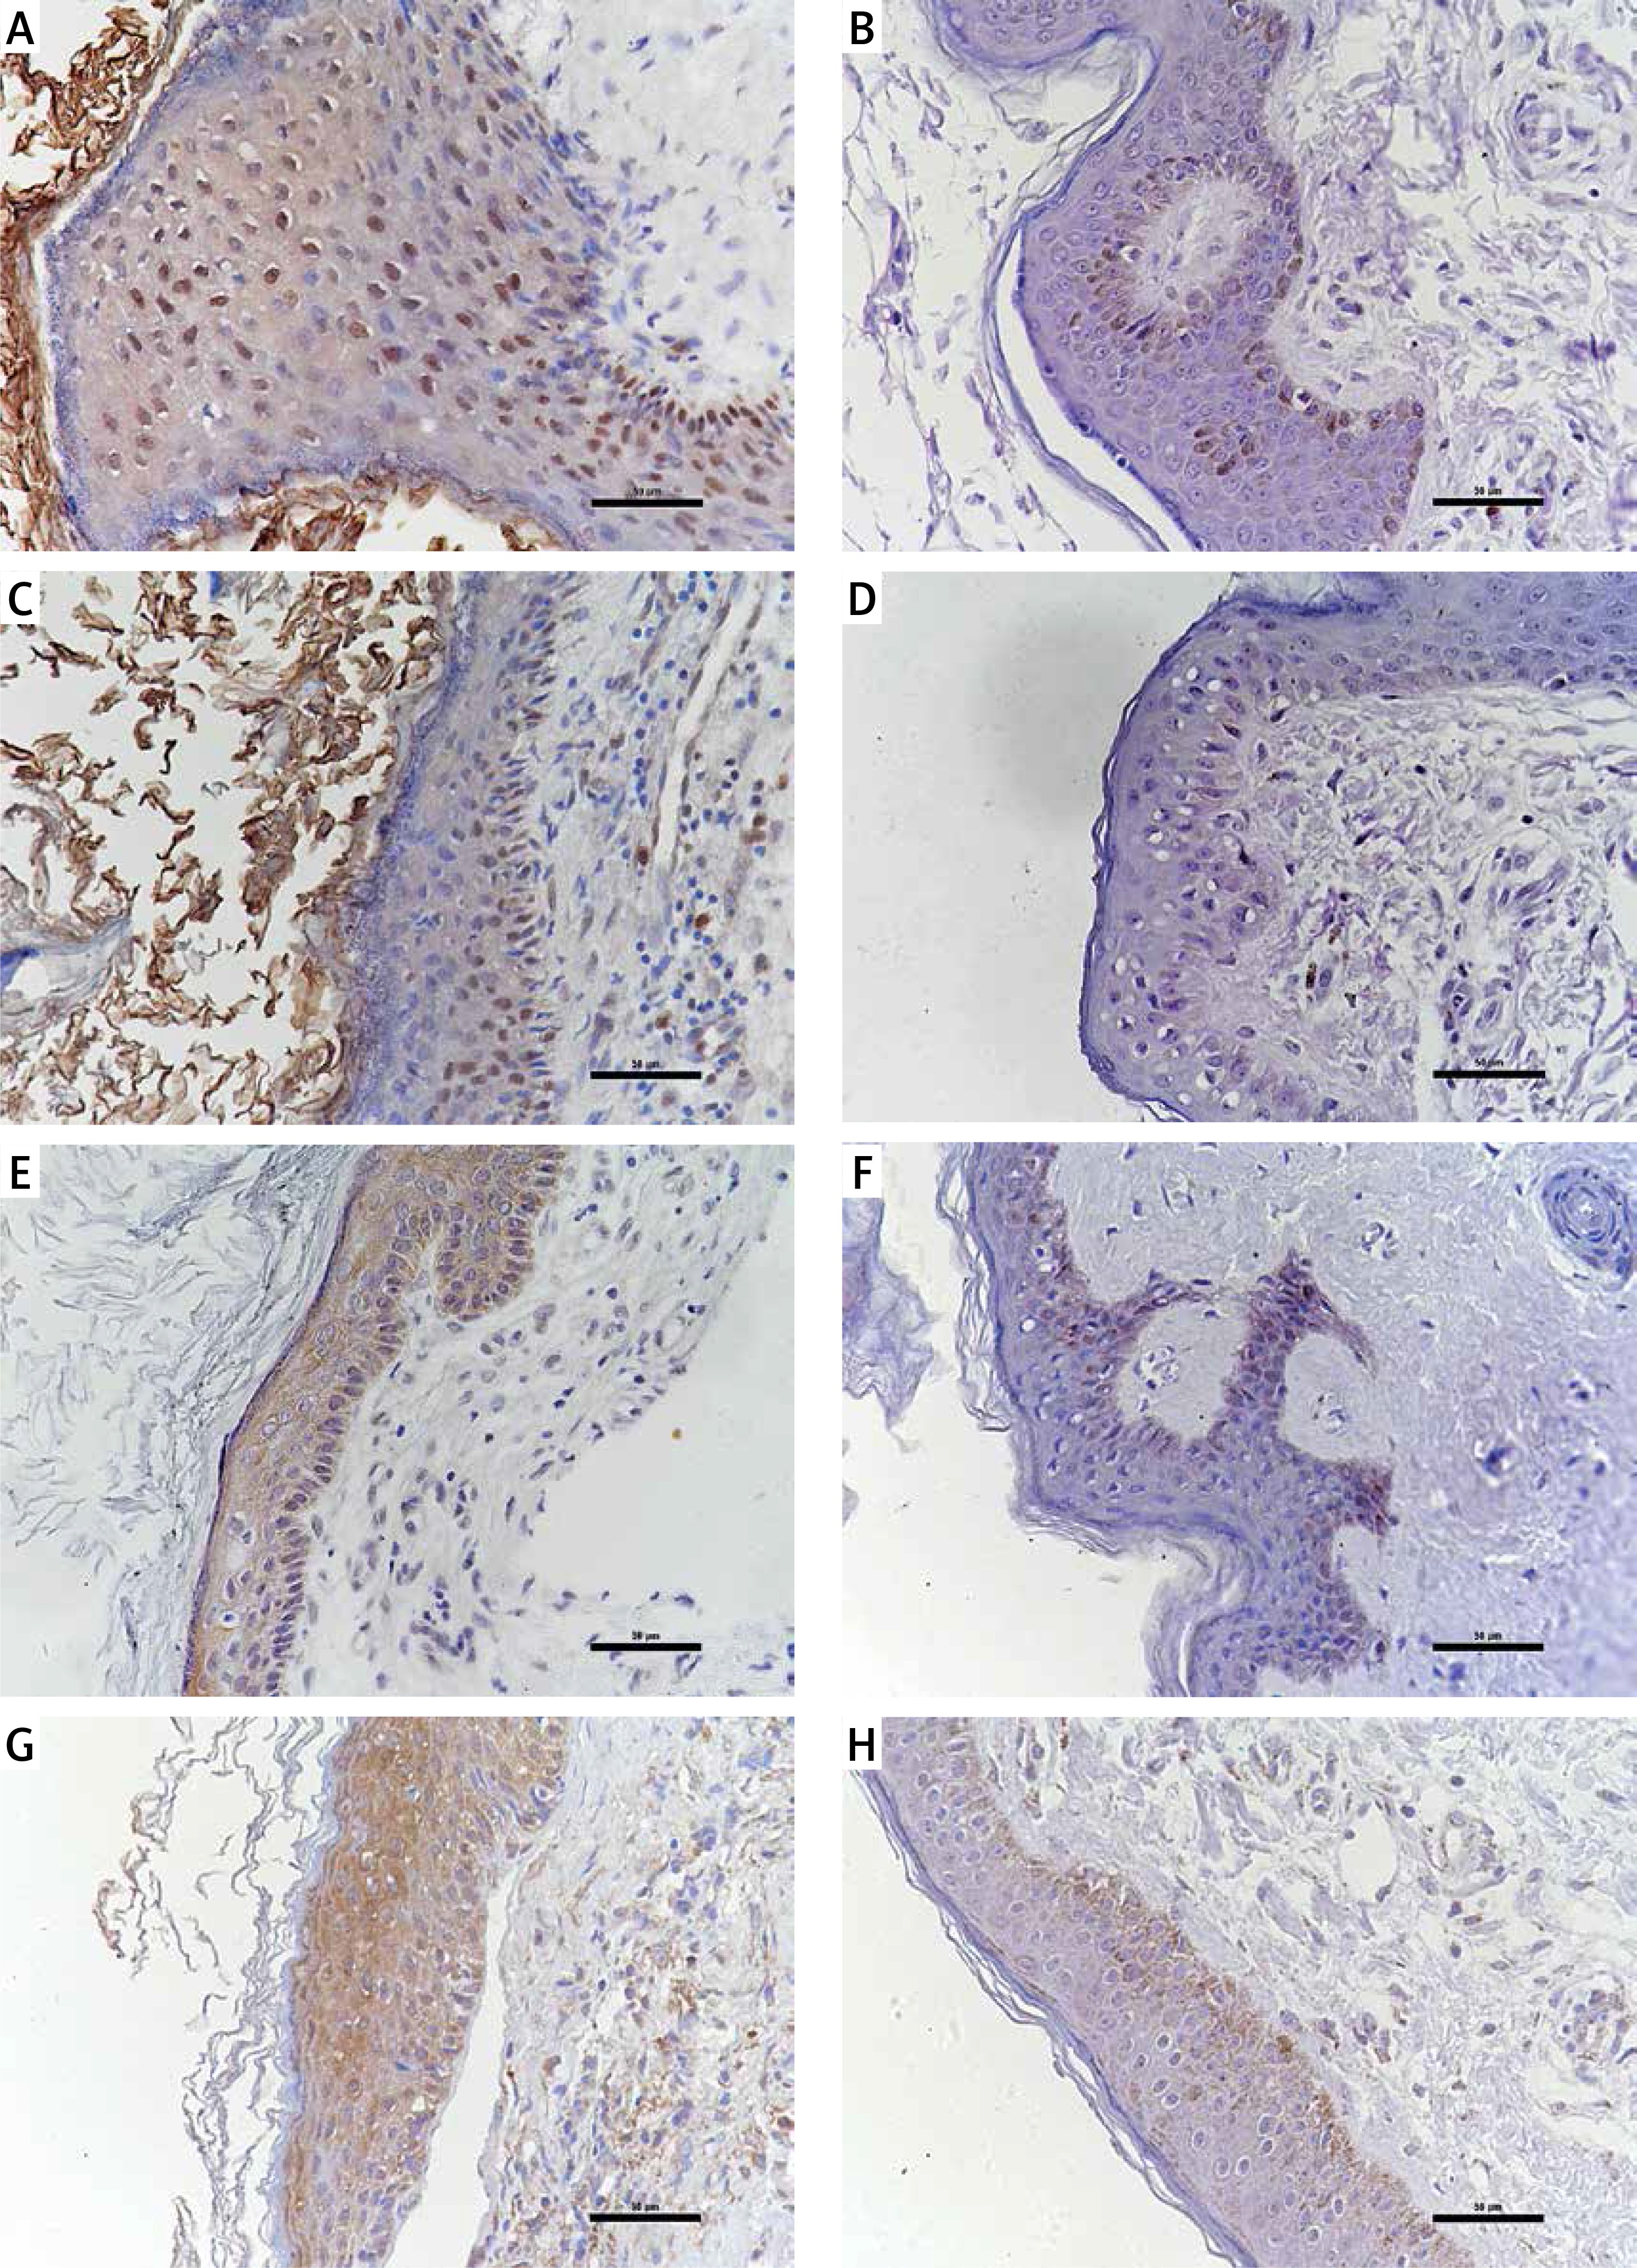
Studies have shown that STAT3 can activate cyclin D1, survivin, and VEGF to participate in the development of a variety of tumours, and some researchers have proven that these pathways exist in the pathomechanism of cholesteatoma. Therefore, we detected the proteins of STAT3, cyclin D1, survivin, and VEGF in 24 pairs of cholesteatoma with its own control (the corresponding retroauricular skin). Immunohistochemistry showed that STAT3 was both cytoplasm and nucleus stained in the whole layer of the cholesteatoma epithelium (Figure 4 A). Cyclin D1 in the cholesteatoma epithelium was predominantly nucleus brown stained in the basal layer and suprabasal layer (Figure 4 C); survivin was predominantly cytoplasm brown stained in the whole layer (Figure 4 E); and VEGF was predominantly cytoplasm brown stained in the whole layer (Figure 4 G). The staining intensity and staining area of STAT3, cyclin D1, survivin, and VEGF were greater in cholesteatoma epithelium than in retroauricular skin (Figure 4). The positive staining rate of STAT3, cyclin D1, survivin, and VEGF in cholesteatoma was 83.3% (20/24), 62.5% (15/24), 70.8% (17/24), and 87.5% (21/24), respectively, while it was 20.8% (5/24), 8.3% (2/24), 33.3% (8/24), and 37.5% (9/24) in the normal retroauricular skin, respectively. The differences of positive staining rate between cholesteatoma and skin were all remarkable (p < 0.05) (Table I). We also found that the positive staining rates of STAT3 and cyclin D1 were positively correlated (p = 0.003), STAT3 and survivin (p = 0.027), STAT3 and VEGF (p = 0.011) in 24 cases of cholesteatoma.
Discussion
Previous studies have found that miR-125b can inhibit the occurrence and development of neoplastic diseases [7, 8]. Meanwhile, MiR-125b was shown to be down-regulated in psoriasis and cutaneous squamous cell carcinoma, and its overexpression can suppresses the proliferation of keratinocytes [9–11]. Cholesteatoma has the same abnormal proliferation characteristics as malignancies, which has been confirmed by many studies which found that many tumour-related genes and proliferation markers had abnormally high expression in cholesteatoma [26, 27]. Similar to psoriasis, cholesteatoma has aberrant proliferation of keratinocytes in an environment full of inflammation. Therefore, we speculate that miR-125b in cholesteatoma may also be down-regulated. Our study identified that miR-125b has a significant reduction in cholesteatoma compared to retroauricular normal skin (Figures 1 A, C), which was consistent with the performance in some malignant tumours and psoriasis. This is likely due to the lack of regulation of miR-125b in cholesteatoma, in which the proliferative ability of keratinocytes was uncontrolled and caused excessive growth of the cholesteatoma.
STAT3 was found to have abnormally high expression in diseases with abnormal proliferation of keratinocytes; for instance, skin cancer and psoriasis [15, 28–31]. Several studies have shown that STAT3 is an important regulator of keratinocyte function, playing an important role in promoting proliferation as well as inhibiting differentiation and senescence of keratinocytes [32, 33]. Cholesteatoma also demonstrates characteristics of abnormal keratinocytic proliferation. Thus, we assayed the levels of STAT3 protein in cholesteatoma and the corresponding retroauricular skin. Western blot revealed that the level of STAT3 protein in cholesteatoma was evidently higher than that in normal corresponding retroauricular skin tissue (Figures 1 B, D). This finding is concordant with the findings of other researchers [19, 20]. The result suggested that STAT3 is involved in the development of cholesteatoma, and it was indicative of the high proliferation of the cholesteatoma epithelium. Meanwhile, various studies have shown that STAT3 is epigenetically regulated by miRNAs [34, 35]. The results of statistical analysis of correlation showed that miR-125b and STAT3 were negatively correlated in cholesteatoma (Figure 1 E). In addition, we predicted that STAT3’UTR and miR-125b had a conserved binding site by using bioinformatics software (Figure 2 A). Therefore, we hypothesised that miR-125b could influence the proliferation of keratinocytes by regulating the expression of STAT3. The result of dual-luciferase reporter gene assay showed STAT3 was the target gene of miR-125b (Figure 2 B). MiR-125b was capable of regulating STAT3 negatively in Ha-CaT cells (Figure 2 C). These results indicate that low expression of miR-125b causes disinhibition of STAT3, which increases STAT3 expression in cholesteatoma.
Because of the low expression of miR-125b in cholesteatoma, as previously revealed, we transfected the miR-125b inhibitor into HaCaT cells and then observed whether the biological behaviour of HaCaT cells was changed to favour hyperproliferation and low apoptosis, similar to the keratinocytes in cholesteatoma. The results of MTS and colony formation assay indicated that the proliferation ability of HaCaT cells was obviously enhanced (Figures 3 A, B). The results of flow cytometry revealed that the early apoptosis rate of keratinocytes was evidently reduced and that the cells in the S phase were significantly increased (Figures 3 C, D). However, when HaCaT cells were co-transfected with miR-125b inhibitor and STAT3 siRNA, these changes in proliferation and anti-apoptotic ability were restored to almost the same level as those in the control group. These findings imply that inhibition of miR-125b expression in cholesteatoma may contribute to high proliferation and low apoptosis by increasing the expression of STAT3.
However, STAT3 is required to influence the biological behaviour of cholesteatoma through its downstream regulatory mechanism. Numerous studies have shown that STAT3 can enhance the activity of cyclin D1, survivin, and VEGF in keratinocytes to regulate the cell cycle, fight apoptosis, and ultimately enhance keratinocyte proliferation ability [16–18]. By western blot, we detected that when the expression of miR-125b was down-regulated the STAT3 protein was significantly up-regulated, and cyclin D1, survivin, and VEGF were also up-regulated simultaneously (Figure 3 E). However, when we co-transfected miR-125b inhibitor and STAT3 siRNA into HaCaT cells, the expressions of cyclin D1, survivin, and VEGF were all down-regulated with STAT3 (Figure 3 E). The above findings show that MiR-125b can affect the expressions of cyclin D1, survivin, and VEGF by targeting the expression of STAT3 in order to regulate cell biological behaviour. Immunohistochemical staining showed that the positive staining rates of STAT3, cyclin D1, survivin, and VEGF in cholesteatoma were significantly higher than in skin (Figure 4). These results are consistent with previous reports [22–25]. Moreover, positive staining of STAT3 and positive staining of cyclin D1, survivin, and VEGF in cholesteatoma shared a significant positive correlation. All of these findings indicate that the expressions of cyclin D1, survivin, and VEGF in cholesteatoma are increased and are probably affected by the regulation of STAT3.
In conclusion, our results demonstrated that the down-regulation of miR-125b expression in cholesteatoma promotes keratinocytes proliferation and represses apoptosis by directly disinhibiting STAT3, after which it promotes cyclin D1, survivin, and VEGF expression. Finally, the mechanism of cholesteatoma from MiR-125b to STAT3 and their downstream genes was obtained. We hope that the conclusions of this study can be helpful for further study of the pathogenesis of cholesteatoma and provide an opportunity to seek new medical therapy strategies.