Introduction
Osteoporosis is a prevalent skeletal disease characterized by an elevated risk of fractures and is associated with numerous complications affecting patients’ quality of life [1]. Osteoporosis is a multifactorial disease influenced by various genetic, metabolic, and lifestyle factors [2]. Among many risk factors for osteoporosis, the association between type 1 diabetes mellitus (T1DM) and this bone disease has garnered significant attention [3]. Previous observational studies demonstrated that T1DM was associated with an increased risk of osteoporosis, resulting in a higher incidence of fractures compared to controls [4, 5]. However, these studies are constrained by retrospective design, small sample sizes, and confounding bias, making it difficult to infer causality [6]. While the impact of T1DM on bone health has been studied, the mechanisms linking T1DM and osteoporosis remain unclear.
Both T1DM and osteoporosis are closely associated with metabolic disturbances, highlighting the need to explore specific processes involved. In this study, five candidate mediators – body mass index (BMI), HbA1c, cholesterol in medium very low-density lipoprotein particles (M-VLDL-C), saturated fatty acids (SFA), and sex hormone-binding globulin (SHBG) – were selected. BMI is a crucial indicator of metabolic status and has been implicated in osteoporosis risk through its influence on bone loading and adipokine regulation [7]. HbA1c reflects chronic hyperglycemia and is associated with impaired bone quality and increased fracture risk in diabetes [8]. Lipid metabolism markers, such as M-VLDL-C and SFA, were implicated in cell signaling and inflammation, which are critical in bone remodeling and are frequently altered in diabetes [9, 10]. SHBG regulates the bioavailability of sex hormones, such as testosterone and estradiol, which are critical for maintaining bone mineral density (BMD). Higher circulating SHBG levels have been associated with lower BMD and increased osteoporosis risk, making it imperative to clarify the hormonal influences in T1DM-related osteoporosis [11]. Overall, these mediators were selected for their metabolic roles that influence bone health. Exploring these mediators may provide a framework for understanding the metabolic mechanism underlying the association between T1DM and osteoporosis.
In this study, we used Mendelian randomization (MR), a method that leverages genetic variants as proxies for causal inference, to investigate the causal relationship between T1DM and osteoporosis, and to identify related mediators in this association. This approach enables us to unravel the complex interactions among T1DM, metabolic factors, and bone health, while addressing the limitations of traditional observational studies, such as confounding and reverse causation. Moreover, we validated our findings in a UK Biobank (UKB) prospective cohort study, enhancing the robustness of our results. Our study provides an insight into the metabolic processes underlying the causal relationship between T1DM and osteoporosis. The identified mediators may offer new therapeutic targets to mitigate osteoporosis risk in T1DM patients.
Material and methods
Study design
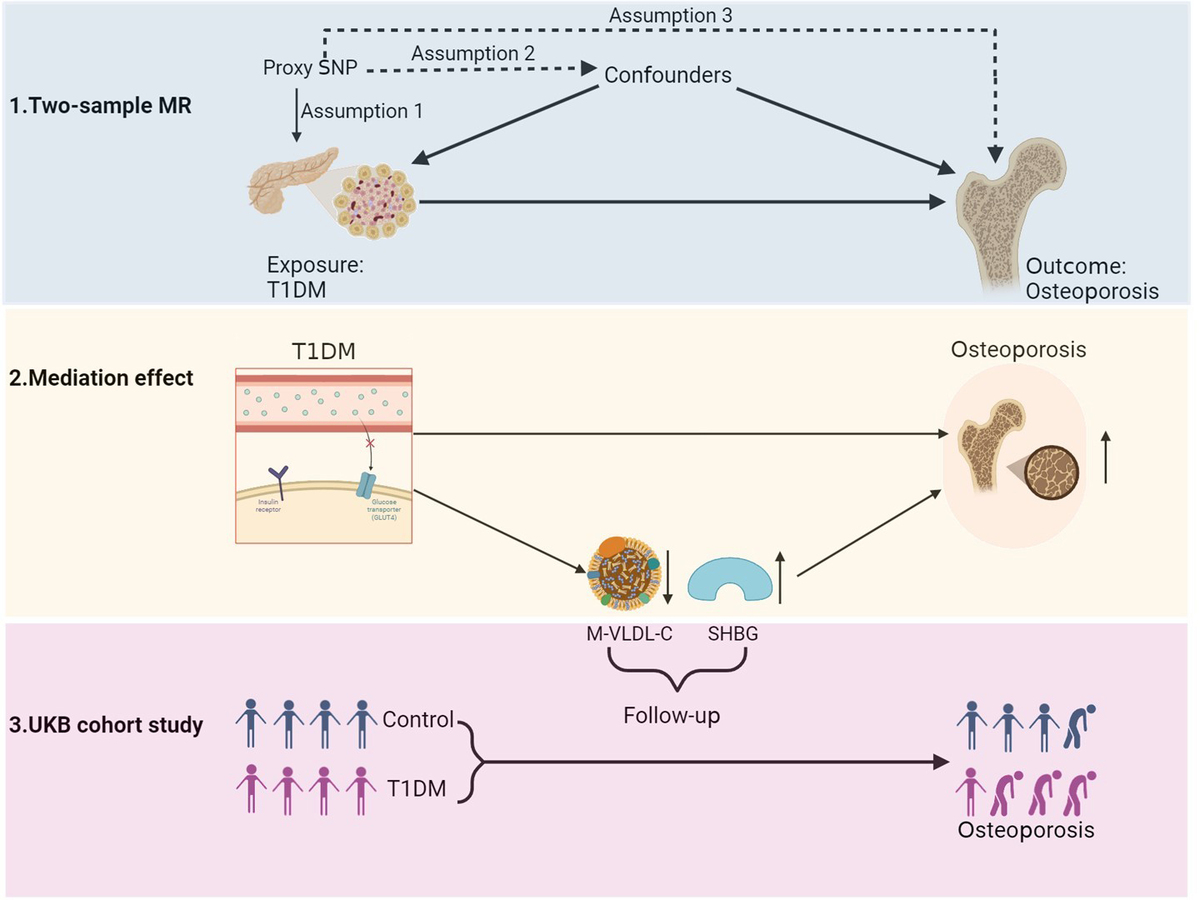
We used mediation MR to evaluate the causal relationship and identify eligible mediators. The exposure is T1DM. The outcome is osteoporosis. The candidate mediators are BMI, HbA1c, M-VLDL-C, SFA, and SHBG. Briefly, our study design comprised the following steps:
(1) Testing the causal association between T1DM and osteoporosis by two-sample MR.
(2) Identifying eligible mediators by two-step MR. First, we evaluated the causal effect of T1DM on each candidate mediator, retaining the significant mediators. Second, we tested the causal effect of each mediator on osteoporosis. Those significant in both steps were considered eligible mediators.
(3) Evaluating the causal effect of T1DM on osteoporosis modified by eligible mediators and calculating the proportion mediated (PM) by each mediator.
(4) Using a UKB prospective cohort study to validate the findings from MR analysis.
Obtaining instrumental variables for exposure, outcome, and mediators
From the IEU OpenGWAS database, we used the GWAS ID “ebi-a-GCST010681” to obtain instrumental variables (IVs) for T1DM, “finn-b-M13_OSTEOPOROSIS” for osteoporosis, “ukb-a-248” for BMI, “ukb-d-30750_irnt” for HbA1c, “met-d-M-VLDL-C” for M-VLDL-C, “met-d-SFA” for SFA, and “ebi-a-GCST90012106” for SHBG. Valid IVs for MR analysis were selected according to predefined criteria. First, we extracted SNPs significantly associated with the exposure at a genome-wide level (p < 5 × 10⁻⁸). Next, we pruned SNPs to ensure independence, retaining those with a linkage disequilibrium (LD) threshold of r2 < 0.001 and a genomic distance greater than 10,000 kb. We then harmonized the SNPs across datasets to ensure consistency in alleles, reference panels, and genomic coordinates. To minimize confounding, we screened the SNPs using a PhenoScanner search and excluded those associated with potential confounders. Finally, we assessed the strength of the IVs by calculating the F-statistic and retained SNPs with F > 10, ensuring that the IVs were not weak.
Evaluating the causal relationship between T1DM and osteoporosis
We evaluated the causal relationship between T1DM and osteoporosis by two-sample MR. Our primary analysis used the inverse-variance weighted (IVW) approach, which combines genetic variant effects to provide a weighted estimate of the causal effects [12]. We used the MR-Egger regression and weighted median methods as complementary analyses. P < 0.05 in the IVW method denoted a statistically significant causal association. In addition, we applied Cochran’s Q test to assess heterogeneity and the MR-Egger intercept test to detect horizontal pleiotropy in MR analysis. Finally, we calculated the statistical power of the MR study using the mRnd tool (https://shiny.cnsgenomics.com/mRnd).
Identifying eligible mediators by two-step MR
To identify eligible mediators, we first assessed the causal effect of T1DM on each candidate mediator by two-sample MR. Judged by p < 0.05 in the IVW method, we retained the significant mediators. Next, we examined the causal effect of each significant mediator on osteoporosis by two-sample MR. Considering p > 0.05 in the pleiotropy test, only those significant in the IVW method of both steps were considered as eligible mediators.
Mediation effect analysis
We examined the mediation effects of eligible mediators on the causal association between T1DM and osteoporosis by multivariable Mendelian randomization (MVMR), which can adjust multiple mediators to disentangle their specific effects [13]. We could estimate the direct effect of T1DM on osteoporosis, while accounting for the modifying effects of the identified mediators by MVMR. Moreover, we calculated the PM by eligible mediators from a published algorithm [14].
Prospective cohort study
We used a UKB prospective cohort study to validate the MR findings. In the UKB database, T1DM cases can be recognized by multiple features, including self-reported data, clinical records, medication use, and ICD-10 diagnosis [15]. The primary definition of T1DM is ICD-10 diagnosis, with a higher accuracy than other records. Osteoporosis cases were defined by linkage of primary health records and validated by ICD-10 diagnosis. The ICD-10 code for T1DM is E10, and the codes for osteoporosis are M80, M81, and M82. The levels of mediators, such as M-VLDL-C and SHBG, are available in the UKB. A number of covariates were collected at baseline, including sex, age, education, income, BMI, waist circumference, hip circumference, smoking status, alcohol status, fresh fruit intake, vitamin D, HbA1c, M-VLDL-C, SHBG, fractures in 5 years, and falls in the last year. Participants with incomplete data on mediators and important covariates were excluded from the initial cohort. Participants were followed from the date of attending the assessment center until the earliest date of the following events: loss to follow-up, death, diagnosis of osteoporosis, or study completion on October 7, 2022.
Statistical analysis
We described the differences of baseline characteristics between non-T1DM and T1DM groups in the UKB cohort. For continuous variables, values were expressed as mean and standard deviation (SD), and differences were assessed using the Mann-Whitney U test. For categorical variables, counts and percentages were reported, and differences between the two groups were evaluated using the χ2 test. The correlation of T1DM and mediators with osteoporosis risk was assessed using a multivariable Cox proportional hazards model, with hazard ratios (HR) and corresponding 95% confidence intervals (CI) reported. All statistical analyses were performed using R software (version 4.4.1). A two-tailed p < 0.05 was considered statistically significant.
Results
Causal effect of T1DM on osteoporosis
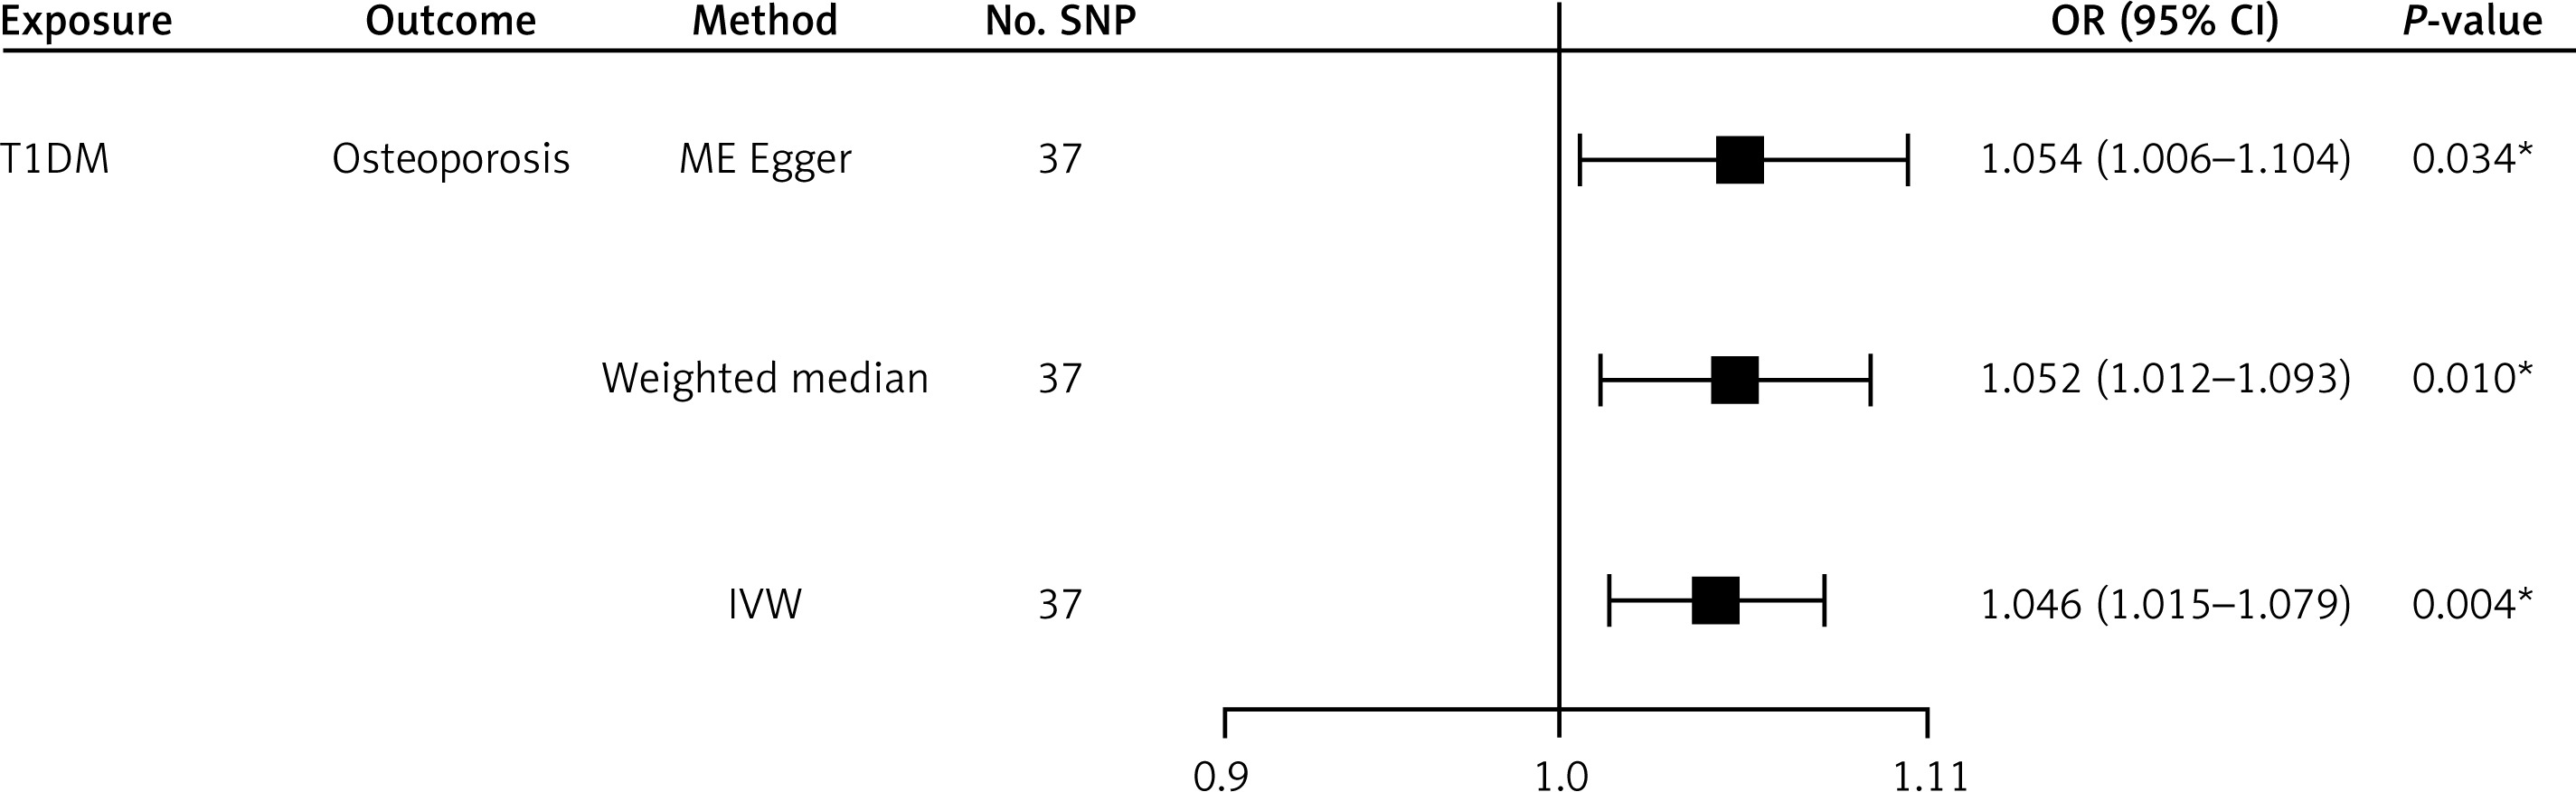
After the filtering steps above, we collected 37 SNPs as IVs for T1DM. We calculated the variance explained (R2) by these SNPs and confirmed F > 10 of all remaining SNPs, thereby excluding weak IVs. To address potential confounding, we checked these SNPs for associations with known confounders in a PhenoScanner search. SNPs significantly associated with confounders were excluded. The IVW result indicated that T1DM was significantly associated with an elevated risk of osteoporosis (OR = 1.046, 95% CI: 1.015 to 1.079, p = 0.004). Moreover, MR-Egger regression also showed a positive causal effect of T1DM on osteoporosis (OR = 1.054, 95% CI: 1.006 to 1.104, p = 0.034). The weighted median method still showed a consistent result (Figure 1). Heterogeneity analysis showed IVW: Q = 44.9, p = 0.146; MR Egger: Q = 44.7, p = 0.125, indicating no significant heterogeneity. In pleiotropy analysis, the MR-Egger intercept was approximately –0.004, p = 0.689, showing no significant horizontal pleiotropy (Supplementary Table SI). The statistical power of this MR analysis was 0.96 in mRnd. These results indicate that T1DM may increase the risk of osteoporosis.
Causal effect of T1DM on candidate mediators
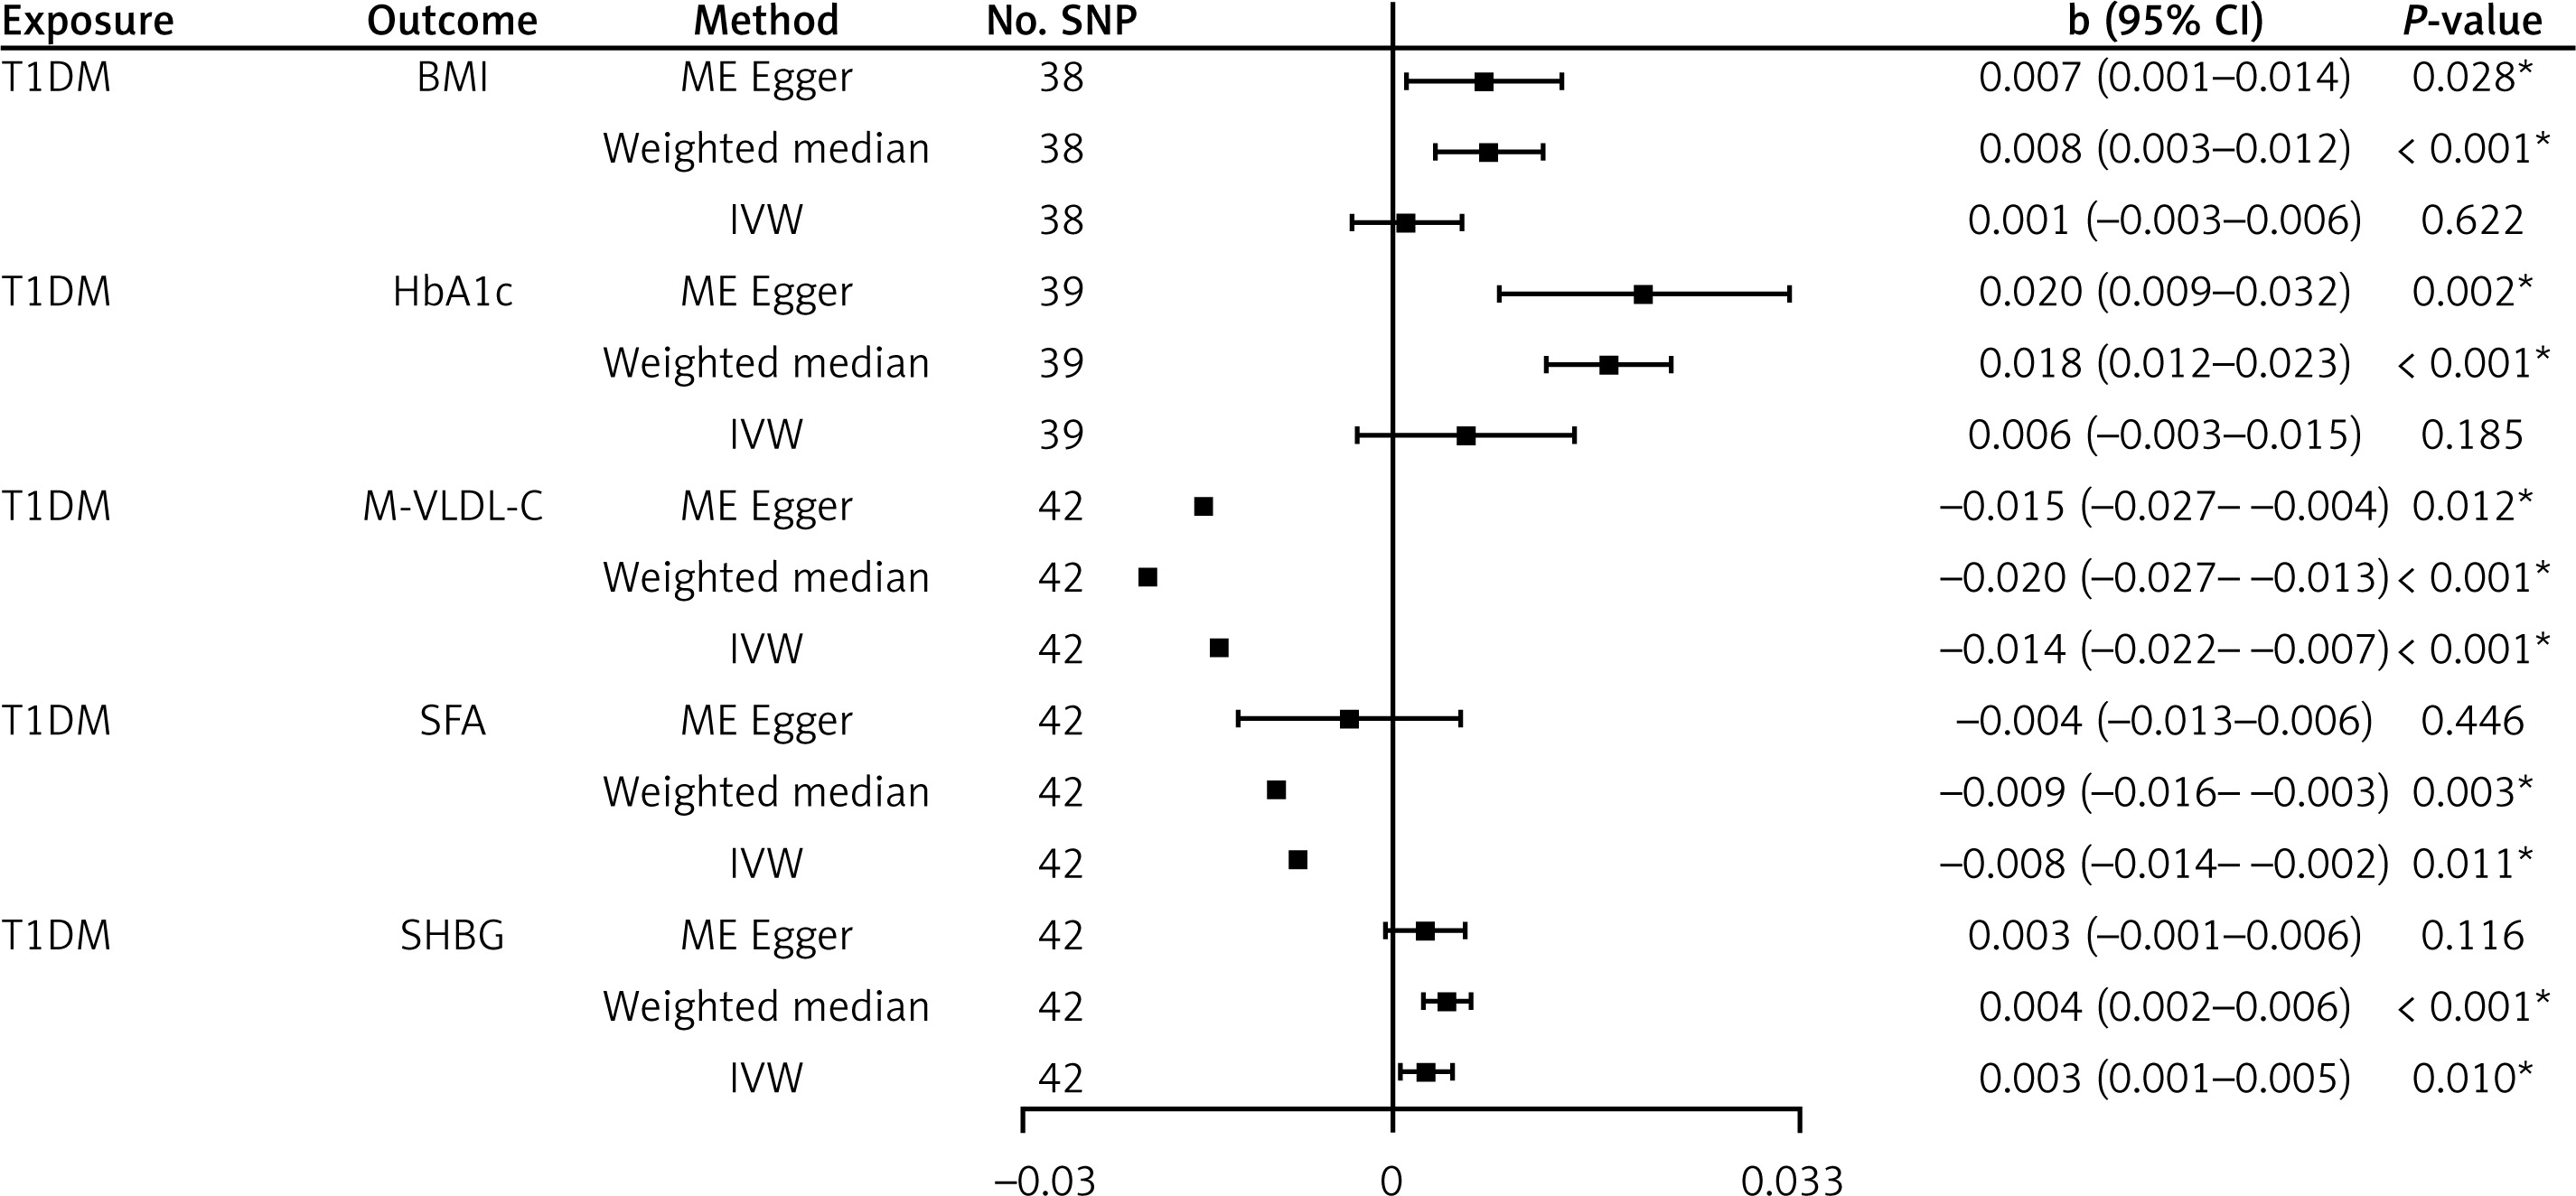
We used two-step MR to identify eligible mediators in the T1DM and osteoporosis causality. In the first step, we estimated the causal effect of T1DM on each candidate mediator by two-sample MR. Given that the outcomes are continuous variables, we provided the correlation coefficient (b), 95% CIs and p-value in the MR results. As for BMI, the IVW analysis yielded a non-significant result (b = 0.001, 95% CI: –0.003 to 0.006, p = 0.622). For HbA1c, the IVW result was also nonsignificant (b = 0.006, 95% CI: –0.003 to 0.015, p = 0.185). Moreover, T1DM showed a significant negative effect on M-VLDL-C (IVW: b = –0.014, 95% CI: –0.022 to –0.007, p < 0.001). MR Egger and weighted median analyses showed consistent results. Regarding SFA, the IVW result showed a significant negative effect (b = –0.008, p = 0.011). In contrast, T1DM was significantly associated with a higher level of SHBG (IVW: b = 0.003, p = 0.010). This result was supported by the weighted median method (Figure 2). In sensitivity analysis, no significant pleiotropy was found for M-VLDL-C, SFA, or SHBG (Supplementary Table SII). The IVW results indicated that T1DM was not significantly associated with BMI or HbA1c (p > 0.05). Thus, we excluded BMI and HbA1c as mediators. T1DM may reduce M-VLDL-C and SFA levels, but increase SHBG levels.
Causal effect of each mediator on outcome
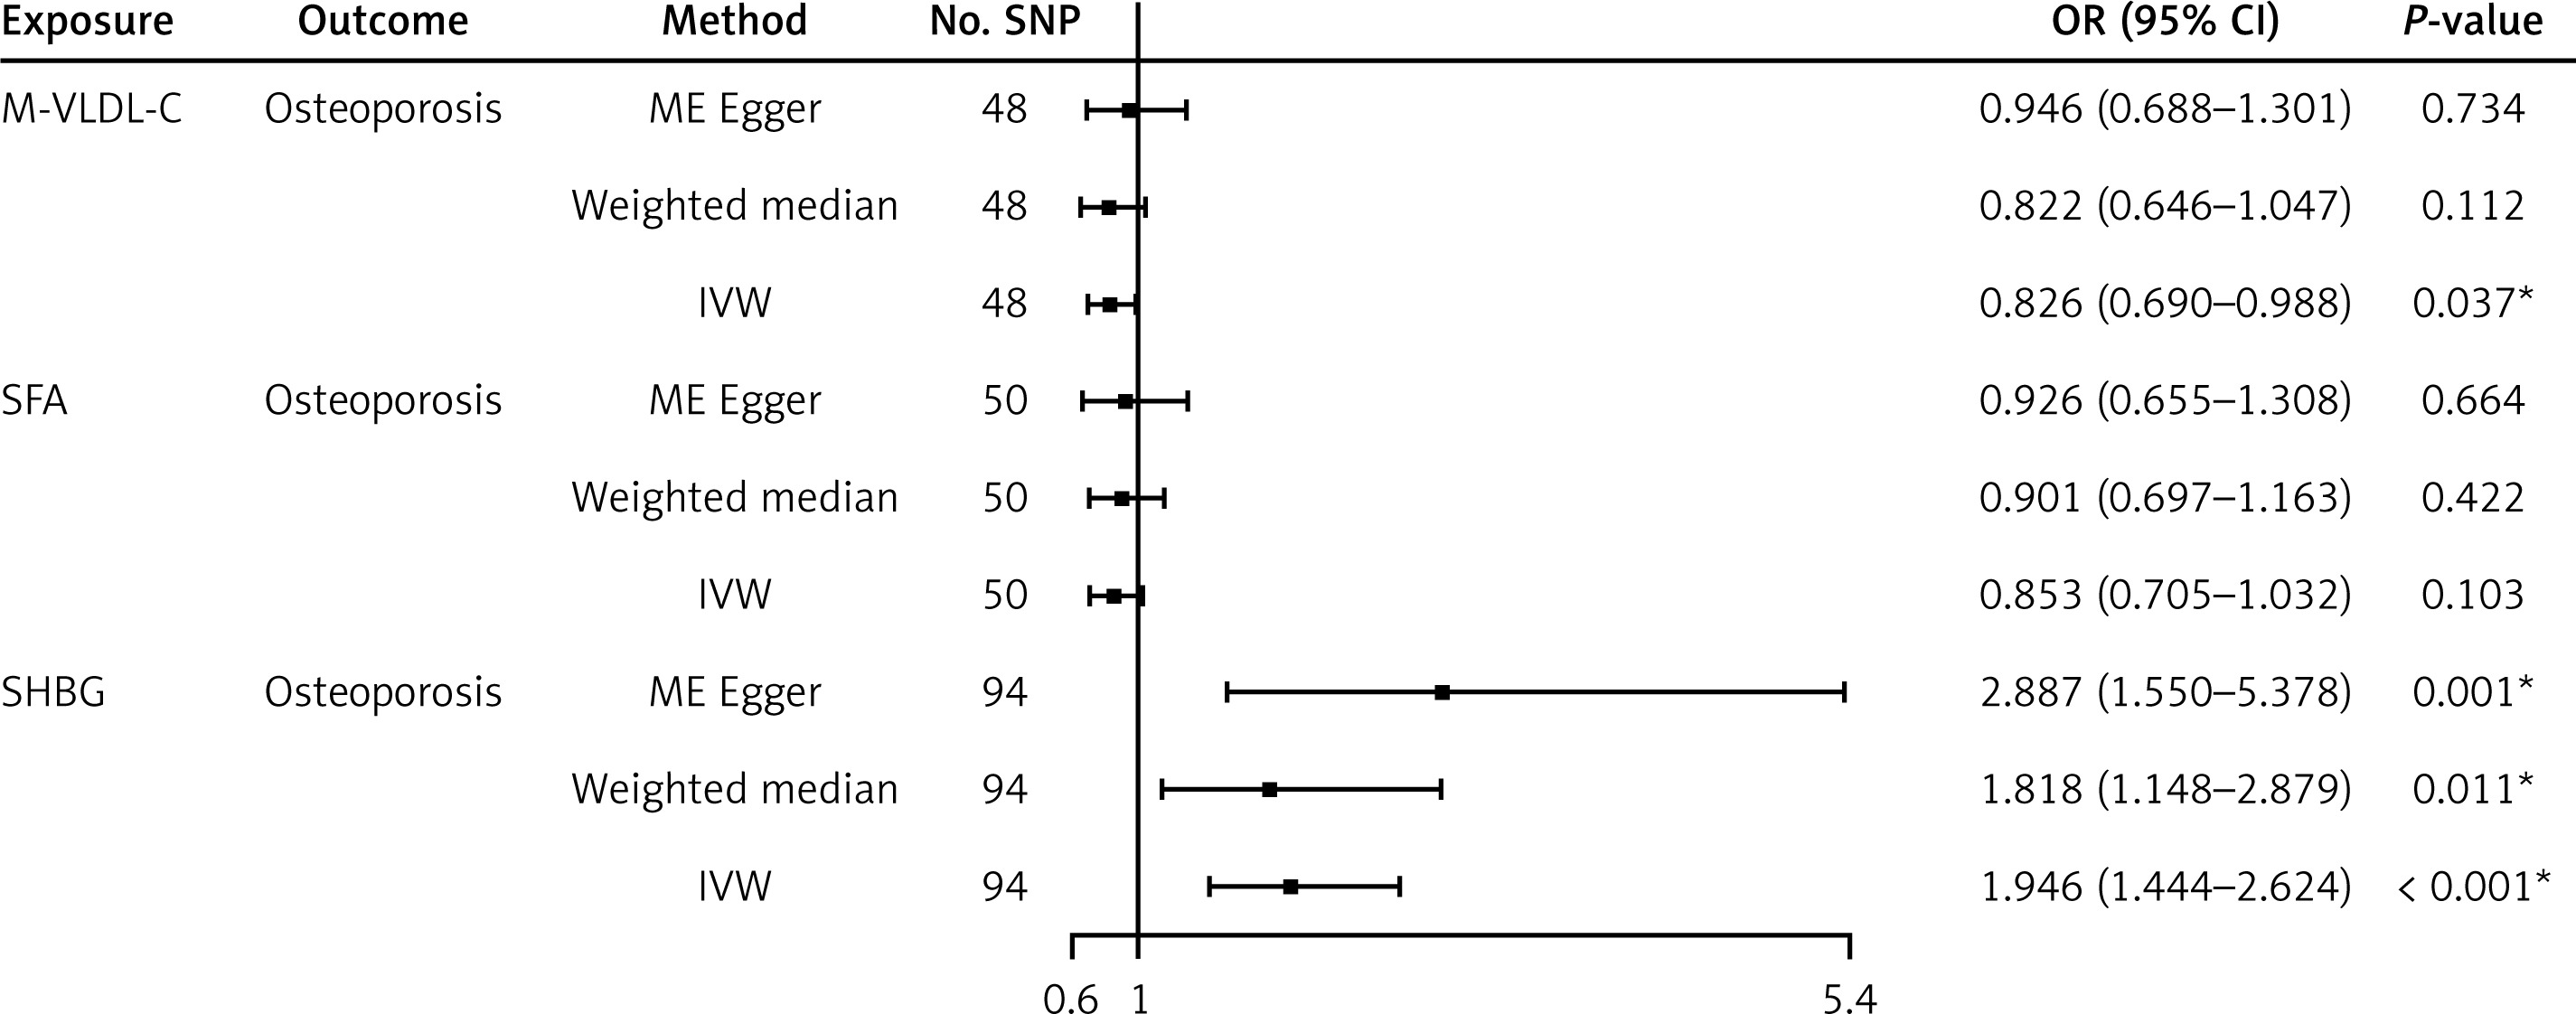
In the second step, we estimated the causal effect of each mediator on osteoporosis by two-sample MR. Concerning the IVW results, M-VLDL-C showed a significant negative effect on osteoporosis (IVW: OR = 0.826, 95% CI: 0.690 to 0.988, p = 0.037). In contrast, SHBG showed a significant positive effect on osteoporosis (IVW: OR = 1.946; 95% CI: 1.444 to 2.624; p < 0.001). As for SFA, no significant association was found in any MR method (Figure 3). Sensitivity analysis revealed no significant heterogeneity or pleiotropy (all p > 0.05, Supplementary Table SIII). All these results indicate that lower M-VLDL-C and higher SHBG levels may increase the risk of osteoporosis, whereas SFA was excluded due to its lack of a significant causal relationship with osteoporosis.
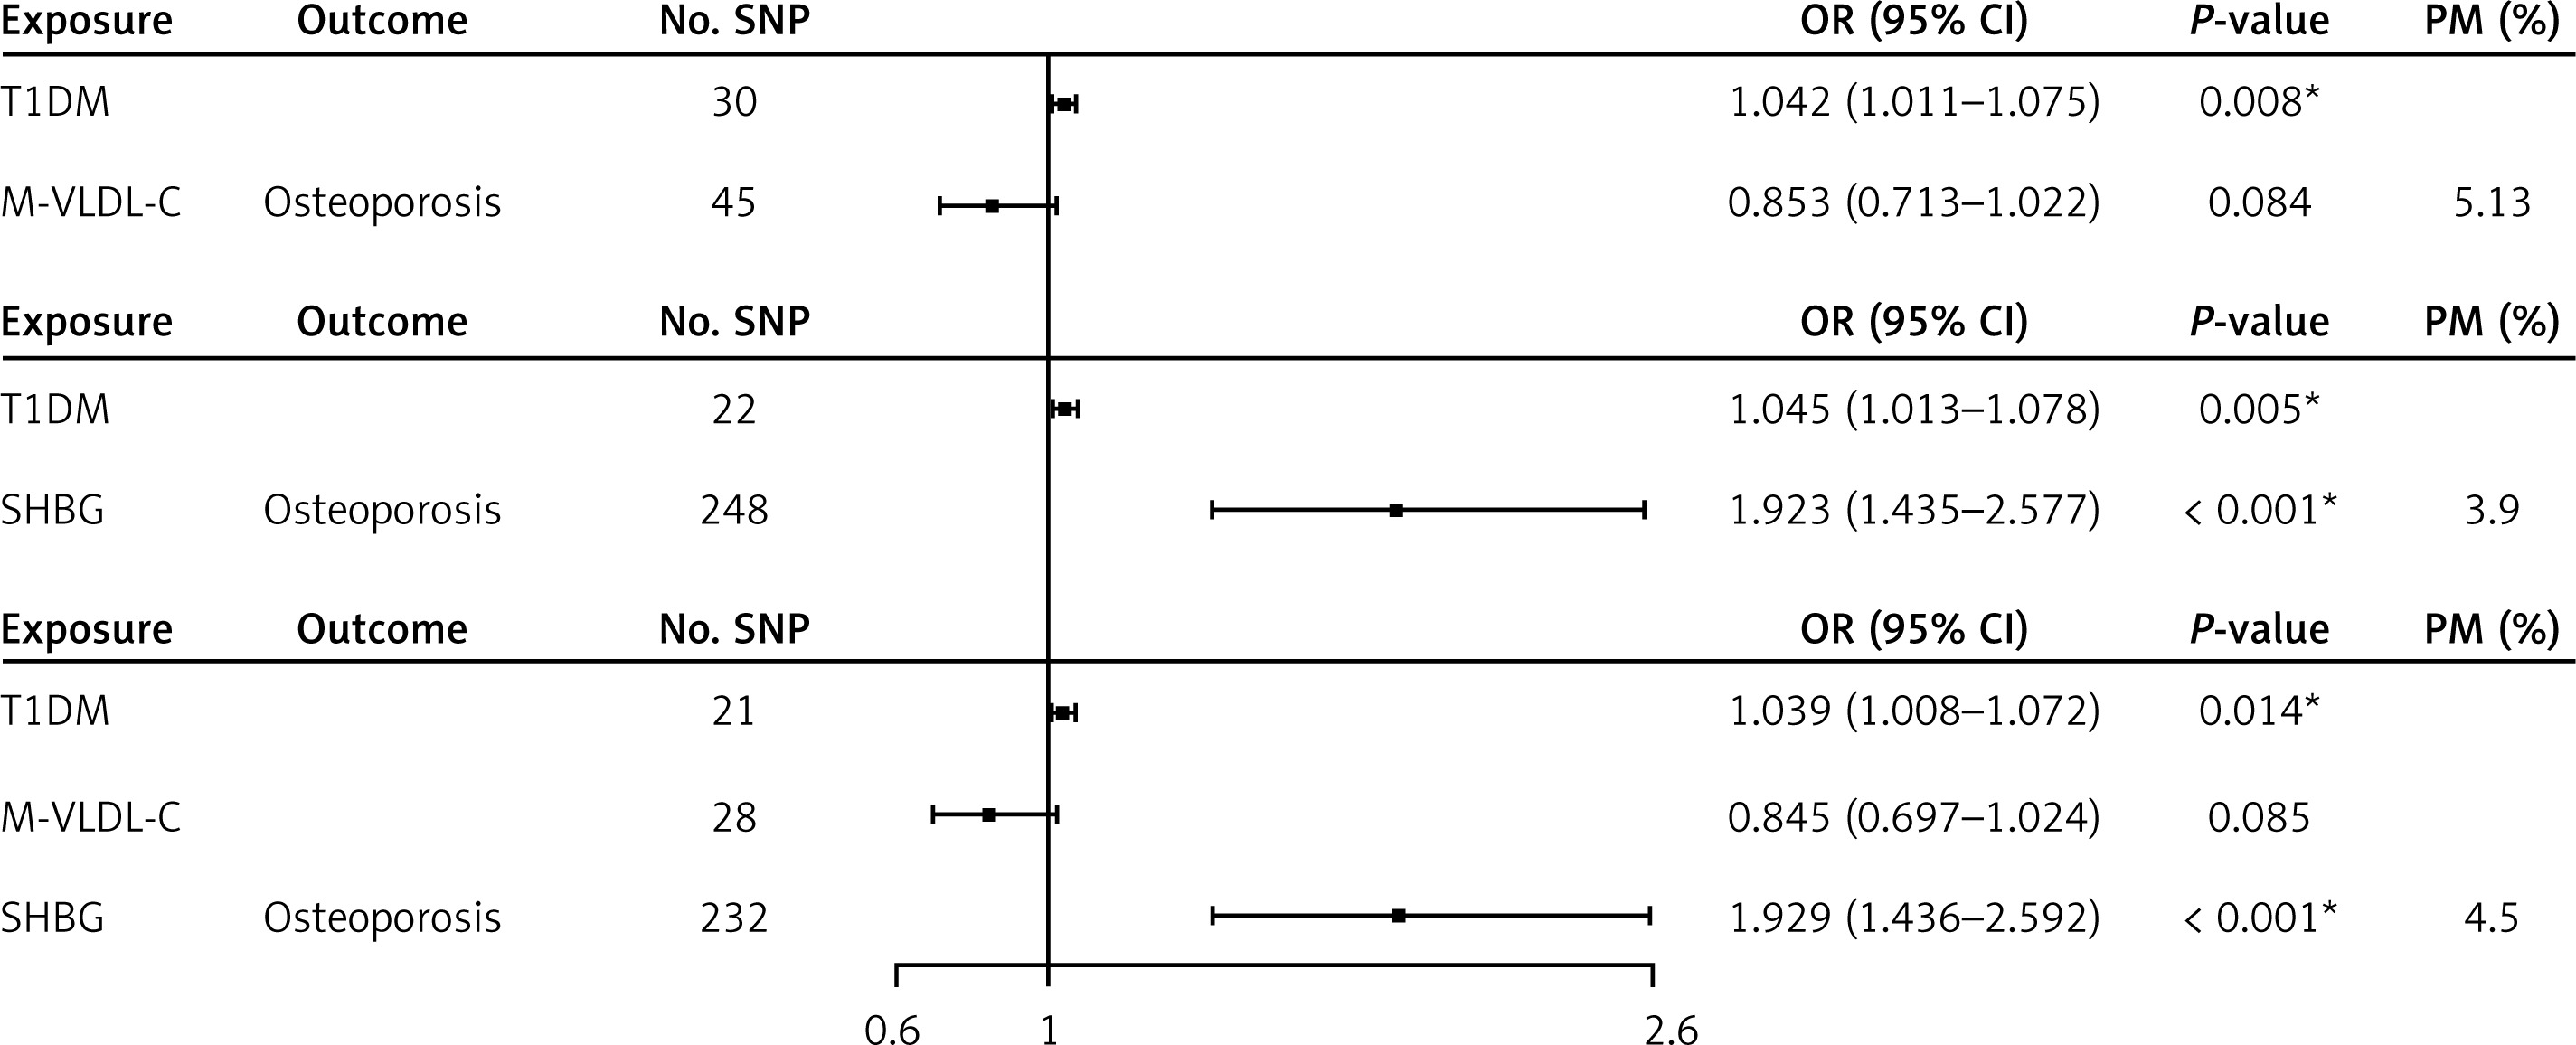
Mediation effect analysis
We assessed the mediating effects of M-VLDL-C and SHBG on the causal relationship between T1DM and osteoporosis by MVMR analysis. In the first model, after adjusting for M-VLDL-C, T1DM was significantly associated with a higher risk of osteoporosis (OR = 1.042, 95% CI: 1.011 to 1.075, p = 0.008). It mediated 5.13% of the total T1DM-osteoporosis causal effect. In the second model, after adjusting for SHBG, T1DM was still significantly associated with an increased risk of osteoporosis (OR = 1.045, 95% CI: 1.013 to 1.078, p = 0.005). Higher SHBG was consistently associated with an increased risk of osteoporosis (OR = 1.923, 95% CI: 1.435 to 2.577, p < 0.001), and it mediated 3.9% of the total effect. In the third model, after adjusting for two mediators, T1DM remained significantly associated with an elevated risk of osteoporosis (OR = 1.039, 95% CI: 1.008 to 1.072, p = 0.014). Combined M-VLDL-C and SHBG mediated 4.5% of the total effect (Figure 4). mRnd revealed a power of 0.89 for detecting the mediation effect of M-VLDL-C and 0.91 for SHBG. Hence, T1DM was consistently associated with an increased risk of osteoporosis across all three models, even when considering the mediating effects of M-VLDL-C and SHBG.
UK Biobank prospective cohort study
Among the 102,360 participants from UKB, only 957 (0.94%) had T1DM, while the rest of 101,403 non-T1DM participants (99.07%) served as a reference. Compared to the non-T1DM group, T1DM participants were more likely to be male (58.1% vs. 46.2%) and older (mean age 58.3 vs. 56.5 years). They also had a lower socioeconomic status, with fewer attaining college-level education (25.4% vs. 32.3%) and a higher proportion reporting an annual income < £18,000 (46.5% vs. 33.8%, all p < 0.001). In terms of health-related factors, T1DM participants had higher BMI (30.3 vs. 27.4 kg/m2), larger waist circumference (99.9 vs. 90.3 cm), and greater hip circumference (107.4 vs. 103.3 cm). They were more likely to be current smokers (13.0% vs. 10.6%) and less likely to consume alcohol (81.5% vs. 92.0%). Notably, T1DM participants exhibited significantly higher HbA1c levels (58.4 vs. 35.9 mmol/mol, p < 0.001), lower M-VLDL-C levels (0.1 vs. 0.2 mmol/l, p < 0.001), and lower SHBG levels (49.2 vs. 51.6 nmol/l, p = 0.01). Additionally, T1DM participants reported a higher prevalence of fractures (11.9% vs. 9.3%, p = 0.005) and falls (14.4% vs. 6.5% for > 1 fall, p < 0.001) (Table I). These results indicate the distinct demographic and health profiles of participants in the UKB cohort.
Table I
Baseline characteristics of participants in the UK Biobank cohort (n = 102,360)
[i] Note: Data are presented as mean (SD) for continuous variables (age, BMI, waist circumference, hip circumference, fresh fruit intake, vitamin D, HbA1c, M-VLDL-C, and SHBG), and as count (percentage), n (%) for categorical variables (sex, education, income, smoking status, alcohol status, fractures, and falls). BMI – body mass index, Waist – waist circumference, Hip – hip circumference, Fruit – fresh fruit intake, M-VLDL-C – cholesterol in medium very low-density lipoprotein particles, SHBG – sex hormone-binding globulin, Fractures – fractures in 5 years, Falls – falls in the last year.
We further explored the correlation of T1DM and eligible mediators with the risk of osteoporosis in the UKB cohort study, using multivariable Cox proportional hazards models. In Model 1, adjusted for sex and age, T1DM was significantly associated with an increased risk of osteoporosis (HR = 2.155, 95% CI: 1.711 to 2.715, p < 0.001). This association remained significant after further adjustment for socioeconomic and lifestyle factors in Model 2 (HR = 2.135, 95% CI: 1.622 to 2.811, p < 0.001) and additional adjustment for health status indicators in Model 3 (HR = 1.997, 95% CI: 1.504 to 2.650, p < 0.001). For the mediators, a higher level of M-VLDL-C was consistently associated with a lower risk of osteoporosis across all models (Model 1: HR = 0.357, 95% CI: 0.220 to 0.581; Model 2: HR = 0.354, 95% CI: 0.214 to 0.585; Model 3: HR = 0.342, 95% CI: 0.192 to 0.610, all p < 0.001). Conversely, a higher level of SHBG was associated with an increased risk of osteoporosis (Model 1: HR = 1.007, 95% CI: 1.006 to 1.008; Model 2: HR = 1.006, 95% CI: 1.005 to 1.007; Model 3: HR = 1.005, 95% CI: 1.004 to 1.006, all p < 0.001) (Table II). These results suggest that T1DM, M-VLDL-C, and SHBG are independently associated with osteoporosis risk, even after adjusting for a wide range of potential confounders. More importantly, these results are consistent with those in mediation MR analysis.
Table II
Correlation of T1DM and mediators with the risk of osteoporosis in the UKB cohort study
| Variable | Model 1 | P-value | Model 2 | P-value | Model 3 | P-value |
|---|---|---|---|---|---|---|
| HR (95% CI) | HR (95% CI) | HR (95% CI) | ||||
| T1DM* | 2.155 (1.711–2.715) | < 0.001 | 2.135 (1.622–2.811) | < 0.001 | 1.997 (1.504–2.650) | < 0.001 |
| M-VLDL-C | 0.357 (0.220–0.581) | < 0.001 | 0.354 (0.214–0.585) | < 0.001 | 0.342 (0.192–0.610) | < 0.001 |
| SHBG | 1.007 (1.006–1.008) | < 0.001 | 1.006 (1.005–1.007) | < 0.001 | 1.005 (1.004–1.006) | < 0.001 |
HR – hazard ratio, CI – confidence interval. Multivariable Cox regression models were constructed for adjusting confounders.
* The non-T1DM group was used as a reference. M-VLDL-C and SHBG are continuous variables. Model 1 adjusted for sex and age. Based on Model 1, Model 2 was further adjusted for education, income, BMI, waist circumference, hip circumference, smoking status, and alcohol status. Based on Model 2, Model 3 was additionally adjusted for fresh fruit intake, vitamin D, HbA1c, fractures in 5 years, and falls in the last year.
Discussion
In this study, we investigated the causal relationship between T1DM and osteoporosis, and identified mediators in this relationship by mediation MR. It revealed that individuals with T1DM have an increased risk of osteoporosis. M-VLDL-C and SHBG are identified as significant mediators in the T1DM-osteoporosis causal association. These mediators extend beyond conventional risk factors, offering a deeper understanding of the metabolic intricacies influencing bone health in individuals with T1DM. Furthermore, validation of our MR findings in the UKB cohort study adds a layer of real-world relevance, enhancing the reliability of our results.
Osteoporosis is a prevalent co-morbidity of T1DM affecting fracture risk [16]. We observed a positive causal effect of T1DM on osteoporosis. This result is consistent with a recent publication that reported an elevated risk of osteoporosis and fracture in individuals with T1DM [17]. In T1DM, defective glucose metabolism in osteoblasts drove diabetic osteoporosis [18]. Another study also revealed the adverse impact of diabetes on BMD and bone quality [19]. The alignment of our results with existing literature underscores T1DM as a significant risk factor for osteoporosis. Compared with these previous reports, the application of MR in our study is methodologically rigorous, minimizing confounding bias and offering a more reliable causal inference. In exploring the implications of this causal association, we examine potential mechanisms and consider the broader clinical significance of our findings in the context of bone health in individuals with T1DM.
While prior research has established a positive association between T1DM and osteoporosis, the specific mediators underlying this relationship remain poorly understood. Our study identified M-VLDL-C and SHBG as significant mediators in this relationship and quantified their mediating effects. SFA was excluded due to its insignificant association with osteoporosis. Decreasing M-VLDL-C levels may lead to an elevated risk of osteoporosis. T1DM is often accompanied by dyslipidemia, which may impair lipid metabolism and reduce M-VLDL-C levels, thereby affecting bone cell function and energy supply [20]. M-VLDL-C is involved in cell membrane composition and signaling pathways essential for osteoblast and osteoclast function [21]. Reduced levels of M-VLDL-C may impair bone remodeling by disrupting these processes. Moreover, hormonal dysregulation in T1DM, such as abnormal secretion of glucagon and growth hormone, may indirectly influence M-VLDL-C metabolism and bone remodeling [22]. The positive association between SHBG and osteoporosis identified in our study is compelling, and can be explained through several biological mechanisms. First, higher SHBG levels may reduce the bioavailability of free sex hormones, impairing BMD and bone strength [23]. Lower levels of bioactive testosterone and estradiol could reduce bone formation and increase bone resorption, contributing to osteoporosis [24]. Second, SHBG may directly interact with bone cells, as SHBG receptors have been identified on osteoblasts and osteoclasts, suggesting a potential role in modulating bone remodeling [25]. Third, SHBG has been shown to modulate inflammatory processes and oxidative stress, both of which play a role in bone metabolism [26]. Chronic inflammation and oxidative stress increased bone resorption and reduced bone formation, further exacerbating osteoporosis [27]. These mechanisms highlight the multifaceted role of SHBG in bone health and osteoporosis.
Although the mediation effects of M-VLDL-C and SHBG may appear relatively small, they are biologically plausible and clinically relevant. Identification of these mediators provides an actionable insight for the targeted intervention. For example, modulating lipid profiles through dietary changes or drugs, or regulating SHBG levels through hormonal therapies, may reduce osteoporosis risk in T1DM patients. The validation of our MR findings by the UKB prospective cohort study bolsters the external validity and real-world relevance of our study. Our multivariable Cox proportional hazards models consistently reflected the significant association between T1DM and increased risk of osteoporosis. Notably, the associations between eligible mediators and osteoporosis risk remained significant after accounting for various confounders, highlighting the robustness of our results. These findings underscore the importance of early detection and proactive management of metabolic disturbances in T1DM patients to prevent long-term complications such as osteoporosis.
Some limitations should be mentioned. First, the results of MR analyses are subject to certain assumptions, such as the validity of genetic instruments and the absence of pleiotropic effects [28]. Although we addressed these issues by sensitivity analyses, the possibility of cryptic confounding or bias cannot be completely excluded. Second, the mediation effects of M-VLDL-C and SHBG are relatively small, suggesting that other unmeasured factors may also play important roles in the T1DM-osteoporosis causal relationship. Third, this study was limited to European populations, which may limit the generalizability of our findings to other ethnic groups. The prevalence and risk factors for both T1DM and osteoporosis can vary significantly across populations. Differences in dietary habits, lifestyle factors, and genetic predispositions may influence the mediating effects of M-VLDL-C and SHBG in non-European populations. Moreover, the interactions among metabolic processes in body composition could vary due to ethnic differences. Therefore, our results should be interpreted with caution, and should be verified by future experimental and clinical work.
Our findings have important implications for future interventions and research directions. The identification of M-VLDL-C and SHBG as eligible mediators in the T1DM-osteoporosis causal association implies that targeting lipid metabolism and hormonal regulation could be effective strategies for preventing bone loss in the high-risk population. Monitoring these mediators in T1DM patients may help identify individuals at high risk of osteoporosis, enabling early intervention and tailored treatment plans. Future research should focus on validating these findings in diverse populations to ensure broader applicability.
In conclusion, this study revealed a causal relationship between T1DM and a higher risk of osteoporosis, mediated in part by reduction in M-VLDL-C and elevation in SHBG levels. Our findings highlight T1DM as a risk factor for osteoporosis. The identified mediators hold potential as biomarkers for early detection and as therapeutic targets to reduce osteoporosis risk in patients with T1DM. Interventions for restoring lipid metabolism and optimizing SHBG levels may improve the overall bone health in individuals with T1DM.