Introduction
Prostate cancer (PCa) poses a significant and growing threat to men’s health globally, with its prevalence notably increasing among aging demographics [1]. Although diagnostic and therapeutic strategies have advanced, a substantial proportion of patients still progress to advanced disease stages [2–4]. For these cases, androgen deprivation therapy (ADT) continues to serve as the foundational therapeutic strategy. Despite its established efficacy in initial disease control [5–8], the emergence of treatment resistance is nearly universal, ultimately driving disease progression to the lethal castration-resistant PCa (CRPC) stage [9–12]. Like most cancers, PCa is understood as a multifactorial disease involving genetic, epigenetic, and molecular signaling abnormalities [4, 13–17]. However, the precise molecular mechanisms underlying this disease remain unclear. Consequently, deciphering the key molecular entities that orchestrate PCa initiation and progression is critically important, as it will identify novel therapeutic targets to counteract treatment resistance and enhance clinical outcomes.
The NBPF1 gene is part of the Neuroblastoma Breakpoint Family (NBPF), and its link to cancer was established early on by the identification of a constitutional translocation involving NBPF1 in a neuroblastoma case. Beyond this oncogenic context, NBPF1 protein function is implicated in neural development and has associations with certain developmental disorders [18, 19]. High-throughput omics technologies have revolutionized the discovery of genes with previously unknown tumor suppressor function. A pan-cancer analysis of chr1p36-deleted regions, a genomic desert that is recurrently lost in aggressive malignancies, prioritized NBPF1 as a candidate tumor suppressor [20]. Accumulating studies have established a tumor-suppressive role for NBPF1, which curbs neoplastic cell proliferation, growth, and cell cycle advancement by specifically inhibiting the phosphatidylinositol 3-kinase (PI3K)/protein kinase B (AKT) signaling cascade [21–23]. Furthermore, its downregulation is consistently associated with unfavorable prognosis, underscoring the clinical relevance of NBPF1 as a prognostic biomarker [24, 25]. Nonetheless, the functional significance of NBPF1 in PCa and the mechanistic basis for its actions are still not fully defined. To address this gap, our study builds upon prior work to delineate the molecular mechanism of NBPF1 in PCa pathogenesis and evaluate its feasibility as a therapeutic target.
To achieve these objectives, we comprehensively evaluated the expression profile and clinical significance of NBPF1 in PCa by integrating bioinformatics with experimental validation. Through a combination of gain- and loss-of-function approaches, transcriptome sequencing, and downstream pathway analyses, we elucidated the central involvement of NBPF1 in inhibiting the PI3K/AKT pathway to thereby impede PCa progression. Collectively, this work aims to clarify the potential mechanisms by which NBPF1 can influence PCa development, underscoring its functional significance and providing a foundational rationale for developing novel targeted therapies.
Material and methods
Patient specimens and clinical data
A PCa tissue microarray (TMA) was purchased from Wellbio Biotech (Shanghai, China), which included specimens from 77 PCa patients and 73 normal prostate tissues. Clinical and pathological data provided by the supplier included patient age, TNM stage, Gleason score, Ki-67 staining intensity, and androgen receptor (AR) expression status. All patient data were anonymized, and the study protocol received approval from the institutional ethics committee (Approval No. LLS M-15-01).
Cell culture and transfection
The human immortalized prostate epithelial cell line RWPE-1, along with a panel of PCa cell lines (LNCaP, 22RV1, PC3, and DU145), was obtained from the Cell Bank of the Chinese Academy of Sciences (Shanghai, China). These PCa cell lines were propagated in RPMI-1640 medium, supplemented with 10% fetal bovine serum (FBS; Gibco, Thermo Fisher Scientific, Waltham, MA, USA), while the RWPE-1 cells were grown in Keratinocyte Serum-Free Medium (KSFM; Gibco). All cultures were kept at 37°C in a humidified environment with a 5% CO2 atmosphere.
Gene modulation of NBPF1 expression was achieved through lentiviral vectors. Knockdown was performed using specific short hairpin RNAs (shRNAs) against NBPF1, which were commercially sourced from Tsingke Biotech (Guangzhou, China). Conversely, for overexpression, the NBPF1 coding sequence was cloned into the pcSLenti-CMV-MCS-3xFLAG-Puro-WPRE lentiviral construct, purchased from Obio Technology (Shanghai, China). All relevant oligonucleotide sequences are detailed in Supplementary Table SI.
RNA extraction, reverse transcription, and quantitative real-time PCR (qRT-PCR)
Total RNA was isolated from cultured cells with an RNA Purification Kit (EZBioscience, Roseville, MN, USA). RNA quantity and quality were verified with a Nanodrop 2000 spectrophotometer (Thermo Fisher Scientific). Immediately afterward, the reverse-transcribed products were generated from equal amounts of RNA using the All-in-one RT Kit (Vazyme, Nanjing, China). Quantitative RT-PCR reactions were subsequently set up employing the ChamQ SYBR qPCR Master Mix Kit (Vazyme) on a QuantStudio 5 PCR System (Thermo Fisher Scientific), running under the recommended thermal regimen and concluding with melt-curve evaluation. For quantification, NBPF1 transcript levels were normalized against the GAPDH endogenous control; thereafter, fold-change values were calculated using the comparative 2–ΔΔCT approach. All primer sequences utilized are provided in Supplementary Table SI.
Western blot analysis
Cellular proteins were harvested by incubating cells on ice for 30 min with RIPA lysis buffer (Beyotime, Shanghai, China), with added protease and phosphatase inhibitors (Beyotime). After centrifugation, the resulting supernatants were collected for concentration measurement using the Enhanced BCA Protein Assay Kit (Beyotime). Equivalent protein quantities for each lane were first resolved on an SDS–polyacrylamide gel (SDS-PAGE) and then electro-transferred onto polyvinylidene fluoride (PVDF) membranes (Millipore, Burlington, MA, USA). The PVDF supports were subjected to a blocking step with 5% skim milk or bovine serum albumin (BSA) solution, followed by an overnight incubation with primary antibodies at 4°C. Following wash steps, the blots were then allowed to bind horseradish peroxidase (HRP)-tagged secondary antibodies during a 1-hour incubation set at 22–25°C. Immunoreactive bands were detected using an enhanced chemiluminescence (ECL) kit (UElandy, Suzhou, China), and all antibodies employed are cataloged in Supplementary Table SII.
Cell proliferation, colony formation, and 5-ethynyl-2’-deoxyuridine (EdU) incorporation assays
Cell proliferation was evaluated through three complementary approaches. In the CCK-8 assay, 1,000 cells/well were seeded in 96-well plates, treated as indicated, and incubated with CCK-8 reagent (Beyotime). Optical density at 450 nm was scanned every 24 h for 5 days using a Varioskan LUX platform (Thermo Fisher Scientific). In the colony formation assay, 1,000 cells/well were plated in 6-well plates and allowed to grow for 10–14 days. The resulting colonies were fixed with 4% paraformaldehyde (PFA; Leagene, Beijing, China), stained with 0.1% crystal violet (Beyotime), and quantified using ImageJ software. The EdU labeling step was executed using the commercially available Cell Proliferation Kit (Beyotime). After 2-hour EdU labeling, cells were fixed, permeabilized, and immunostained using the protocol enclosed with the kit. Cells that incorporated EdU were imaged with a Nikon fluorescence system (Tokyo, Japan) and quantified using the DAPI-stained nuclei, which were used to label all cell nuclei for accurate determination of the proliferation rate.
Cell migration and invasion assays
During the wound-healing assay, a defined scratch was introduced into confluent layers using a sterile pipette tip, and serial images of the resulting defect were acquired at time zero and following full-day incubation. Transwell migration assay began by plating 5 × 10⁴ serum-starved cells into 6.5 mm, 8 µm Corning inserts (Corning, NY, USA), and a 20% FBS-containing medium was positioned below to act as an attractant. After 24–48 h, movers on the underside were first treated with 4% PFA, then dyed with crystal violet, and finally enumerated in three microscopic fields (200×) chosen at random per filter. The invasion assay followed the same procedures as the migration assay, with the exception that the Transwell membranes were pre-coated with a layer of Matrigel (Corning) to simulate the extracellular matrix (ECM) barrier.
Cell cycle analysis
Cell-cycle phase distribution was evaluated on a flow cytometry using a commercial detection reagent (Keygen, Nanjing, China). Cells cultured in 6-well plates were harvested at 80% confluency, fixed overnight in chilled 70% ethanol at 4°C, and later treated with propidium iodide (PI)/RNase A. The prepared cell samples were subjected to flow cytometric analysis on a CytoFLEX instrument (Beckman Coulter, Brea, CA, USA). The relative proportions of each phase were calculated from the DNA histograms by means of ModFit software (Verity Software House, Topsham, ME, USA).
Subcutaneous xenograft tumor model
All procedures involving animals were performed in compliance with the institution’s ethical guidelines under an approved protocol (Approval No. KY-Z-2022-257-01). A cohort of male BALB/c nude mice, maintained under specific pathogen-free condition, were subcutaneously inoculated with PC3 cells (5 × 10⁶ cells/mouse) stably transduced with either NBPF1-specific shRNA (sh-NBPF1) or a control shRNA (sh-NC). Tumor growth was measured every 5 days by caliper measurement, with volume estimated as (length × width2)/2. At the final time-point (day 28), mice were humanely killed, after which the xenograft masses were dissected for weighing, photographic documentation, and fixation in 4% PFA for subsequent histological analysis.
Immunohistochemistry (IHC)
Mouse tumor tissues underwent fixation in 4% formaldehyde and were left overnight (~24 h) under room-temperature conditions, followed by routine paraffin embedding. Sections from human TMA and mouse tumor paraffin blocks underwent deparaffinization in xylene, graded ethanol rehydration, and antigen retrieval in citrate buffer (pH 6.0, 95°C). Endogenous peroxidases were quenched with 3% H2O2, and blocked for non-specific binding with 5% BSA. Following overnight 4°C incubation with primaries, the sections were exposed to HRP-labelled secondary antibodies for 0.5 h at 22–25°C. Signals were developed using a DAB substrate, followed by hematoxylin counterstaining, dehydration, and mounting. Staining intensity and distribution were quantitatively evaluated using Visiopharm software (Visiopharm, Hørsholm, Denmark), with antibodies detailed in Supplementary Table SII.
Database analysis
Publicly available datasets were interrogated to assess the expression patterns and clinical relevance of NBPF1 in PCa. Integrated analyses incorporated gene expression and clinical data from The Cancer Genome Atlas (TCGA), the Genotype-Tissue Expression (GTEx) project, and the Gene Expression Omnibus (GEO) under accession GSE46602. Somatic mutation profiles were acquired from the cBioPortal platform. Genes differing in expression between the high- and low-NBPF1 expression subsets were extracted and subsequently mapped onto Kyoto Encyclopedia of Genes and Genomes (KEGG) pathways for enrichment assessment.
RNA sequencing (RNA-seq) data analysis
Libraries prepared from NBPF1-knockdown and vector-control PC3 cells were sequenced on an Illumina instrument. Raw reads were first screened with FastQC for quality control metrics, subsequently mapped to GRCh38 (hg38) by means of STAR, and finally quantified as FPKM (fragments per kilobase of transcript per million mapped reads). Differentially expressed genes (DEGs) were pinpointed with DESeq2 and subsequently subjected to functional enrichment analysis via KEGG.
Statistical analysis
Data were expressed as mean ± standard deviation (SD). Inter-group comparisons were examined via Student’s t-test or one-way ANOVA, and survival outcomes were conducted using the Kaplan-Meier method, with significance defined as p < 0.05. Analytical scripts were executed in R 4.3.2, with supplementary routines carried out in GraphPad Prism 10 (GraphPad Software, San Diego, CA, USA).
Results
NBPF1 is downregulated in PCa and correlates with poor prognosis
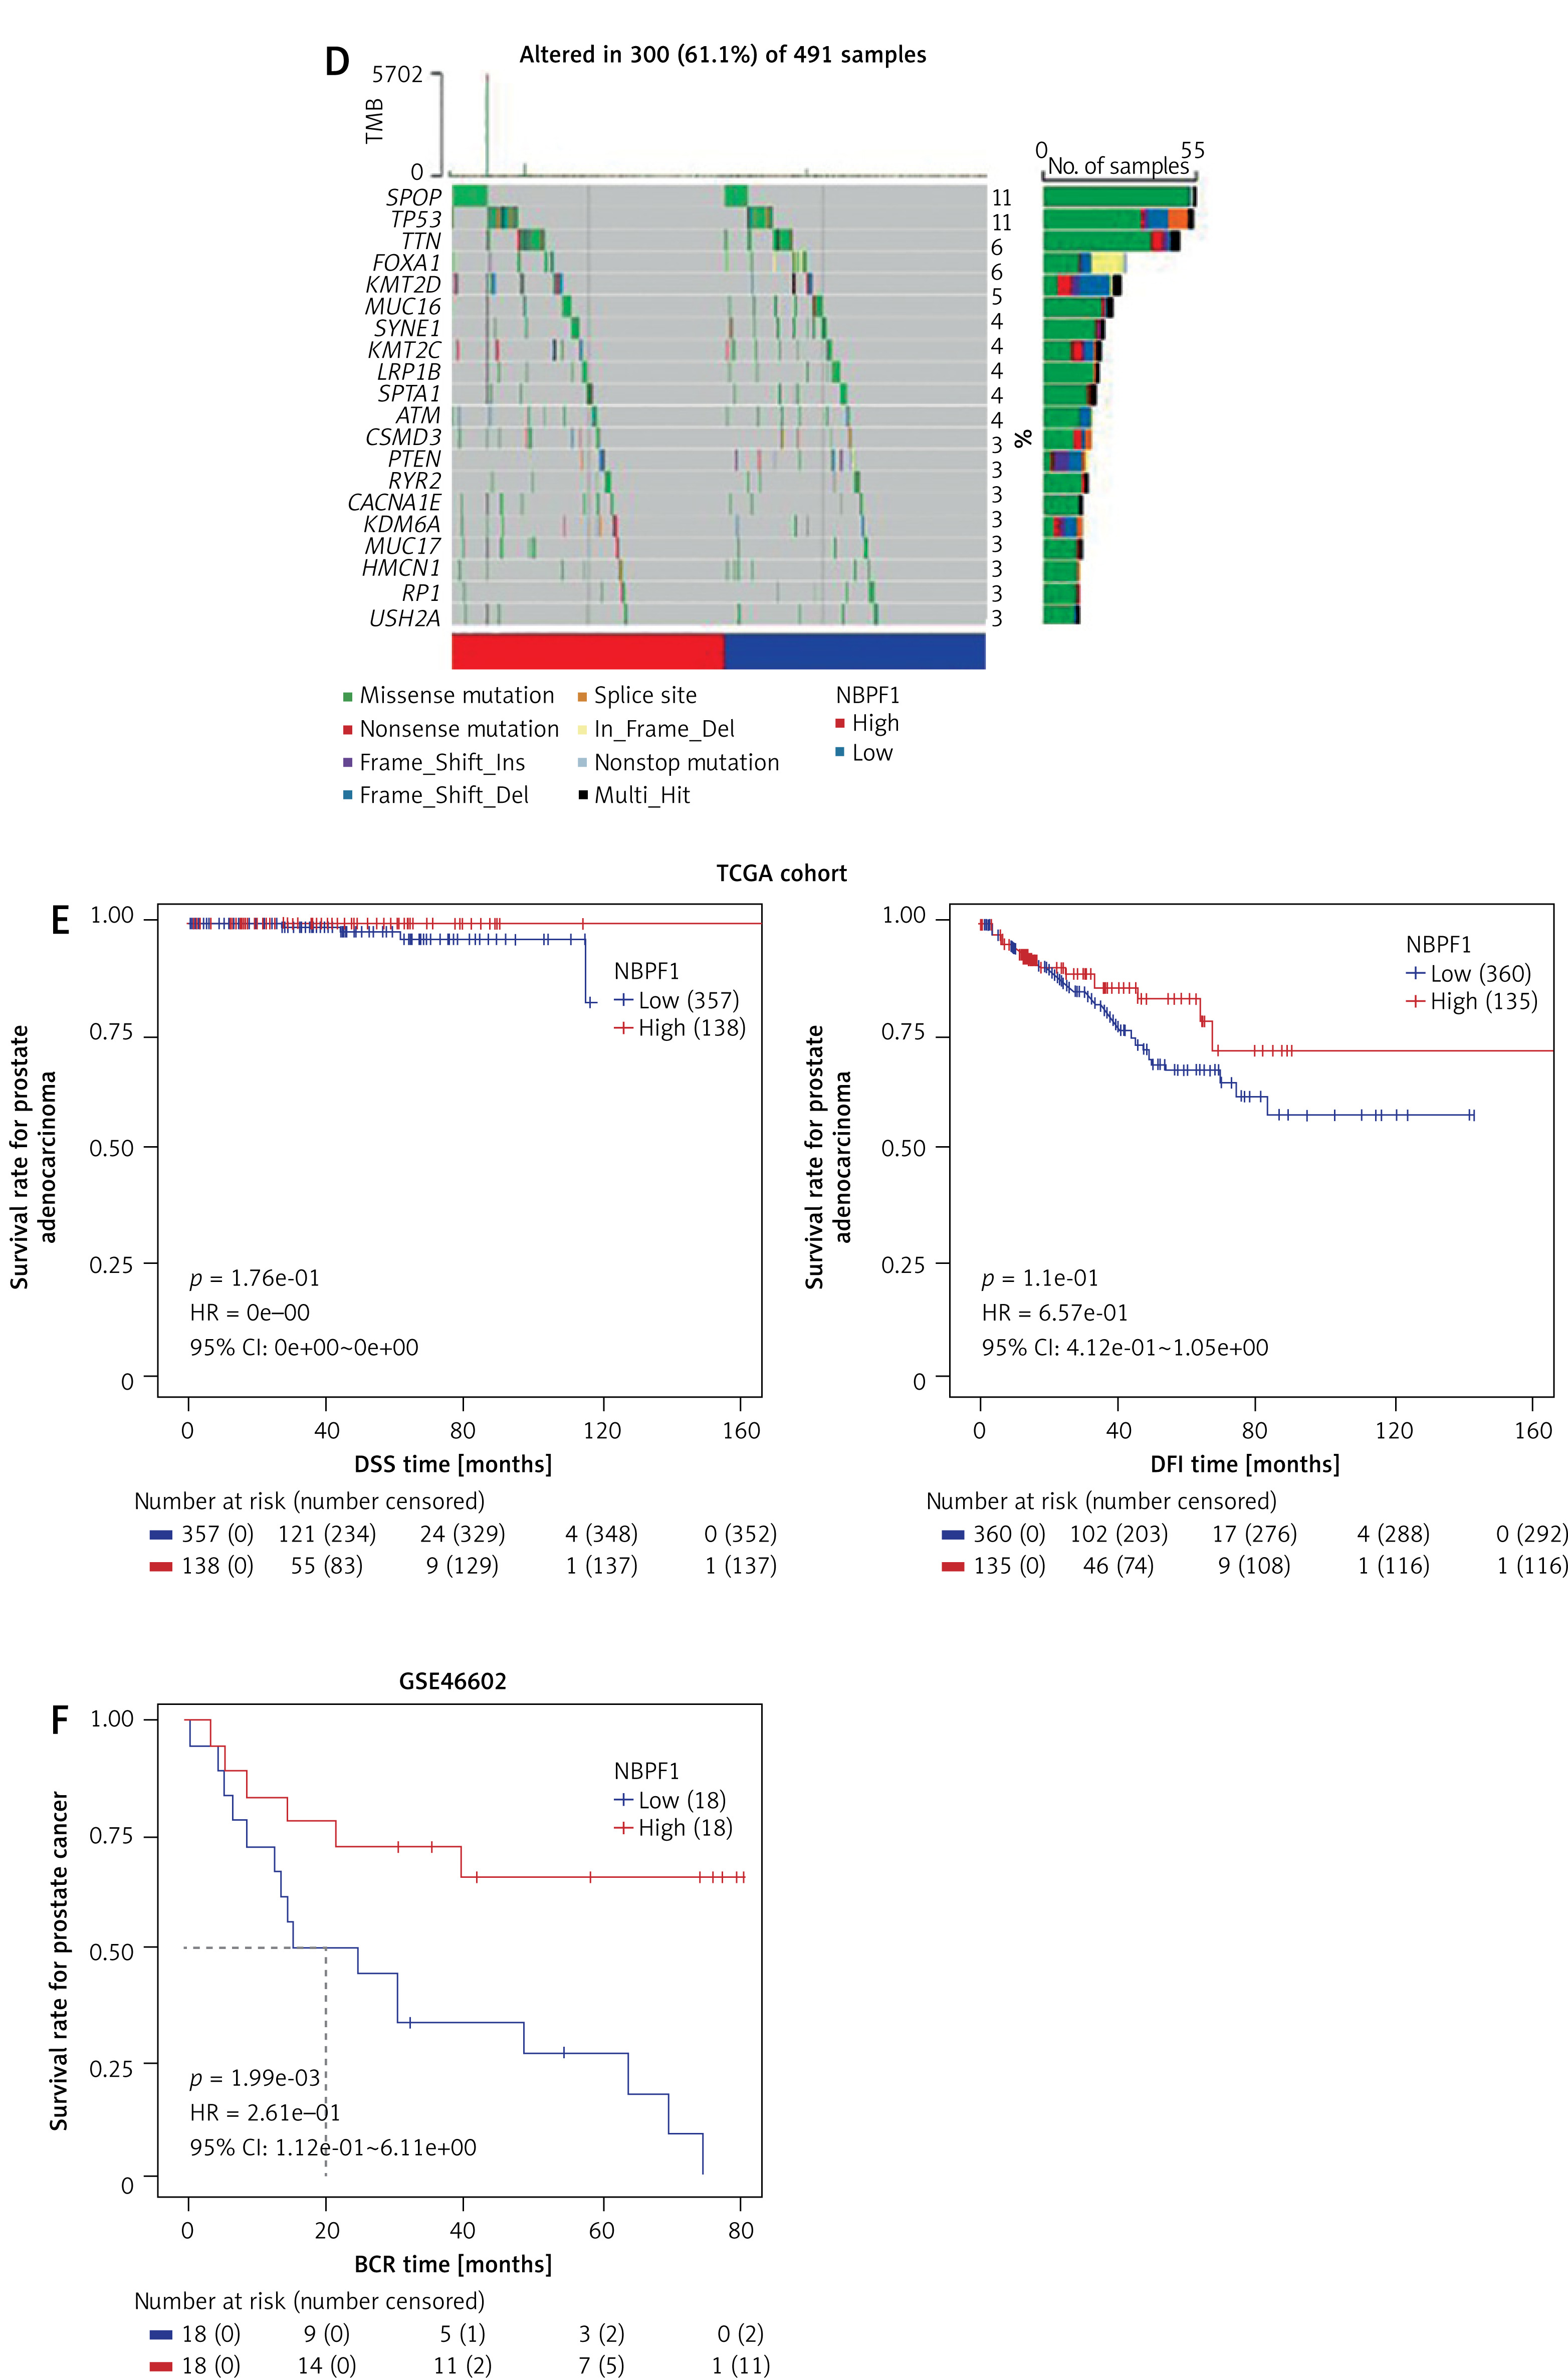
A pan-cancer analysis from the TCGA repository revealed frequent downregulation of NBPF1 mRNA across multiple malignancies relative to adjacent normal tissues (Figure 1 A). This trend was confirmed in PCa through an integrated TCGA/GTEx dataset, which displayed significantly reduced NBPF1 transcript levels in tumors (p < 0.01; Figure 1 B). Additionally, NBPF1 amplification and mutations were frequently observed in PCa (Figure 1 C), with SPOP and TP53 emerging as the most common genetic alterations in both the high- and low-NBPF1 expression groups (Figure 1 D). For potential prognostic significance, Kaplan-Meier analysis identified high NBPF1 expression as a favorable prognostic factor, correlating with prolonged disease-specific survival, disease-free interval, and biochemical recurrence-free survival (Figure 1 E).
Figure 1
NBPF1 is downregulated in PCa and correlates with poor prognosis in public databases. A – Pan-cancer analysis of NBPF1 mRNA levels from TCGA. B – NBPF1 mRNA levels in PCa tissues versus matched non-malignant tissues from TCGA and GTEx. C – Genomic alteration profile of NBPF1 across human cancers from TCGA. D – Top mutated genes in high- versus low-NBPF1 expression groups within the TCGA-PRAD repository. E – Kaplan-Meier analysis depicting disease-specific survival and disease-free interval in the TCGA-PRAD cohort grouped by NBPF1 expression. F – Kaplan-Meier analysis illustrating biochemical recurrence-free survival in the GSE46602 cohort grouped by NBPF1 expression
*P < 0.05; **P < 0.01; ***P < 0.001.
To corroborate these observations at the protein level, NBPF1 IHC staining was performed on PCa TMA slides. Representative NBPF1 IHC images are shown in Figure 2 A. Statistical analysis of the IHC results confirmed significant downregulation of NBPF1 protein in PCa tissues relative to corresponding benign counterparts (p < 0.05) (Figure 2 B). To further assess the clinical implications of NBPF1 downregulation, we stratified PCa samples into high- and low-NBPF1 groups based on the H-score. The pie chart (Figure 2 C) illustrated a pronounced clinical disparity: the low-NBPF1 cohort was enriched with patients exhibiting an advanced T stage, Gleason score greater than 7, and elevated Ki-67 expression. These observations indicate that reduced NBPF1 expression correlates with more aggressive tumor characteristics, increased cell proliferation, and advanced disease progression.
Figure 2
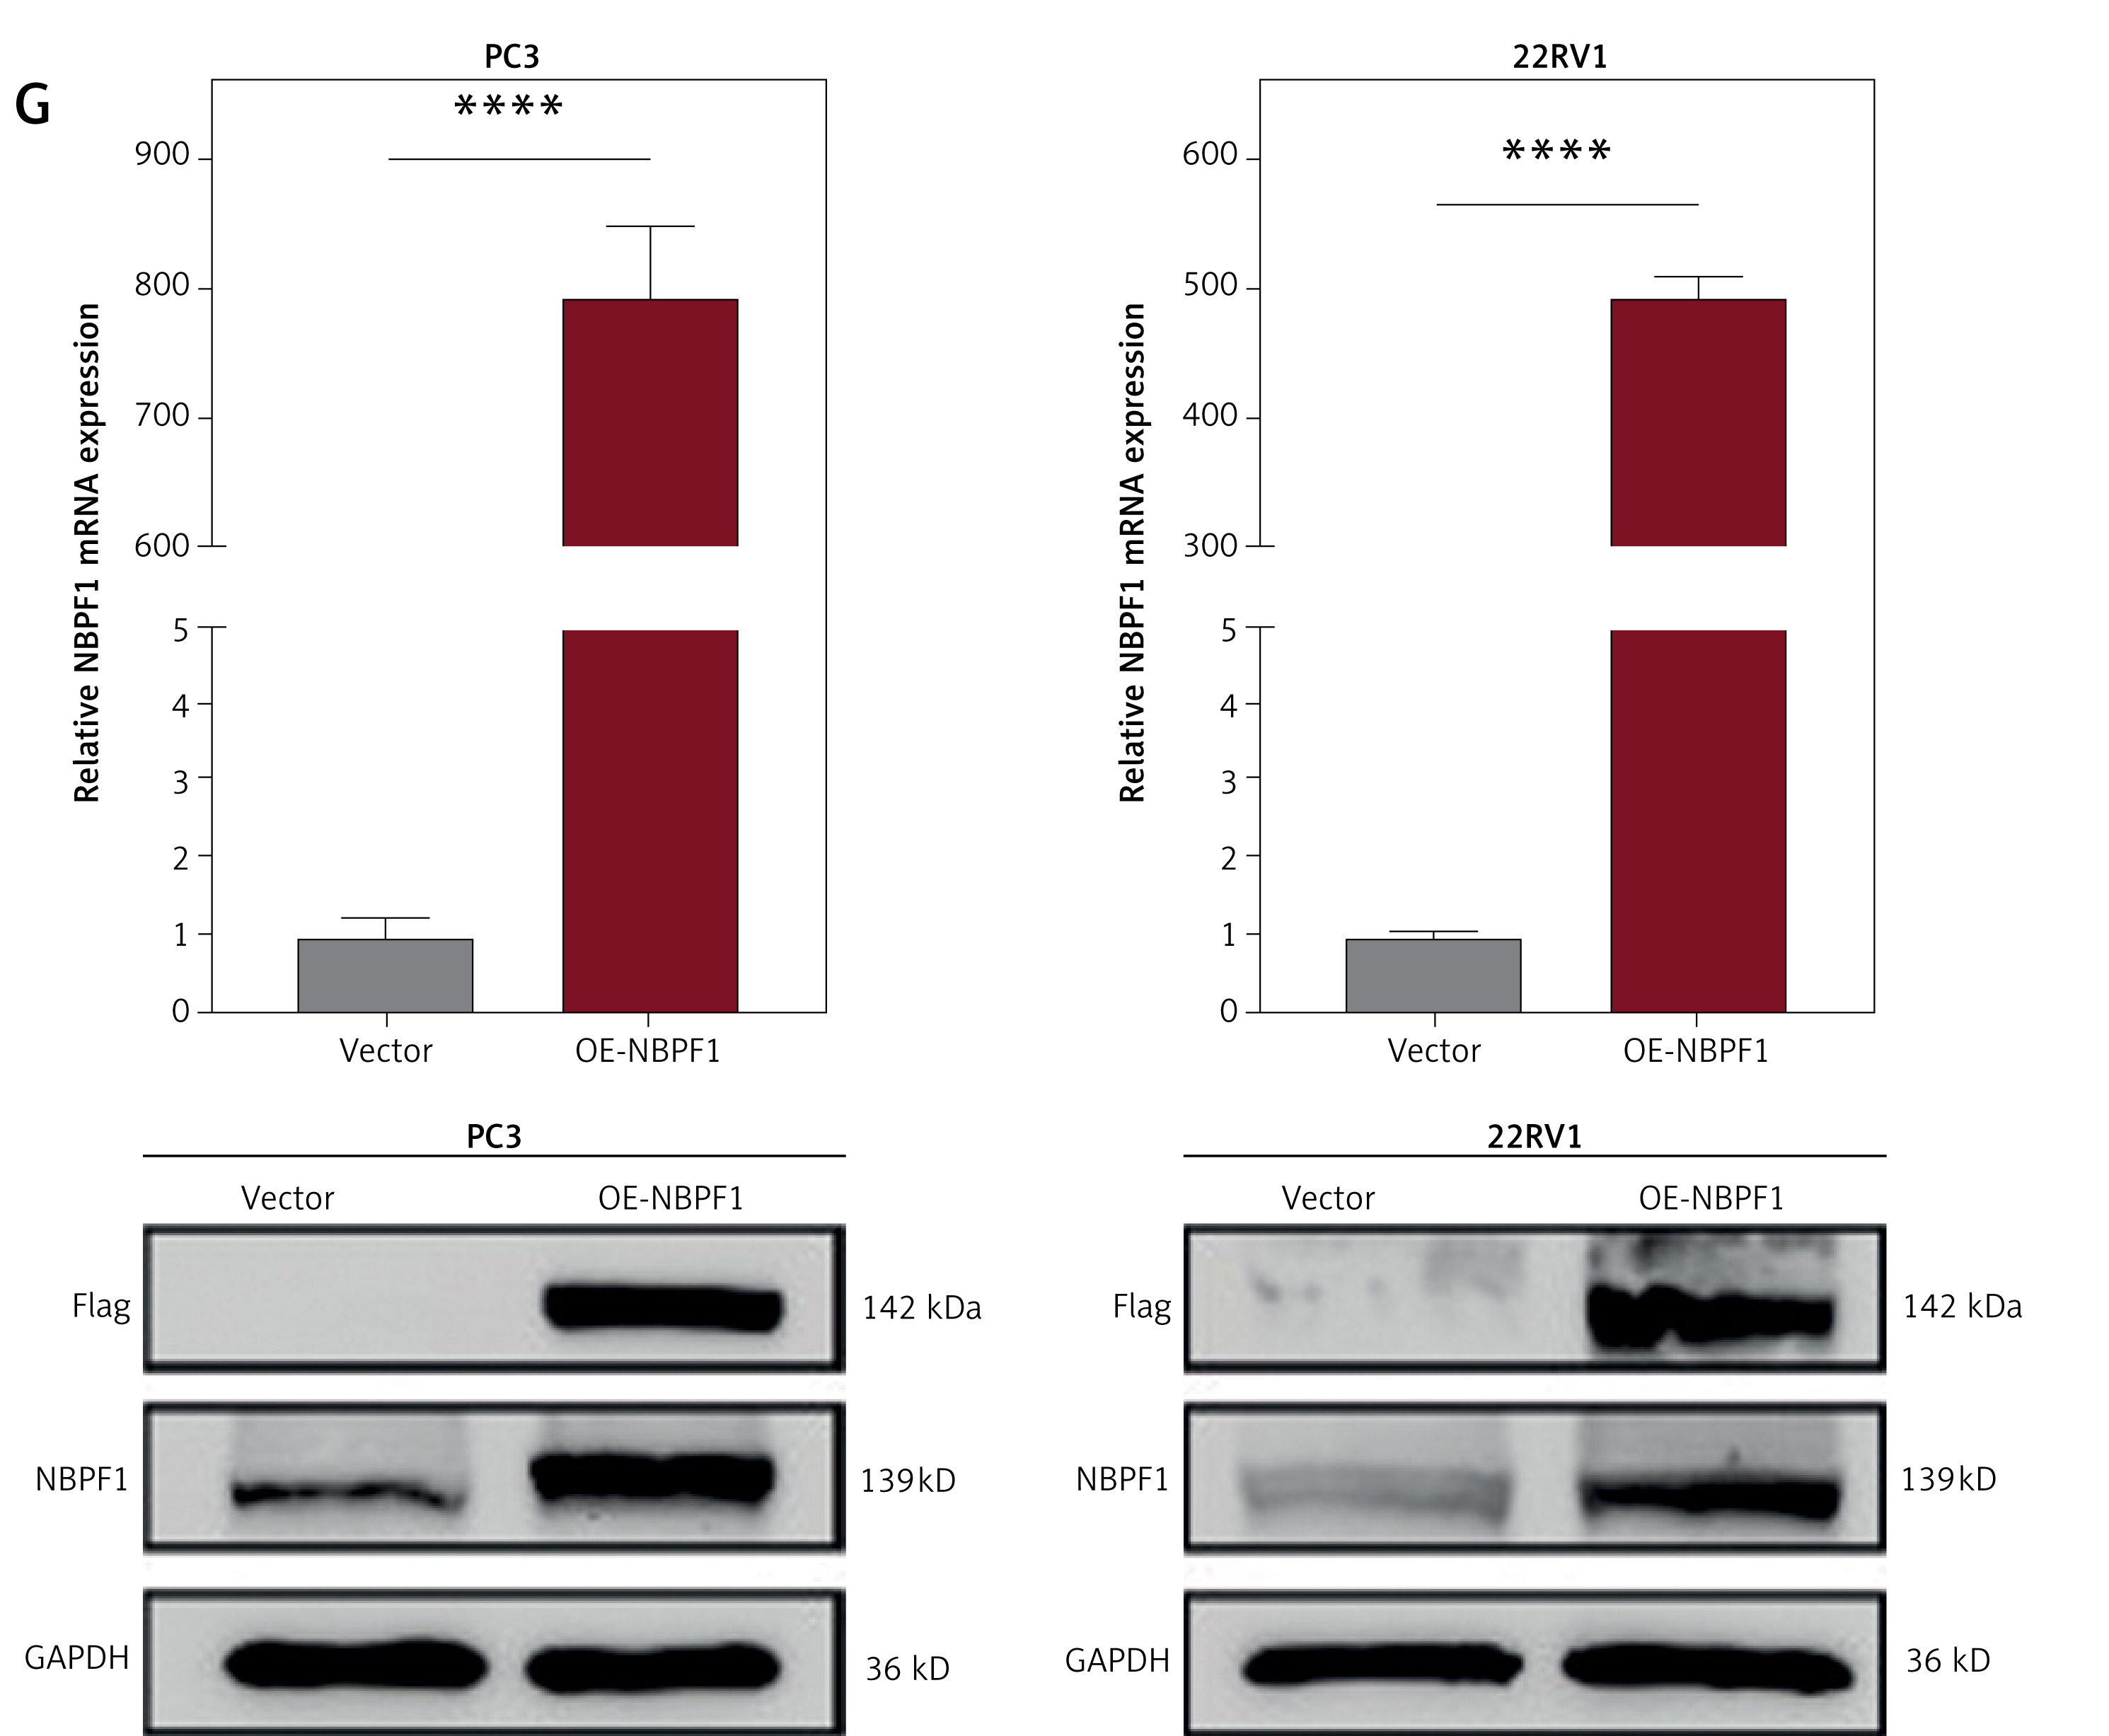
NBPF1 is downregulated in clinical PCa specimens and cell lines. A – Representative IHC images of NBPF1 in PCa and corresponding benign counterparts (scale bars: 200 μm and 50 μm). B – Quantitative comparison of NBPF1 H-scores in PCa versus normal tissues from the TMA. C – Association between NBPF1 expression levels and key clinical parameters (pie chart). D, E – NBPF1 transcript (D) and mature protein (E) abundance in a panel of PCa cell lines versus RWPE-1. F, G – Efficiency of NBPF1 knockdown and overexpression was verified by qRT-PCR (F) and immunoblotting (G)
*P < 0.05; **P < 0.01; ***P < 0.001; ****P < 0.0001; ns – not significant.
NBPF1 inhibits PCa cell proliferation in vitro
We first profiled NBPF1 expression across a panel of prostate cell lines to explore its functional relevance in PCa. Mirroring the clinical observations, both transcriptional and protein analyses confirmed consistent downregulation of NBPF1 in all tested PCa lines (LNCaP, 22RV1, PC3, DU145) compared to the non-malignant RWPE-1 cells. Among the PCa lines, NBPF1 expression was highest in DU145, intermediate in PC3, and lowest in 22RV1 (Figures 2 D, E). Accordingly, these three lines were selected for subsequent experiments.
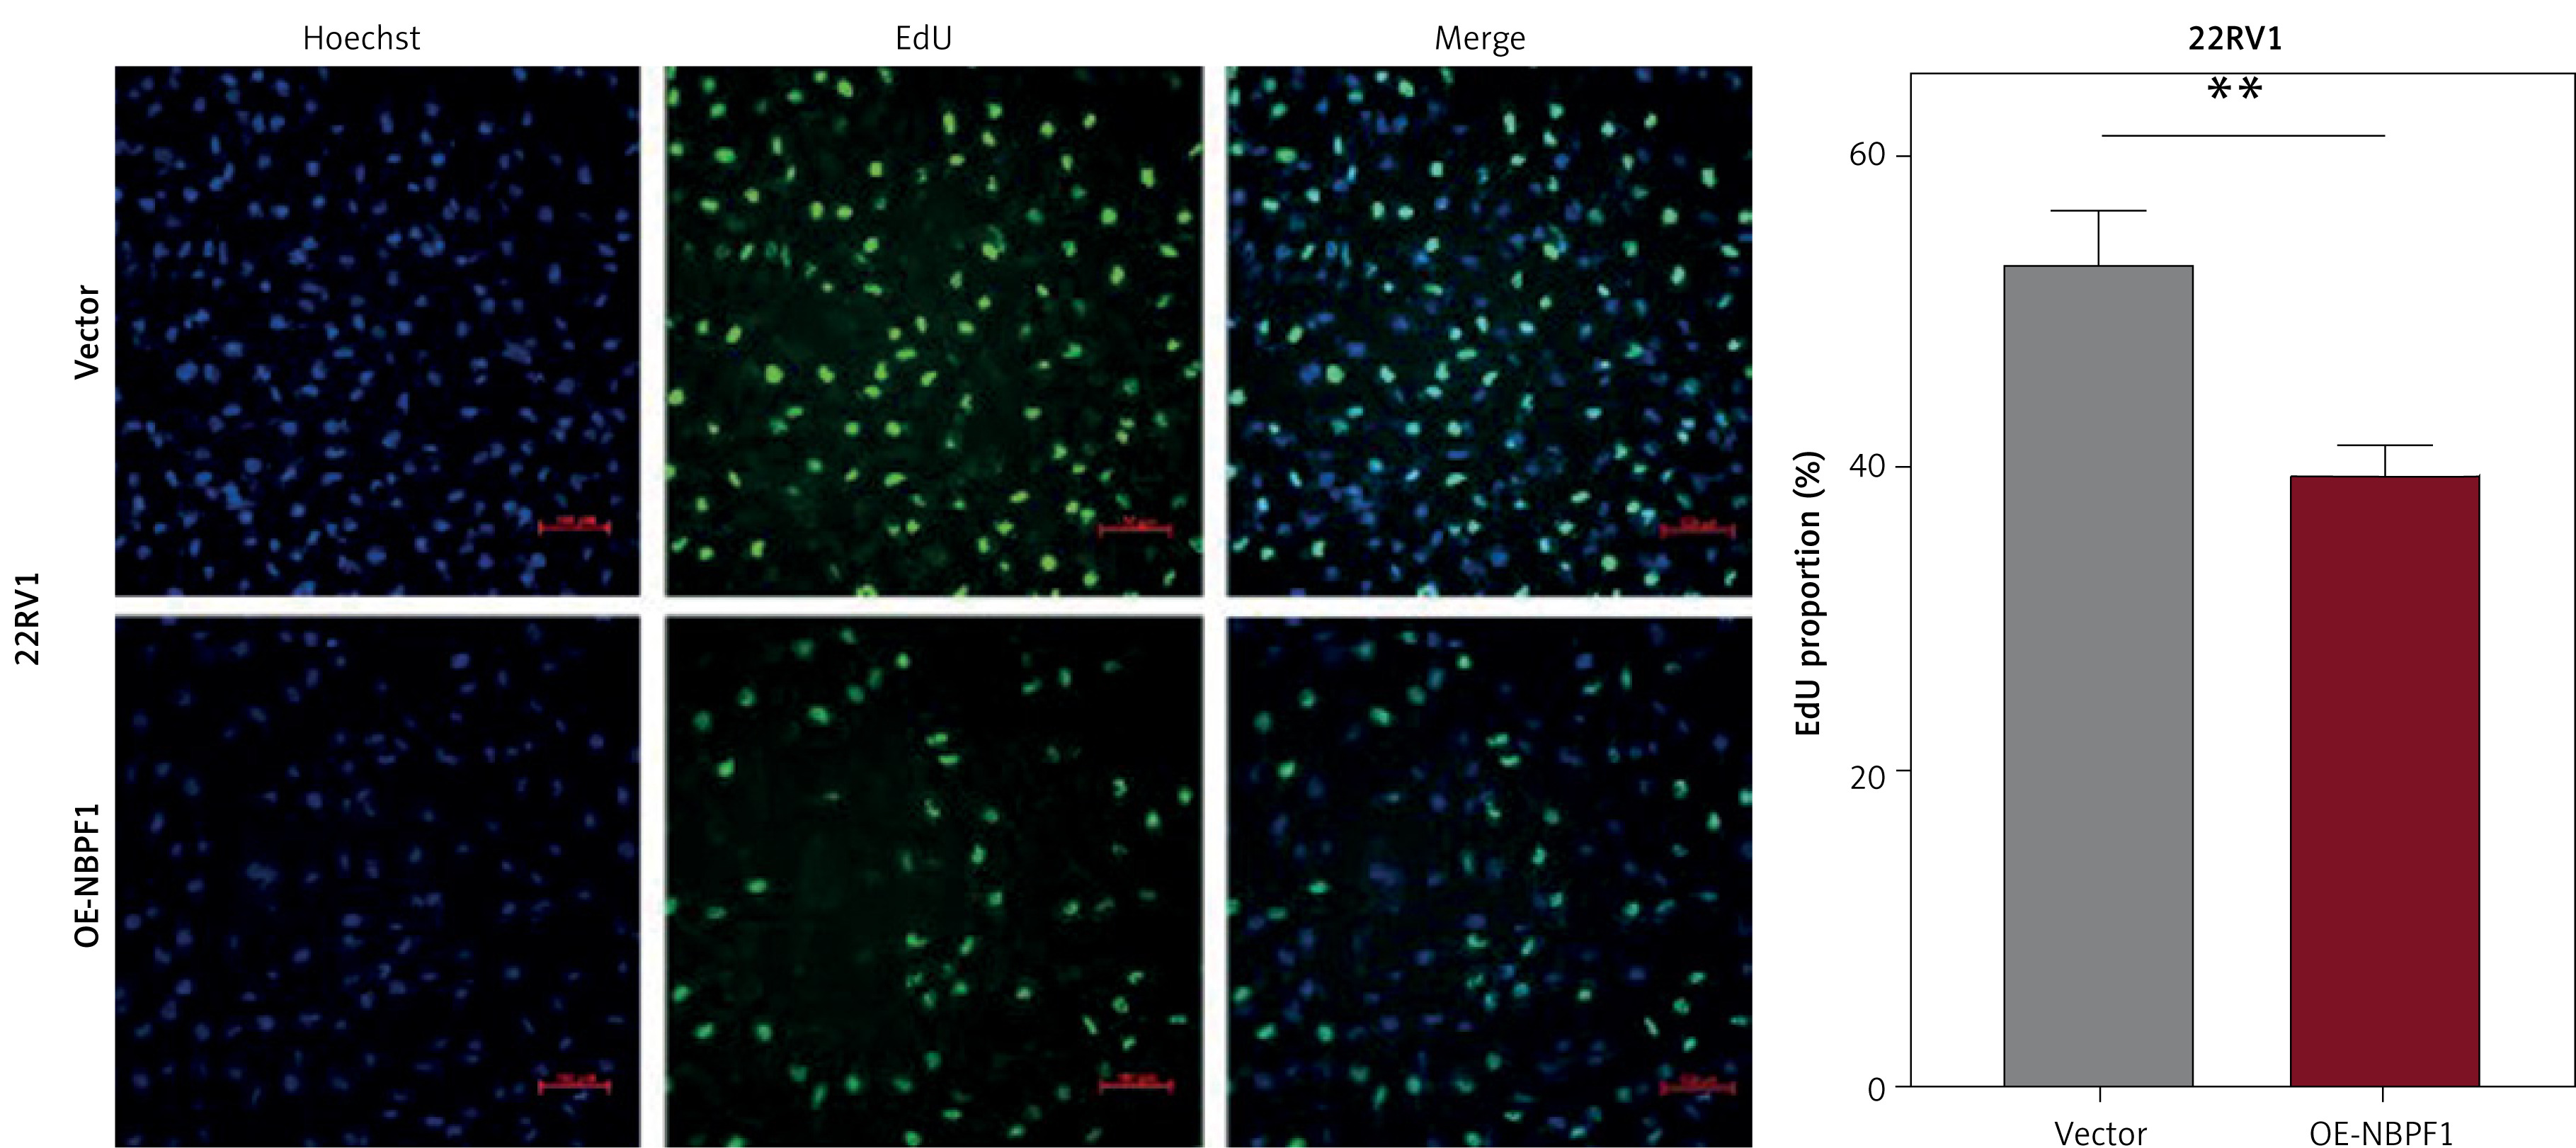
Stable NBPF1 knockdown was generated in DU145 and PC3 cells, while stable overexpression was established in 22RV1 and PC3 cells using lentiviral transduction. The efficiencies of NBPF1 knockdown and overexpression were ascertained by qRT-PCR and immunoblotting analyses (Figures 2 F, G). NBPF1 knockdown significantly enhanced the colony-forming ability, as measured by colony formation assays, compared with the control cells (Figure 3 A). In contrast, NBPF1 overexpression reduced the colony formation ability (Figure 3 B). CCK-8 data confirmed these results, showing that NBPF1 knockdown accelerated the cell proliferation rate, while overexpression markedly inhibited proliferation (Figures 3 C, D). EdU incorporation assays further supported these findings, showing increased DNA synthesis in NBPF1-knockdown cells, while NBPF1 overexpression reduced the proportion of EdU-positive cells (Figures 3 E, F).
Figure 3
NBPF1 inhibits PCa cell proliferation in vitro. A, B – Colony formation in PC3 and DU145 cells after NBPF1 knockdown (A) and in PC3 and 22RV1 cells after NBPF1 overexpression (B). C, D – Cell proliferation measured by CCK-8 assay following NBPF1 knockdown (C) or overexpression (D). E, F – DNA synthesis rates assessed by EdU incorporation assay after NBPF1 knockdown (E) or overexpression (F)
*P < 0.05; **P < 0.01; ***P < 0.001; ****P < 0.0001; ns – not significant.
NBPF1 inhibits PCa cell migration and invasion
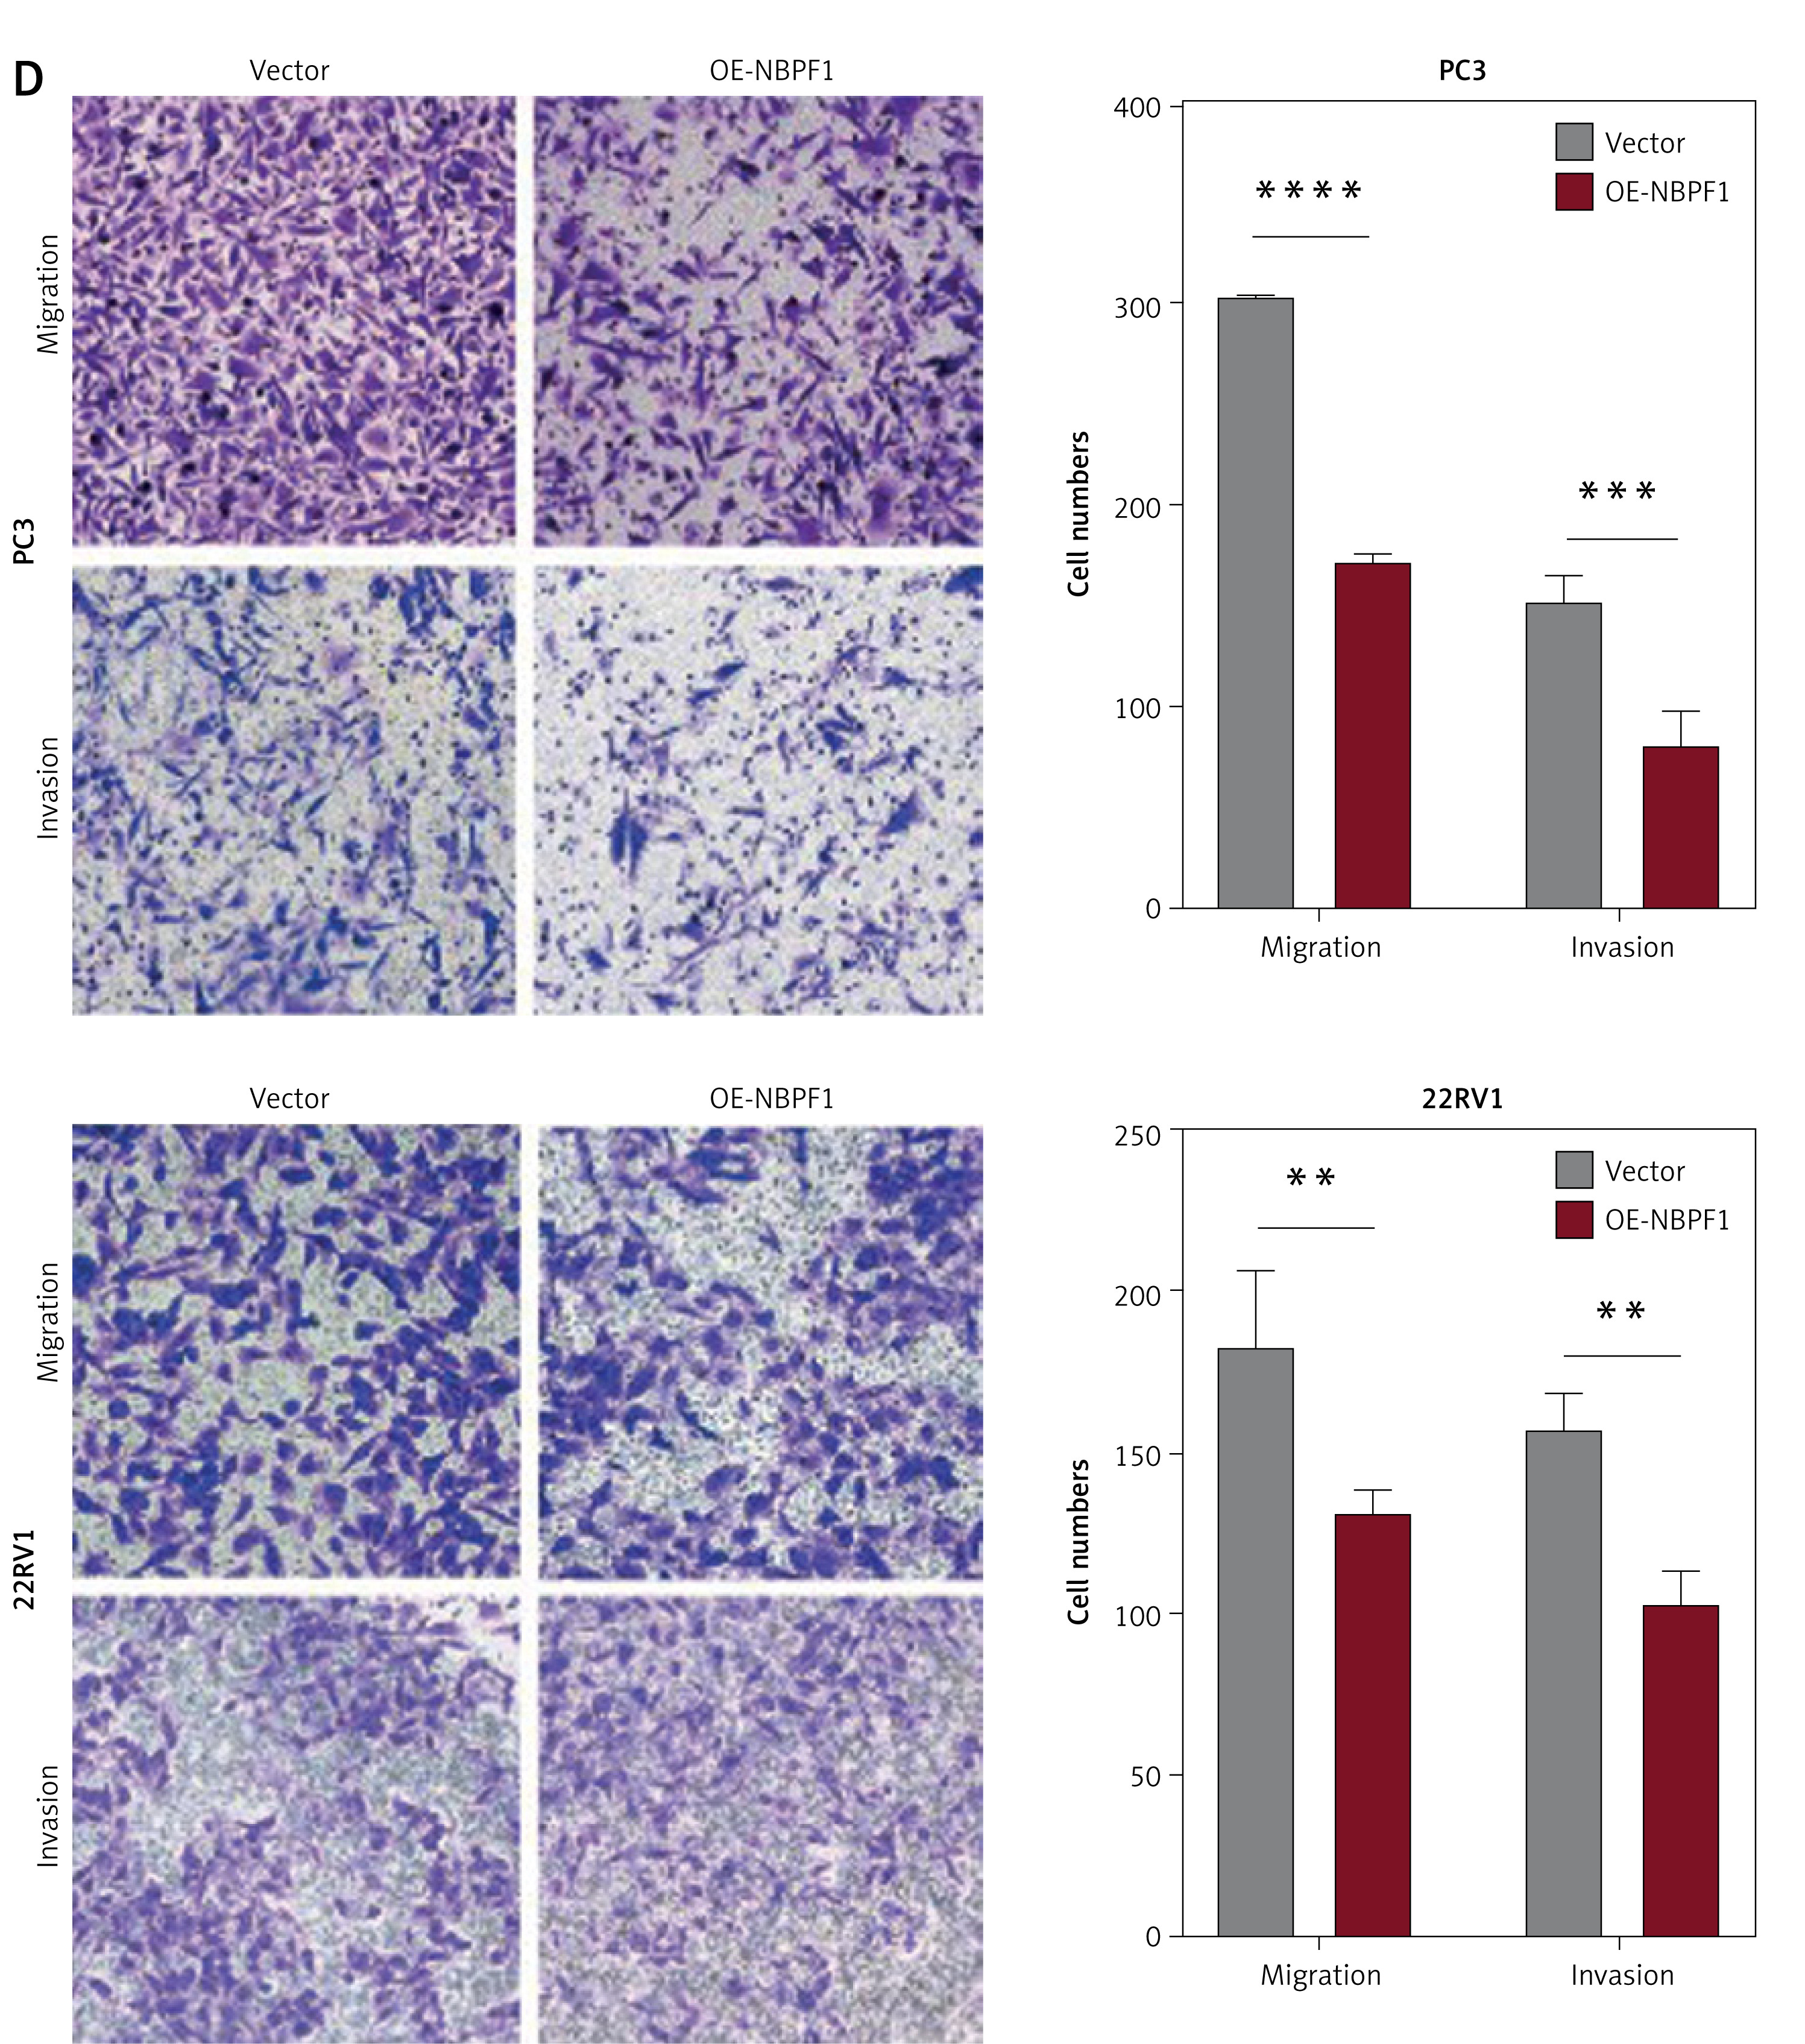
Wound healing assays revealed a significantly higher migration rate in NBPF1-knockdown cells relative to controls (Figure 4 A). The results showed faster wound closure following NBPF1 knockdown, indicating that loss of NBPF1 could promote PC3 and DU145 cell migration. However, NBPF1 overexpression yielded the opposite effect, manifesting as diminished cell motility of 22RV1 and PC3 cells (Figure 4 B). Transwell assays corroborated our prior data, demonstrating that NBPF1 knockdown significantly boosted the capacities of both PC3 and DU145 cells to move through and invade respective membrane substrates (Figure 4 C). These data suggest that NBPF1 acts as a negative regulator of PCa metastasis, with its depletion enhancing the metastatic potential of PCa cells in vitro. Conversely, NBPF1 overexpression impaired the movement of PC3 and 22RV1 cells (Figure 4 D), underscoring its restraining role in PCa dissemination.
Figure 4
NBPF1 inhibits PCa cell migration and invasion. A, B – Cell migration assessed by wound healing assay after NBPF1 knockdown (A) or overexpression (B). C, D – Cell migration and invasion evaluated by Transwell assay following NBPF1 knockdown (C) or overexpression (D)
*P < 0.05; **P < 0.01; ***P < 0.001; ****P < 0.0001; ns – not significant.
NBPF1 regulates cell cycle progression
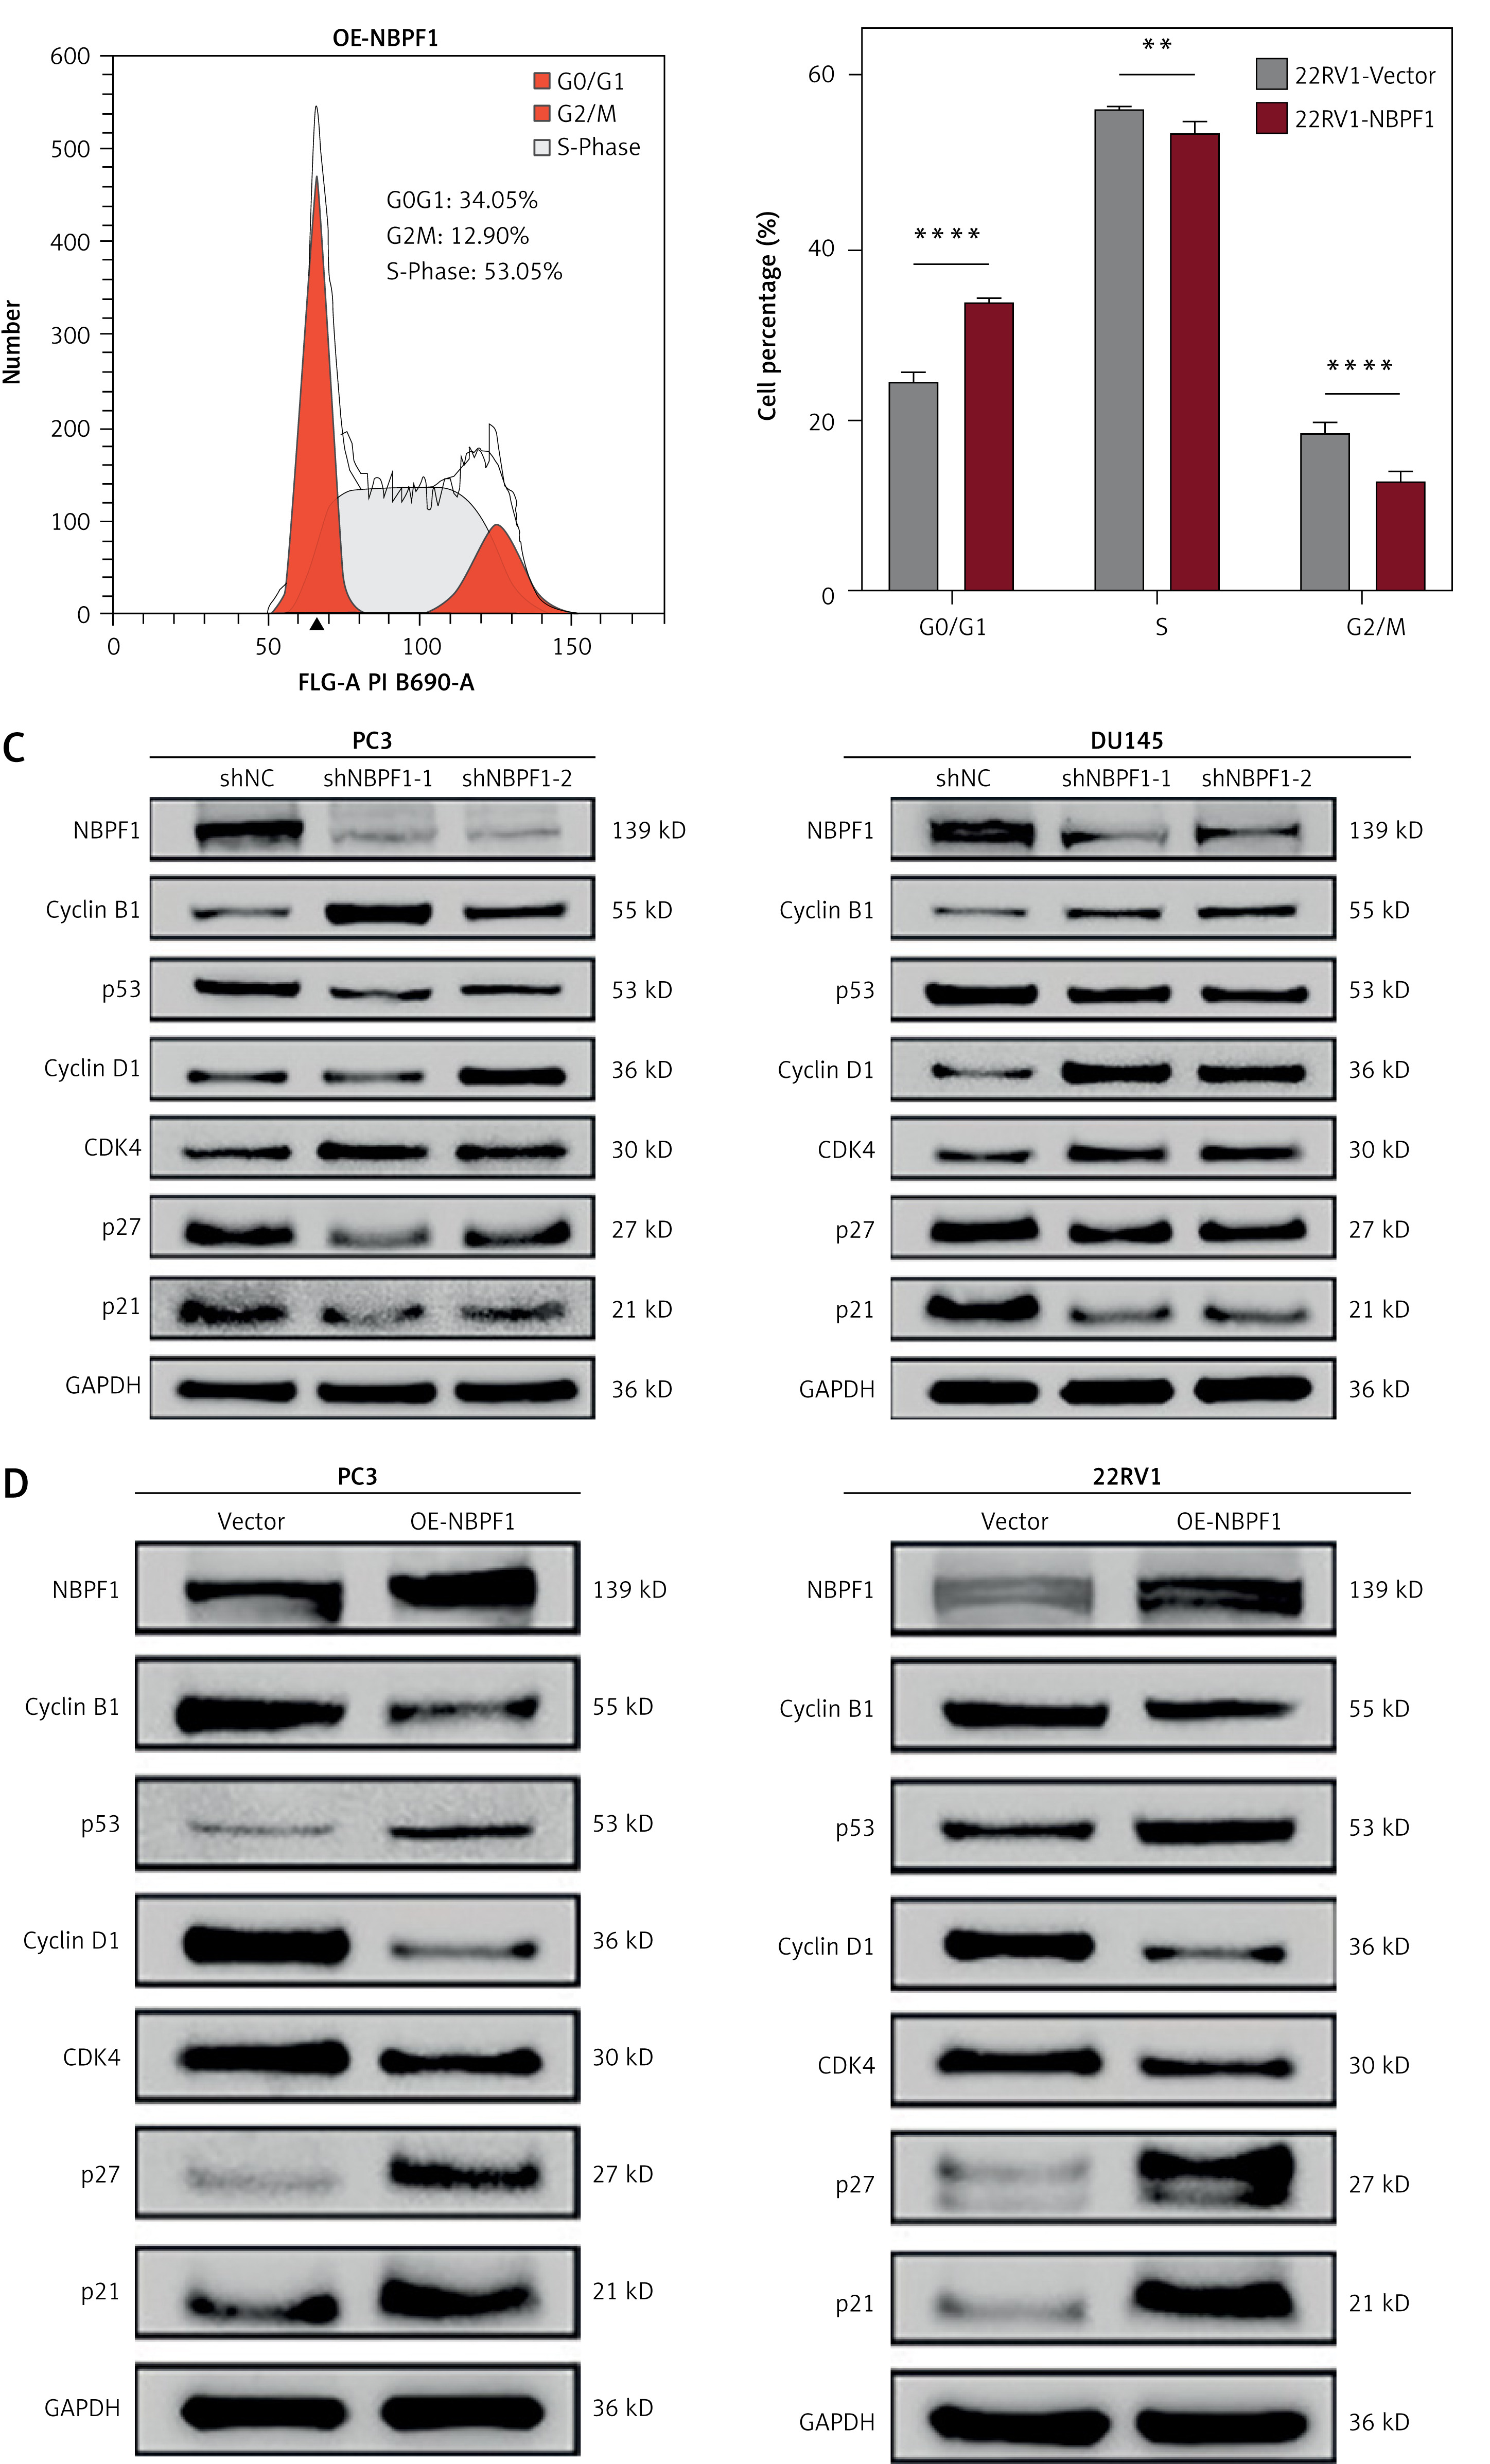
Flow cytometry revealed that NBPF1 knockdown markedly altered the cell cycle profile and progression of PC3 and DU145 cells, primarily by reducing G0/G1 phase arrest and driving progression into S and G2/M (Figure 5 A). Conversely, NBPF1 overexpression induced G0/G1 phase arrest, impeding cell cycle progression (Figure 5 B). At the molecular level, NBPF1 knockdown downregulated the tumor suppressors p21, p27, and p53, while concomitantly elevating the levels of key cell cycle drivers CDK4, cyclin B1, and cyclin D1 (Figure 5 C), confirming NBPF1’s role in cell cycle regulation. Correspondingly, NBPF1 overexpression produced a reciprocal pattern for these proteins (Figure 5 D). These findings collectively establish NBPF1 as a central gatekeeper that enforces cell-cycle exit, highlighting its tumor-suppressive function via constraining abnormal proliferation.
Figure 5
NBPF1 regulates cell cycle progression. A, B – Cell cycle distribution was analyzed by flow cytometry after NBPF1 knockdown (A) or overexpression (B). C, D – Western blot analysis of key cell cycle-related proteins after NBPF1 knockdown (C) or overexpression (D)
*P < 0.05; **P < 0.01; ***P < 0.001; ****P < 0.0001; ns – not significant.
NBPF1 suppresses PCa tumor growth in vivo
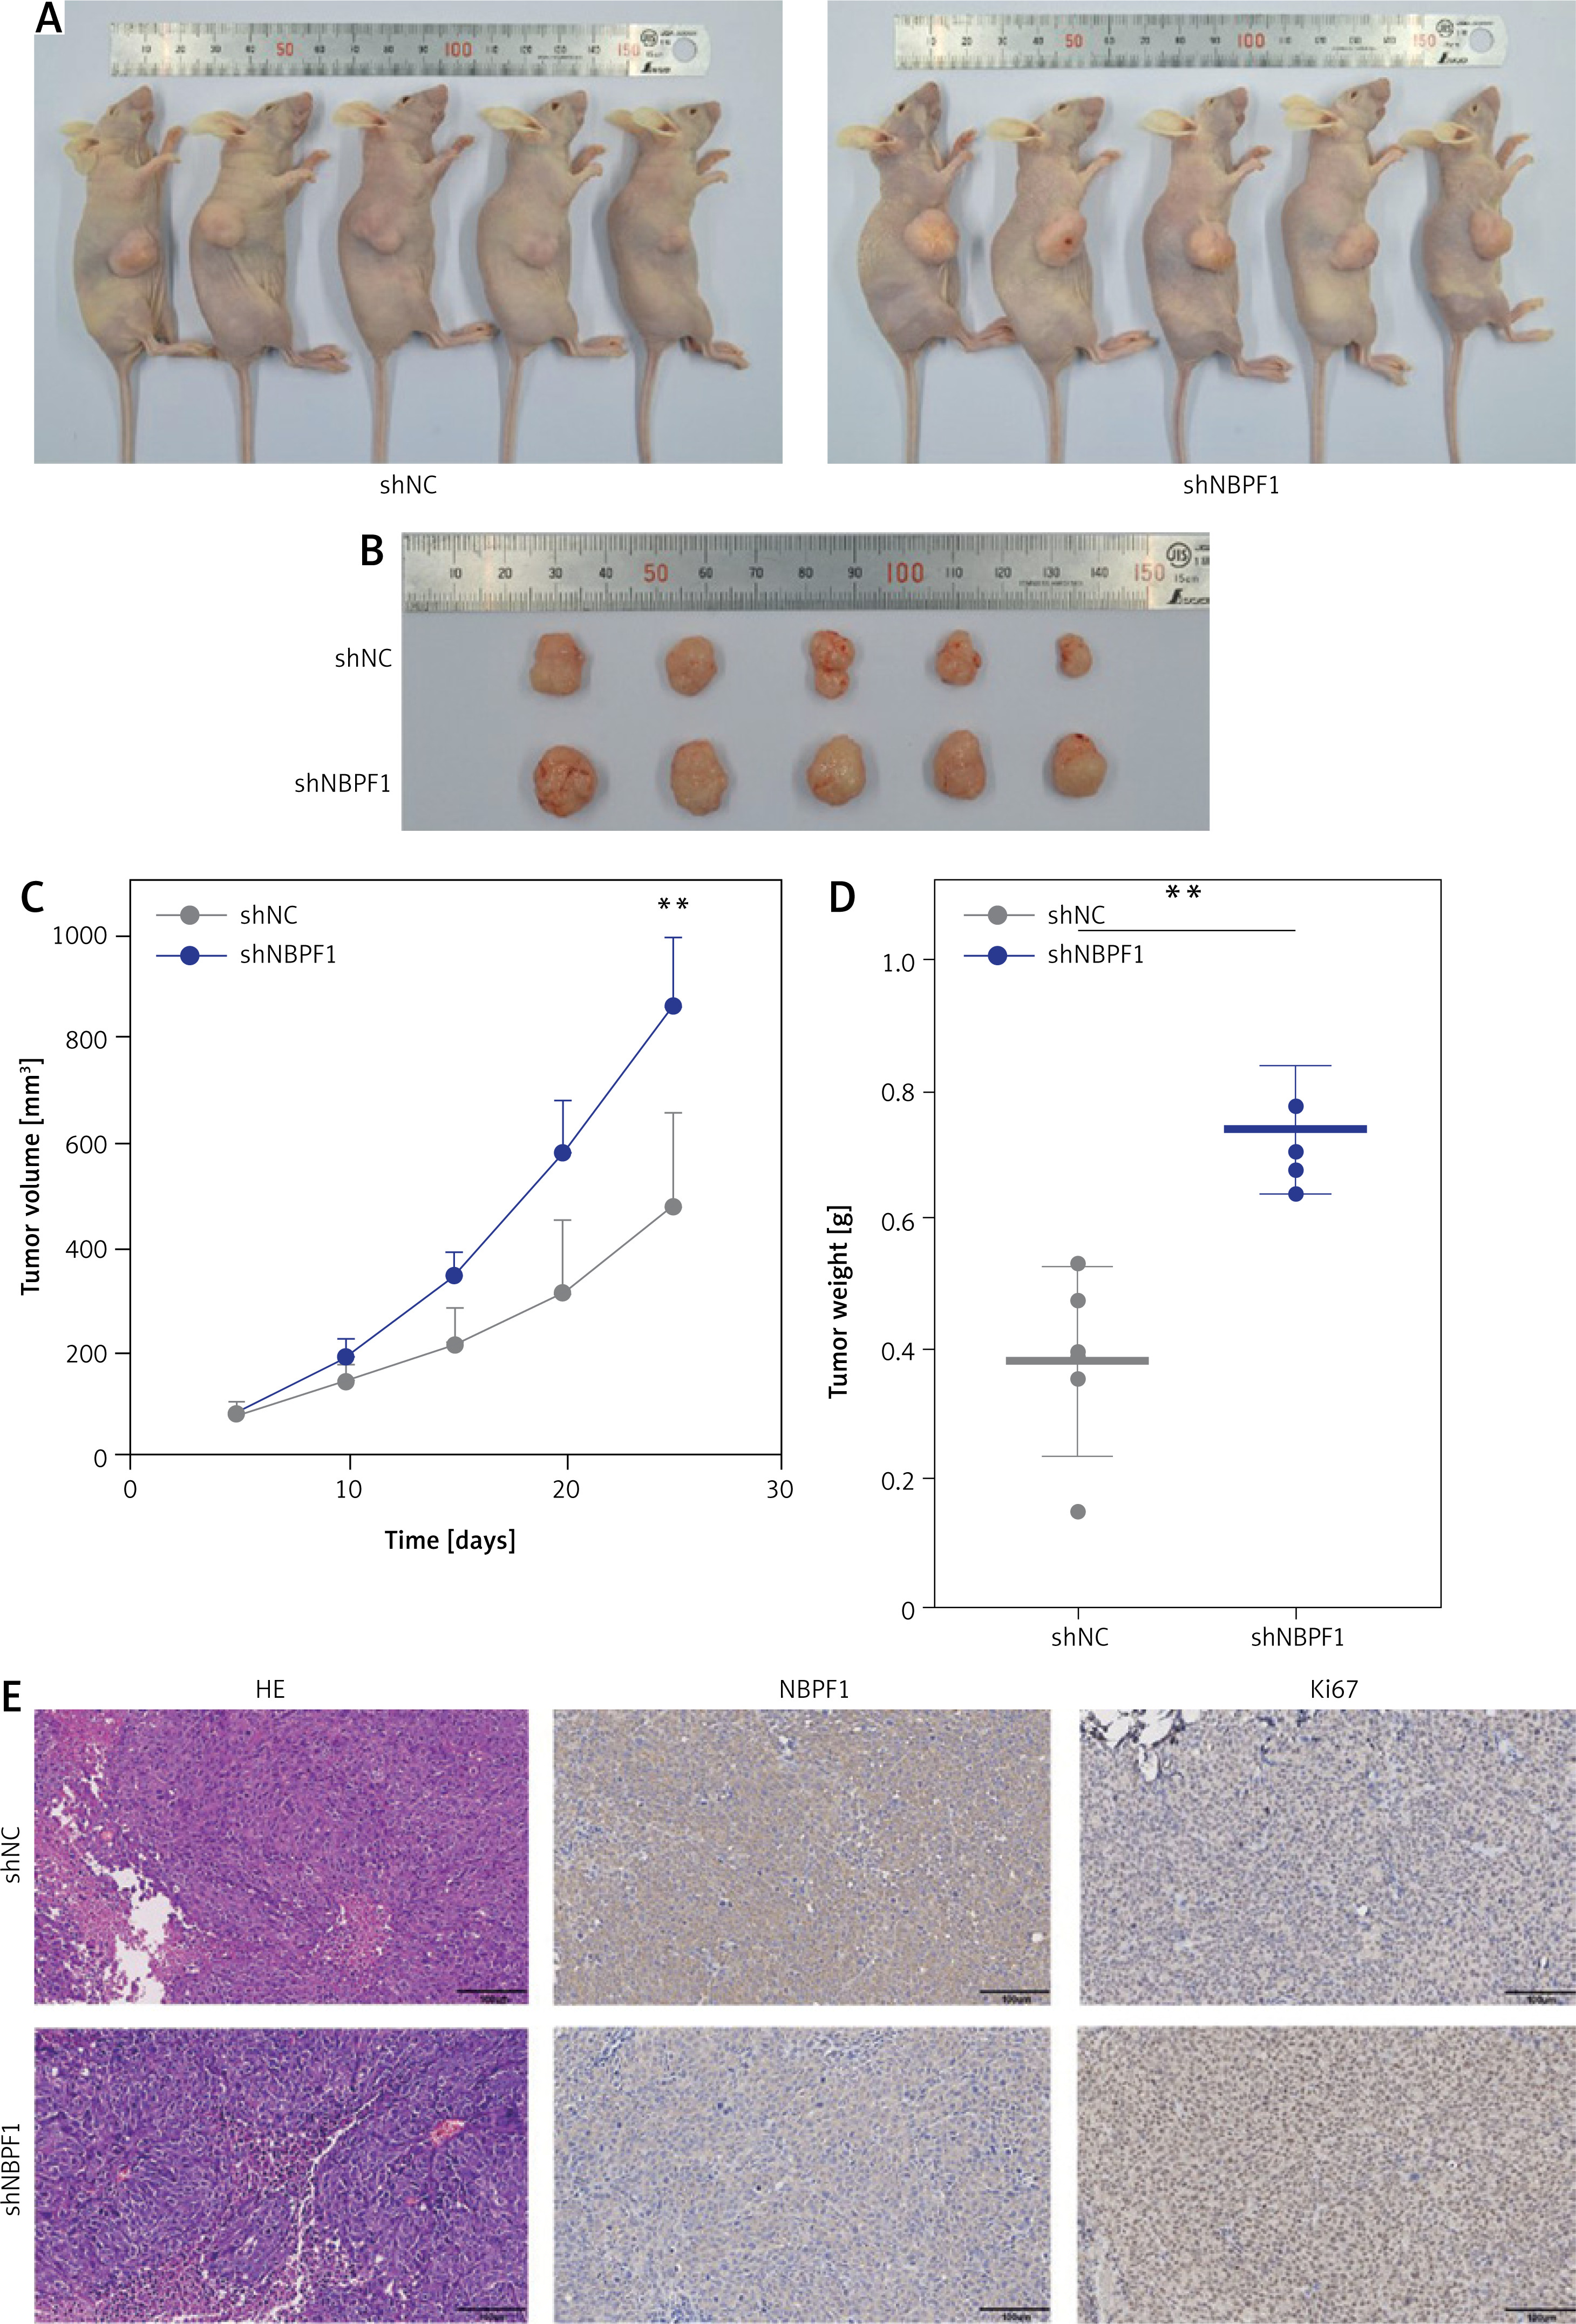
For an in vivo assessment of NBPF1 function during PCa progression, we established xenograft models using PC3 cells with stable NBPF1 knockdown. Tumors with NBPF1 depletion exhibited markedly accelerated growth relative to control grafts (Figures 6 A, B). Four weeks after inoculation, tumors from mice implanted with PC3 cells with stable NBPF1 knockdown exhibited significantly higher volume and weight compared with tumors from mice implanted with control cells (Figures 6 C, D). IHC staining corroborated the successful knockdown, showing diminished NBPF1 and increased Ki-67 expression in the experimental group (Figure 6 E). These data highlight the potential of NBPF1 as a tumor suppressor in PCa, with its loss promoting tumor growth and progression in vivo.
Figure 6
NBPF1 suppresses PCa tumor growth in vivo. A – In vivo images of tumor-bearing nude mice from the PC3- sh NC and PC3-shNBPF1 groups. B – Representative images of the corresponding resected tumors. C – Tumor volume measurement curves of the PC3-sh NC and PC3-shNBPF1 groups over time. D – Tumor weights from the PC3- sh NC and PC3-shNBPF1 groups at the endpoint. E – Representative H&E and IHC staining for NBPF1 and Ki-67 in xenograft tumor sections (scale bars: 100 μm)
*P < 0.05; **P < 0.01; ***P < 0.001; ****P < 0.0001; ns – not significant.
Identification of key NBPF1-regulated pathways using transcriptomic analysis
To delineate the mechanisms of NBPF1 in PCa, we stratified TCGA samples by NBPF1 expression. Subsequent differential expression analysis identified 2,061 DEGs, comprising 1,802 upregulated and 259 downregulated genes (Figure 7 A). KEGG enrichment analysis implicated several oncogenic pathways and signaling axes, most notably PI3K/AKT and TGF-β (Figure 7 B). RNA-seq analysis of control and NBPF1-knockdown PC3 cells identified distinct expression profiles between these groups (Figure 7 C). Similarly, KEGG analysis of the RNA-seq data highlighted activation of key oncogenic cascades, including PI3K/AKT, Wnt, and MAPK (Figure 7 D). These observations prompted us to examine whether the PI3K/AKT axis mediates NBPF1-induced tumor suppression, thereby underscoring its pivotal role in restraining PCa progression.
Figure 7
NBPF1 negatively regulates the PI3K/AKT pathway. A – Volcano plot displaying DEGs across high- versus low-NBPF1 expression groups in the TCGA-PRAD cohort. B – KEGG enrichment map for DEGs across high- versus low-NBPF1 expression groups in the TCGA-PRAD cohort. C – Heatmap of DEGs between PC3-sh NC and PC3- shNBPF1 cells. D – KEGG enrichment map for DEGs identified between PC3-shNBPF1 and sh NC cells. E, F – Protein-level profiling of core PI3K/AKT signaling components and MMPs after NBPF1 knockdown (E) or overexpression (F)
*P < 0.05; **P < 0.01; ***P < 0.001; ****P < 0.0001; ns – not significant.
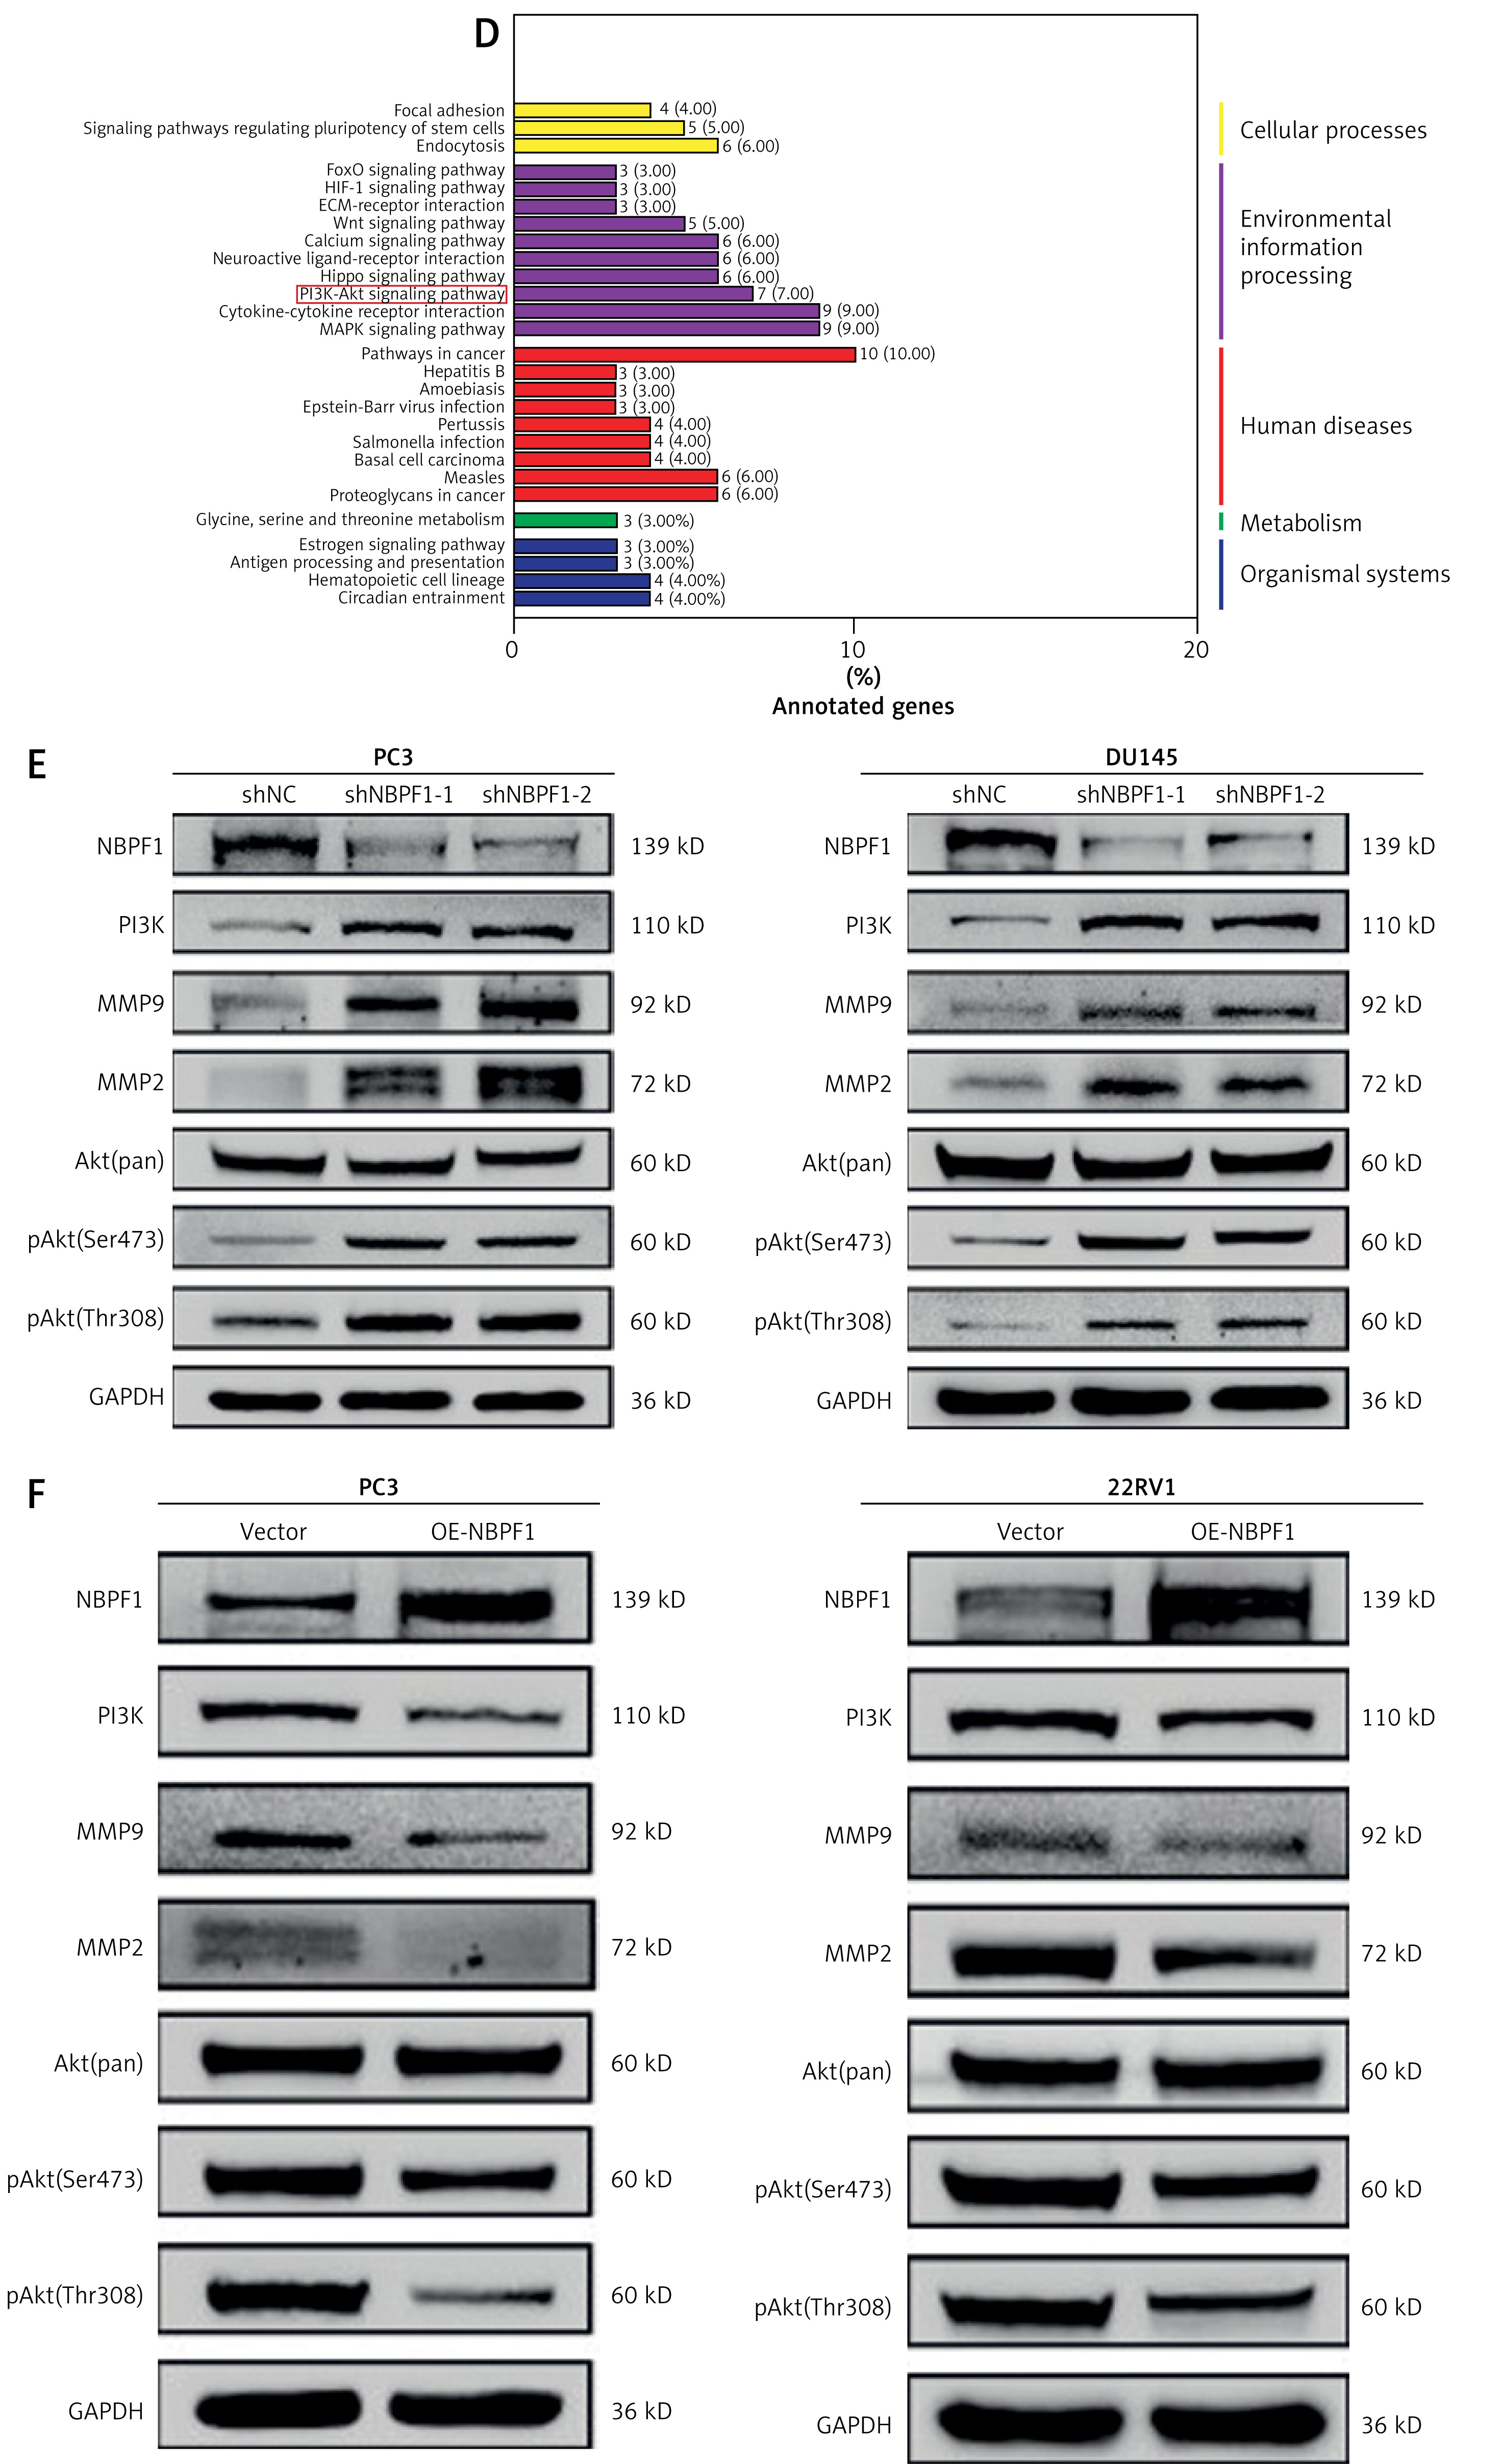
NBPF1 negatively regulates the PI3K/AKT pathway
To further validate the involvement of the PI3K/AKT pathway, we interrogated key signaling nodes in NBPF1-knockdown and overexpressing cells. Immunoblotting analysis demonstrated that NBPF1 knockdown elevated the AKT activation marks, namely phospho-Ser473 and phospho-Thr308, markers of PI3K/AKT pathway activation. Additionally, PI3K protein was itself elevated upon NBPF1 knockdown, consistent with heightened pathway activity (Figure 7 E). In contrast, NBPF1 overexpression reduced both p-AKT and PI3K levels, indicating suppressed pathway activation (Figure 7 F). Notably, under these conditions, the downstream mTOR pathway showed only marginal changes (Supplementary Figure S1), suggesting that the primary signaling output of NBPF1-modulated AKT activity may channel through alternative effectors. Supporting this, the expression of canonical PI3K/AKT-downstream effectors, matrix metalloproteinase (MMP) 2 and MMP9, was upregulated in NBPF1-knockdown cells and downregulated in NBPF1-overexpressing cells. As critical mediators of metastasis, MMP2 and MMP9 enable tumor-cell motility by enzymatically cleaving the ECM components. These data collectively support the role of NBPF1 in negatively regulating PI3K/AKT-driven signaling circuits in PCa cells.
Discussion
Driven by aging populations and widespread prostate-specific antigen screening, PCa diagnoses are rising, making it the most common urinary malignancy posing a major threat to men’s health [1]. Once PCa reaches late-stage disease, the likelihood of living beyond 5 years drops to just 30% [26], creating an imperative for novel therapeutic avenues to combat disease progression. While genomic alterations in the AR and PTEN/PI3K-AKT pathways dominate current therapeutic strategies, emerging evidence suggests that non-canonical regulators, such as the NBPF proteins, may orchestrate adaptive resistance mechanisms. In this study, we focused on NBPF1 and its anticancer effects in PCa. Given that expression changes often mirror functional relevance, we systematically examined NBPF1 levels across public datasets, tissue samples, and cell lines. Our analysis revealed that NBPF1 expression is reduced in PCa and independently forecasts longer survival. Using complementary overexpression and knockdown models, we established that elevated NBPF1 expression suppresses PCa cell proliferation, migration, and invasion, with reciprocal effects on knockdown. These results further confirmed that NBPF1 functions as a tumor suppressor in PCa.
Uncontrolled cell proliferation is a cardinal attribute of malignancy, underlying the process of oncogenic tumorigenesis. Under normal conditions, the cell cycle is tightly regulated. However, aberrant cycling upsets the equilibrium between division and lineage commitment, culminating in cancer development [27]. A dysregulated cell cycle drives aberrant proliferation and is an established contributor to multiple facets of malignancy, including tumorigenesis, metastatic dissemination, and therapeutic resistance [28–31]. P53, a key tumor suppressor, maintains cellular stability by negatively regulating the cell cycle through activation of p21 and p27 [32–34]. Both p27 and p21 have been shown to be downregulated in PCa, with p27 deficiency linked to more aggressive tumor characteristics [35]. In contrast, cyclins and CDKs serve as critical promoters of cell cycle transition. When activated by cyclins, CDKs drive cell cycle progression by phosphorylating target proteins, facilitating the transition from one phase to the next [36]. Therefore, dysregulation of cyclins and CDKs, commonly observed in PCa, accelerates uncontrolled cell proliferation. For example, cyclin D1 overexpression is a common feature in PCa, often coinciding with advanced tumor grade and increased Ki-67 labeling [37, 38]. Furthermore, both CDKs and cyclins are regulated by ARs and are integral to CRPC progression [39, 40]. Our data indicated that NBPF1 orchestrates a tumor-suppressive signaling node by augmenting p53, p21, and p27 levels, while concurrently repressing positive cell-cycle drivers, exemplified by cyclin D1, cyclin B1, and CDK4. This regulatory circuit promotes G0/G1 phase arrest, indicating that NBPF1 governs cell cycle progression through targeted gene regulation to ultimately constrain PCa proliferation.
Beyond uncontrolled proliferation, tumor cells acquire an invasive phenotype, enabling them to disseminate into adjacent tissues and distant sites, thereby driving disease progression and worsening clinical outcomes [27]. MMPs represent a major class of zinc-dependent endopeptidases with pivotal roles in ECM degradation and remodeling, notably including MMP2 and MMP9 [41]. Elevated MMP2 and MMP9 expression levels are frequently observed in various cancers, with their overexpression often linked to more aggressive tumor behavior and poorer clinical outcomes [42, 43]. Our analysis preliminarily confirmed that NBPF1 impedes the motility and invasiveness of PCa cells. Reduced expression levels of key proteins associated with migration and invasion, including MMP2 and MMP9, were also observed. This evidence further consolidated NBPF1’s function in blocking the PCa metastatic potential by negatively regulating molecules involved in ECM degradation.
As a master regulator of cellular homeostasis, the PI3K/AKT pathway, when dysregulated in malignancies, promotes tumorigenesis by accelerating cell division and conferring migratory abilities [44]. Under physiological conditions, PI3K activation triggers AKT phosphorylation, initiating an effector cascade that drives cell cycle progression, suppresses apoptotic pathways, and enhances cellular survival. In neoplastic contexts, aberrant activation of the PI3K/AKT pathway, frequently caused by mutations in upstream signaling molecules or loss of tumor suppressors such as PTEN, leads to uncontrolled proliferation and resistance to cell death signals [45, 46]. Furthermore, the oncogenic role of this pathway extends to regulating cell migration and invasion, pivotal steps in metastasis. This is partly achieved through AKT-mediated modulation of MMPs, including MMP2 and MMP9 [47, 48]. Owing to its fundamental involvement in disease pathogenesis, the PI3K/AKT pathway holds significant translational appeal as a rational therapeutic target in PCa and other cancers. The goal of these therapies is to inhibit the activity of this pathway to block both tumor proliferation and metastatic spread [48–50]. In the current study, our RNA-seq analysis revealed that NBPF1 can regulate several critical biological processes, particularly the PI3K/AKT signaling pathway. Our data suggested that NBPF1 negatively regulates this pathway by suppressing AKT phosphorylation, primarily at Ser473 and Thr308. These results extend the catalog of cancers in which NBPF1 displays tumor-repressive behavior, joining neuroblastoma, cervical lesions, and skin squamous-cell cancer. For instance, Andries et al. reported that NBPF1 can inhibit neuroblastoma progression through a blockade at the G1/S boundary [23]. Similarly, NBPF1 constrains neoplastic expansion in both cervical carcinoma and cutaneous squamous carcinoma through distinct mechanisms: by targeting the PI3K/mTOR axis in the former and the AKT-p53-cyclin cascade in the latter [21, 22]. However, our study addressed a critical knowledge gap by defining the tumor-suppressive function of NBPF1 in PCa, a malignancy in which its function was previously uncharacterized. These results further confirmed that PI3K/AKT signaling is a downstream pathway regulated by NBPF1 and involved in PCa progression.
Our study establishes the therapeutic relevance of NBPF1, positioning it as a promising druggable target. Strategies to restore NBPF1 expression, such as epigenetic reactivation or gene therapy, could complement existing treatments targeting the PI3K/AKT pathway. Combining NBPF1-based therapies with PI3K inhibitors or ADT may yield synergistic effects, particularly in advanced or therapy-resistant PCa cases. However, the development of therapies targeting NBPF1 will require a deeper understanding of its regulatory mechanisms, particularly in the context of tumor heterogeneity and treatment resistance.
Although our study provides valuable insights, several limitations should be acknowledged. First, although our data from cellular, animal, and clinical analyses consistently support the tumor suppressive role of NBPF1, follow-up work using expanded pre-clinical models and larger clinical cohorts is required to fully validate its effects on PCa progression. Second, the precise mechanisms driving NBPF1 downregulation in PCa await further elucidation. Epigenetic modifications, such as promoter methylation or histone acetylation, may contribute to its decreased expression levels in this disease. Finally, the specific downstream targets of NBPF1 and exact signaling pathways that are regulated remain incompletely understood. Delineating the broader molecular network of NBPF1 and its functional integration with other signaling pathways will be crucial for a deeper comprehension of its role in PCa biology.
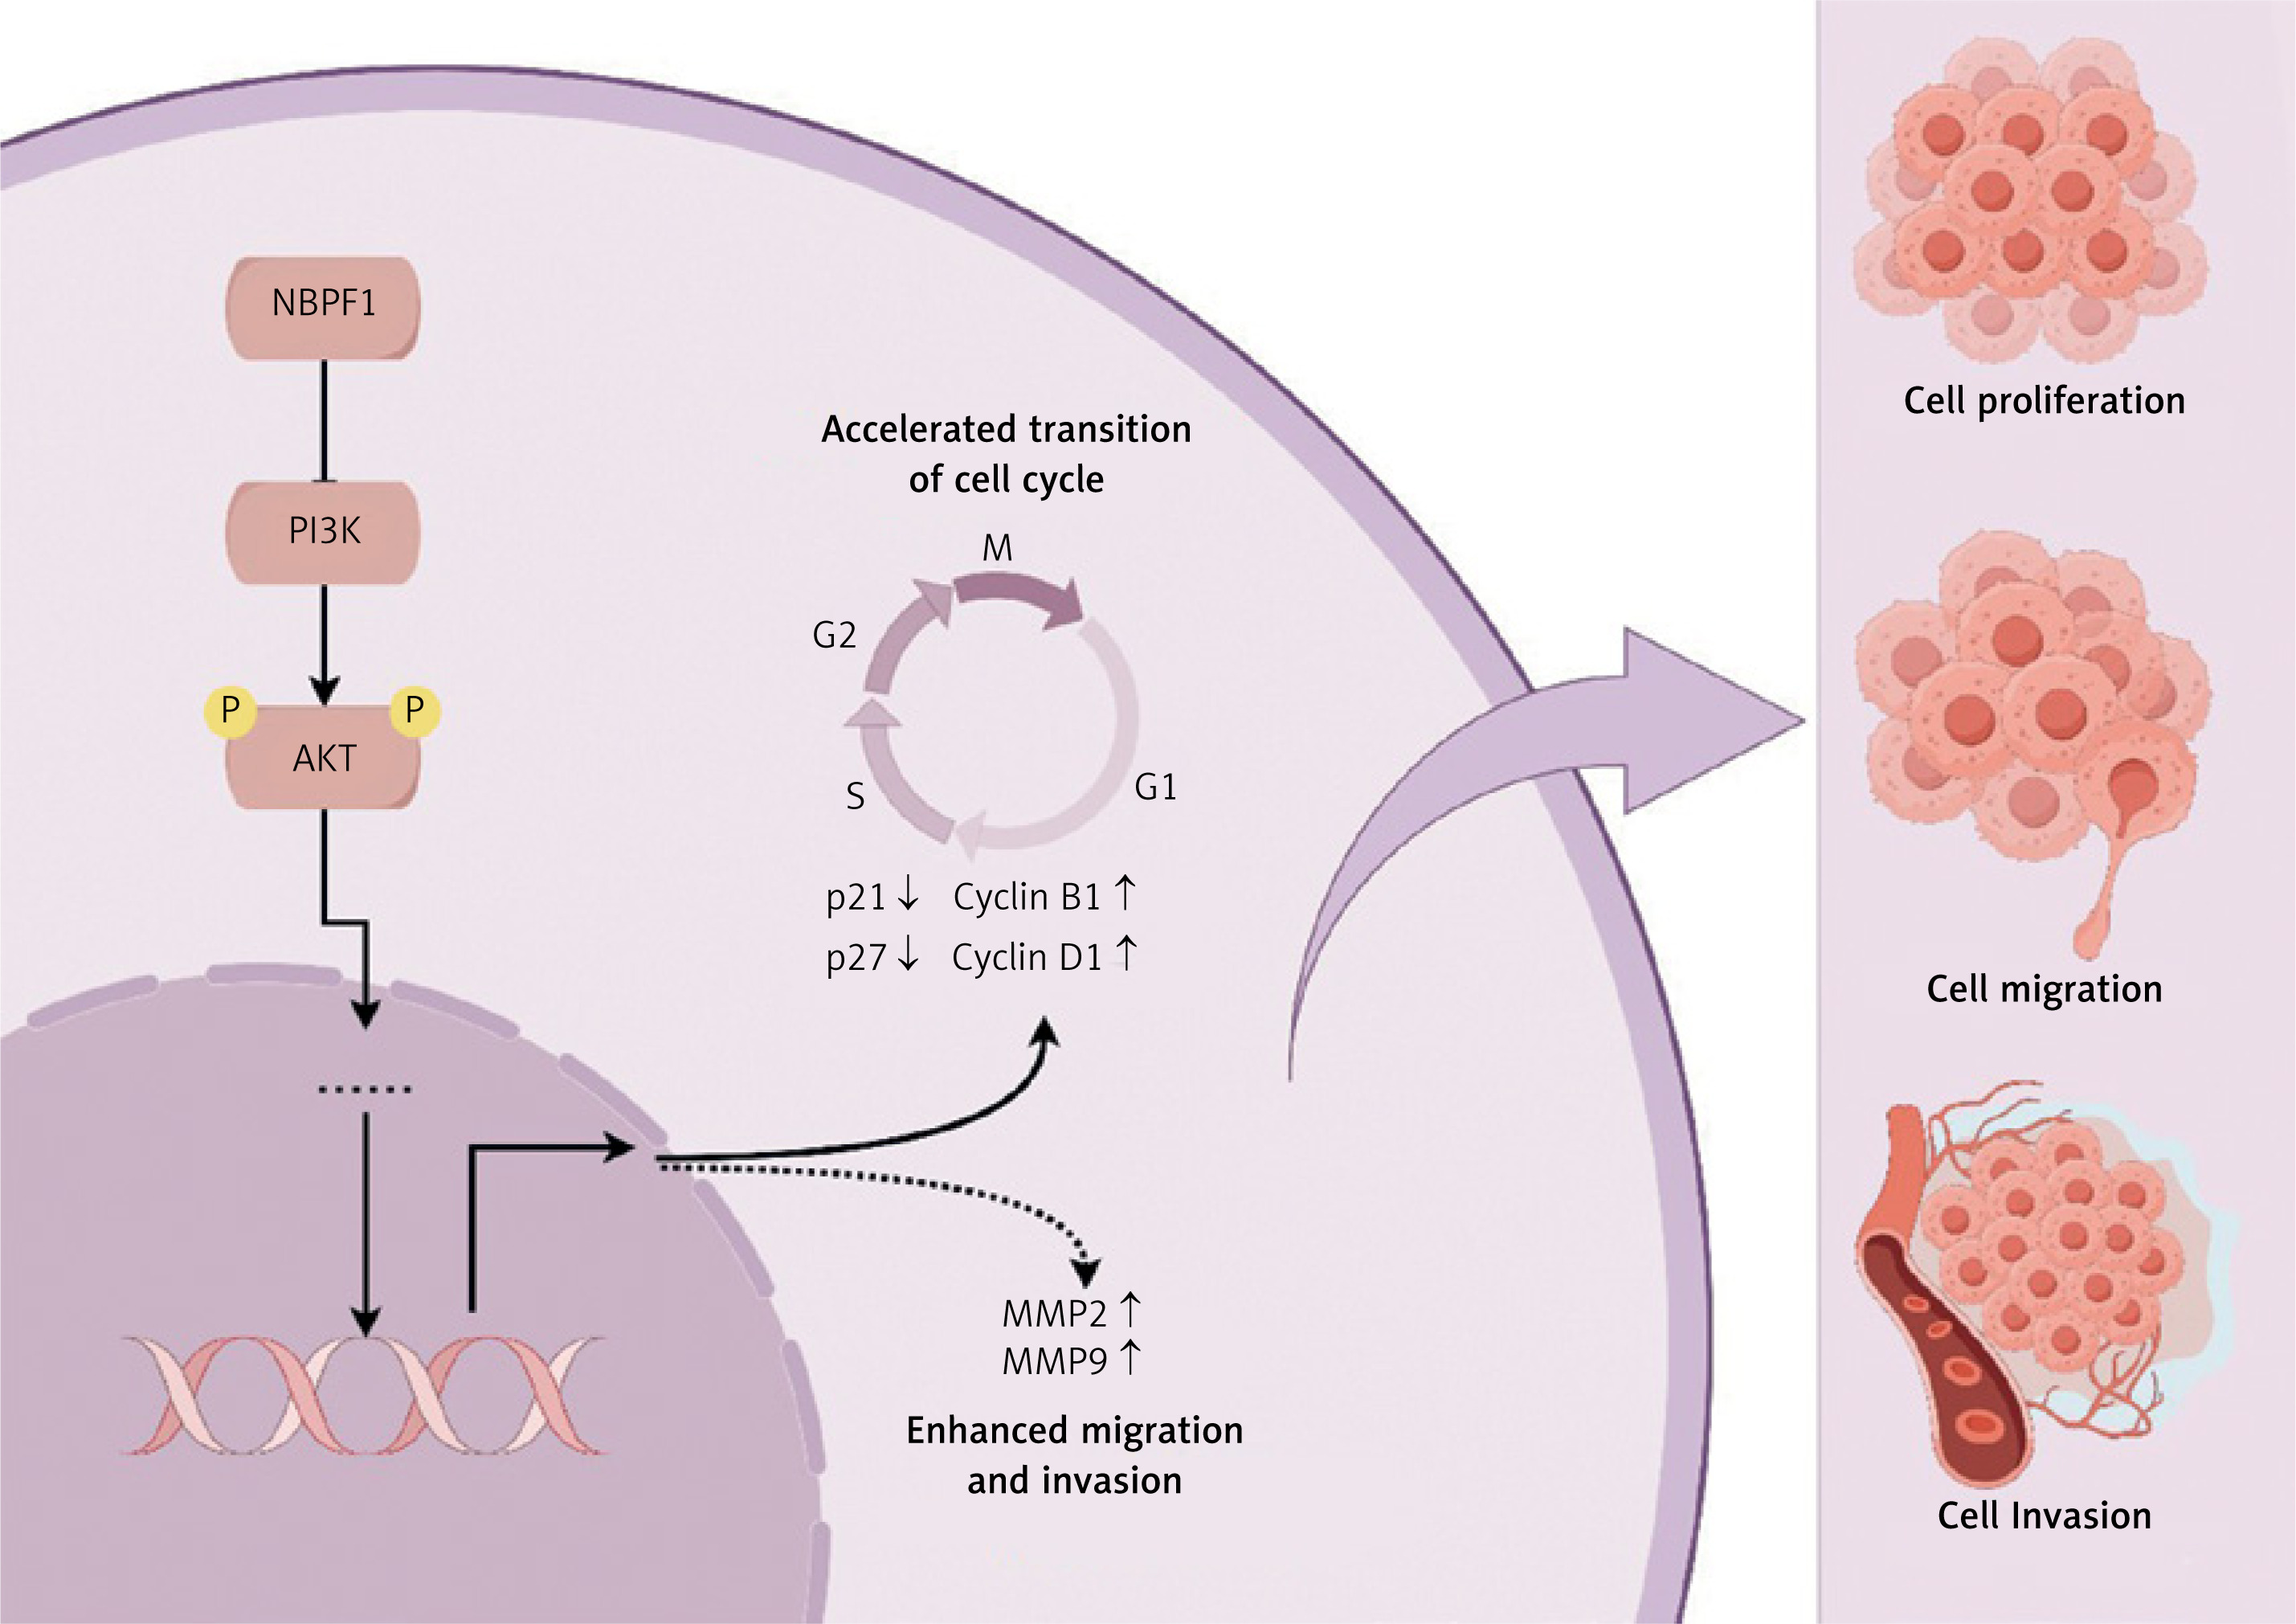
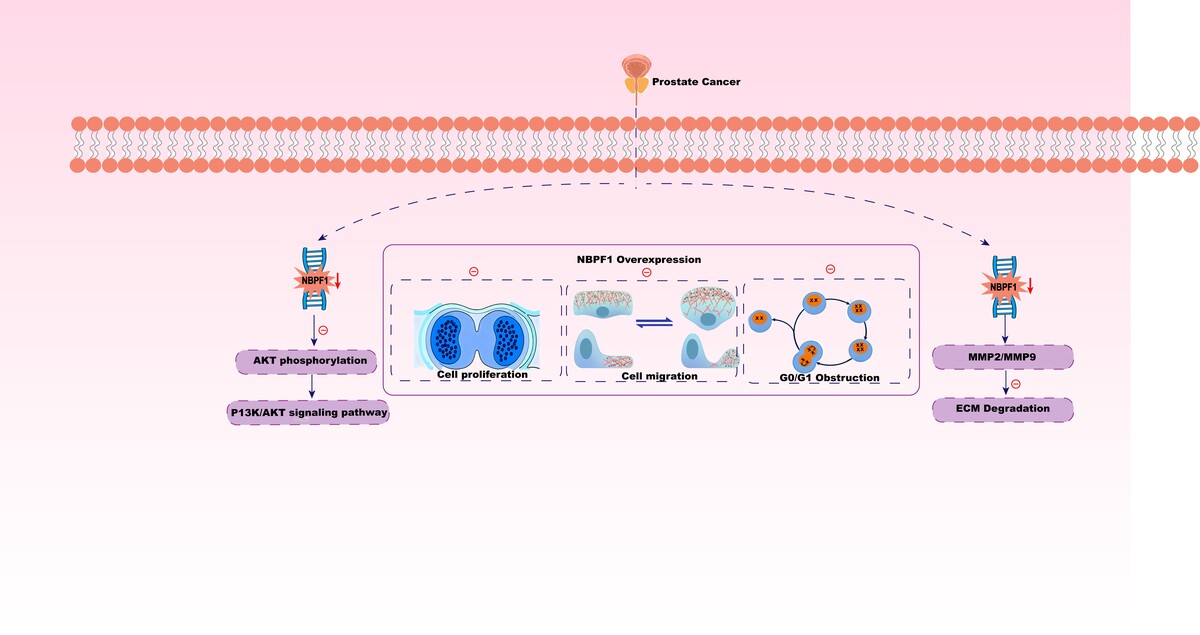
Taken together, our study identifies NBPF1 as a critical tumor suppressor in PCa, with significant effects on proliferative, invasive, and cell cycle processes via modulation of the PI3K/AKT pathway (Figure 8). Subdued NBPF1 levels coincide with rapid progression and a bleak prognosis, promoting the molecule as a dual-purpose clinical guide and therapeutic candidate. This work paves the way for future studies to further elucidate the relevant molecular mechanisms and therapeutic potential of NBPF1 in PCa treatment strategies.