Introduction
Prostate cancer is one of the most common malignant tumors of the urogenital system in middle-aged and elderly men [1, 2]. The latest epidemiological data indicate that prostate cancer ranks as the second most frequently diagnosed cancer and the fifth leading cause of cancer-related deaths among men worldwide, posing a significant threat to male health and longevity [3]. Anatomically, the prostate can be divided into the peripheral zone (PZ), transition zone (TZ), central zone (CZ), and anterior fibromuscular stroma (AFS) [4]. Among these, the PZ is the most common site of prostate cancer, but the incidence of prostate cancer originating from the TZ has also steadily increased in recent years, due to the widespread use of prostate-specific antigen (PSA) screening and prostate needle biopsy [5].
Multiparametric MRI (mpMRI) plays an essential role in the localization, characterization, and risk stratification of prostate lesions. The updated Prostate Imaging Reporting and Data System (PI-RADS v2.1) identifies mpMRI, particularly T2-weighted imaging (T2WI) combined with diffusion-weighted imaging (DWI), as the preferred modality for evaluating prostate cancer [6]. PI-RADS v2.1 has defined T2WI as the dominant pulse sequence for identifying TZ cancers and DWI as the dominant sequence for detecting PZ cancers. However, visual criteria can be highly subjective, reducing reproducibility. In particular, compared with PZ cancers, TZ cancers are often difficult to recognize due to the complex architecture of benign prostatic hyperplasia (BPH) nodules, which can mask or mimic malignancy, commonly found in the TZ on MRI [7, 8]. Similarly, dynamic contrast-enhanced (DCE) MRI has shown contradictory value in detecting TZ cancers across several studies [9, 10]. Studies have evaluated quantitative DCE parameters and found no significant difference between BPH nodules and TZ cancers [9]. Therefore, the current situation regarding the ability of mpMRI alone to distinguish TZ cancer from BPH remains unsettled.
Serum PSA is commonly used to screen for prostate cancer and to monitor the progression of prostate lesions. However, PSA is not cancer-specific, and elevated PSA levels may be due to BPH and prostatitis [11]. A recent meta-analysis found that PSA alone is highly sensitive but poorly specific in detecting prostate cancer, which may result in overdiagnosis and treatment of indolent prostate lesions [12]. PSA density (PSAD), calculated as total PSA level divided by prostate volume, has emerged as a refined biomarker that adjusts PSA concentration according to glandular size. This normalization mitigates the confounding effect of prostate enlargement and enhances the discrimination between benign hyperplasia and malignancy. Lin et al. [13] reported that age, PSA, f/tPSA, prostate volume, and PSAD are all associated with the diagnosis of clinically significant prostate cancer in patients with negative mpMRI, with PSAD being the most accurate predictor at a threshold of ≥ 0.20 ng/ml/ml. Furthermore, PSAD exhibits a strong correlation with tumor aggressiveness. Igor et al. found that PSAD is associated with high risk of clinically significant prostate cancer [14]. Schoots et al. [15] demonstrated that incorporating PSAD with PI-RADS scores in biopsy-naïve men enabled risk-adapted biopsy decisions, improving biopsy avoidance without compromising the detection of clinically significant prostate cancer.
Therefore, we analyzed PI-RADS v2.1 scores and PSAD values of benign and malignant prostatic lesions in the TZ in our hospital between March 2020 and May 2024, to investigate whether the combination of the PI-RADS score and PSAD value could improve the diagnostic accuracy in distinguishing TZ cancer from BPH.
Material and methods
Study population
This study was approved by the Institutional Review Board of Xi’an Jiaotong University with a waiver for informed consent, and all procedures were conducted in strict compliance with the ethical principles outlined in the Declaration of Helsinki (World Medical Association, 2013 revision). From March 2020 to May 2024, 597 patients with prostatic lesions who underwent prostate mpMRI were selected. The exclusion criteria were as follows: (1) lesions in the PZ or with indeterminate zonal origin; (2) TZ lesions with PI-RADS scores of 1-2; (3) patients with a history of treatment for prostate cancer before MRI examination; (4) poor diagnostic quality due to artifacts; (5) absence of pathology results or serum PSA value; (6) suspicious lesions on preoperative MRI were inconsistent with those in RP specimens. In the final cohort, a total of 377 patients were included in the study (mean age: 69.17 ±8.35 years; range: 45–92 years). Patients were further divided into two groups – the TZ cancer group (n = 139) and the BPH group (n = 238) – based on prostate biopsy or radical prostatectomy. TZ cancers were defined as those in which more than 70% of the cancer area was located in the TZ [16].
Prostate MRI protocol
Prostate mpMRI images were acquired using a 3.0T scanner (GE HealthCare, SIGNATM Architect 3.0T) with a pelvic phase-array coil. The sequences included axial T1-weighted imaging (T1WI) (TR/TE 758/16 ms; field of view 340 mm × 340 mm; slice thickness 3 mm); axial T2WI (TR/TE 5376/110 ms; field of view 200 mm × 200 mm; slice thickness 3 mm); and axial DWI (TR/TE 4500/72 ms; field of view 340 mm × 340 mm; slice thickness 3 mm; water excitation with b-values of 0 and 1400 s/mm2). An apparent diffusion coefficient (ADC) map was generated by two-point b values from DWI.
Prostate MRI image analysis
Two radiologists (both with more than 10 years of experience in reading MRI images) were blinded to the final diagnosis and independently analyzed all enrolled prostate MRI images. The two radiologists independently reviewed the prostate MR images of each patient on the PACS workstation and assigned a PI-RADS score (between 1 and 5 based on the PI-RADS v2.1 criteria) to the TZ lesions. In multifocal cases, the index lesion, defined as the lesion showing the highest PI-RADS v2.1 score and/or the largest lesion when scores were identical, was used for analysis. Another genitourinary radiologist with more than 20 years of experience reviewed the images and made the decision in consensus when the former two readers had differences in reading images. In addition, the prostate volume of each case was measured to calculate the PSAD value. The measurements from the two readers were averaged as the final PSAD value for each patient.
Statistical analysis
Statistical analyses were performed using GraphPad Prism (Version 10.0 for Windows, GraphPad Software Inc., San Diego, CA, USA). The normality of data was tested using the Kolmogorov-Smirnov test. Data were expressed as mean ± standard deviation (SD) or median and interquartile range (IQR) according to the normality test. Categorical variables are expressed as counts and proportions. Interobserver agreement for PI-RADS rating and prostate volume measurements between the two radiologists was analyzed by calculating the intra-class correlation coefficient (ICC). Clinical characteristics between the two groups were compared using the χ2 test, t-test, or Mann-Whitney U-test. The diagnostic performance of PI-RADS scores, PSAD values, and their combination was determined by the receiver operating characteristic (ROC) curve analysis. A p-value less than 0.05 denoted a significant difference.
Results
Inter-observer agreement in imaging analysis
The PI-RADS rating and prostate volume measurements showed good inter-observer reproducibility between the two radiologists, with ICC of 0.803 (95% CI: 0.752–0.897) and 0.839 (95% CI: 0.774–0.915), respectively.
Patient characteristics
From the initial data set of 597 patients with prostatic lesions, 220 patients were excluded from the study due to lesions in the PZ or inability to identify the zonal origin (n = 105), TZ lesions with PI-RADS scores of 1–2 (n = 47), patients with a history of treatment for prostate cancer before MRI examination (n = 9), poor diagnostic quality due to artifacts (n = 4), absence of pathology results or serum PSA value (n = 34), and suspicious lesions on preoperative MRI inconsistent with those in RP specimens (n = 21). Finally, a total of 377 patients including 238 with BPH (63.13%) and 139 with TZ cancer (36.87%) were enrolled in the study. Figure 1 shows the preoperative MRI images of the patient with TZ cancer confirmed by targeted transperineal biopsy; the lesion was assigned a PI-RADS score of 4 on preoperative MRI. Figures 2 and 3 show the preoperative MRI images of the patients with BPH; the lesion in Figure 2 was assigned a PI-RADS score of 3, and the lesion in Figure 3 was assigned a PI-RADS score of 5 on preoperative MRI. A comparison of patient characteristics between the two groups based on pathological results is shown in Table I.
Figure 1
72-year-old man with PSA value of 9.37 ng/ml and PSAD value of 0.32 ng/ml/ml. (A) Axial T2WI and (B) sagittal T2WI show a round-like lesion (white arrow) in the right TZ as homogenous, moderately hypointense, and < 1.5 cm in the greatest dimension. C – DWI shows the lesion as focally markedly hyperintense. D – ADC map shows diffusion restriction in the same lesion. The lesion was assigned a PI-RADS score of 4 in prostate MRI and finally pathologically confirmed as prostate cancer in TZ
ADC – apparent diffusion coefficient, DWI – diffusion-weighted imaging, PI-RADS – Prostate Imaging Reporting and Data System, PSA – prostate-specific antigen, PSAD – prostate-specific antigen density, T2WI – T2-weighted imaging, TZ – transition zone.
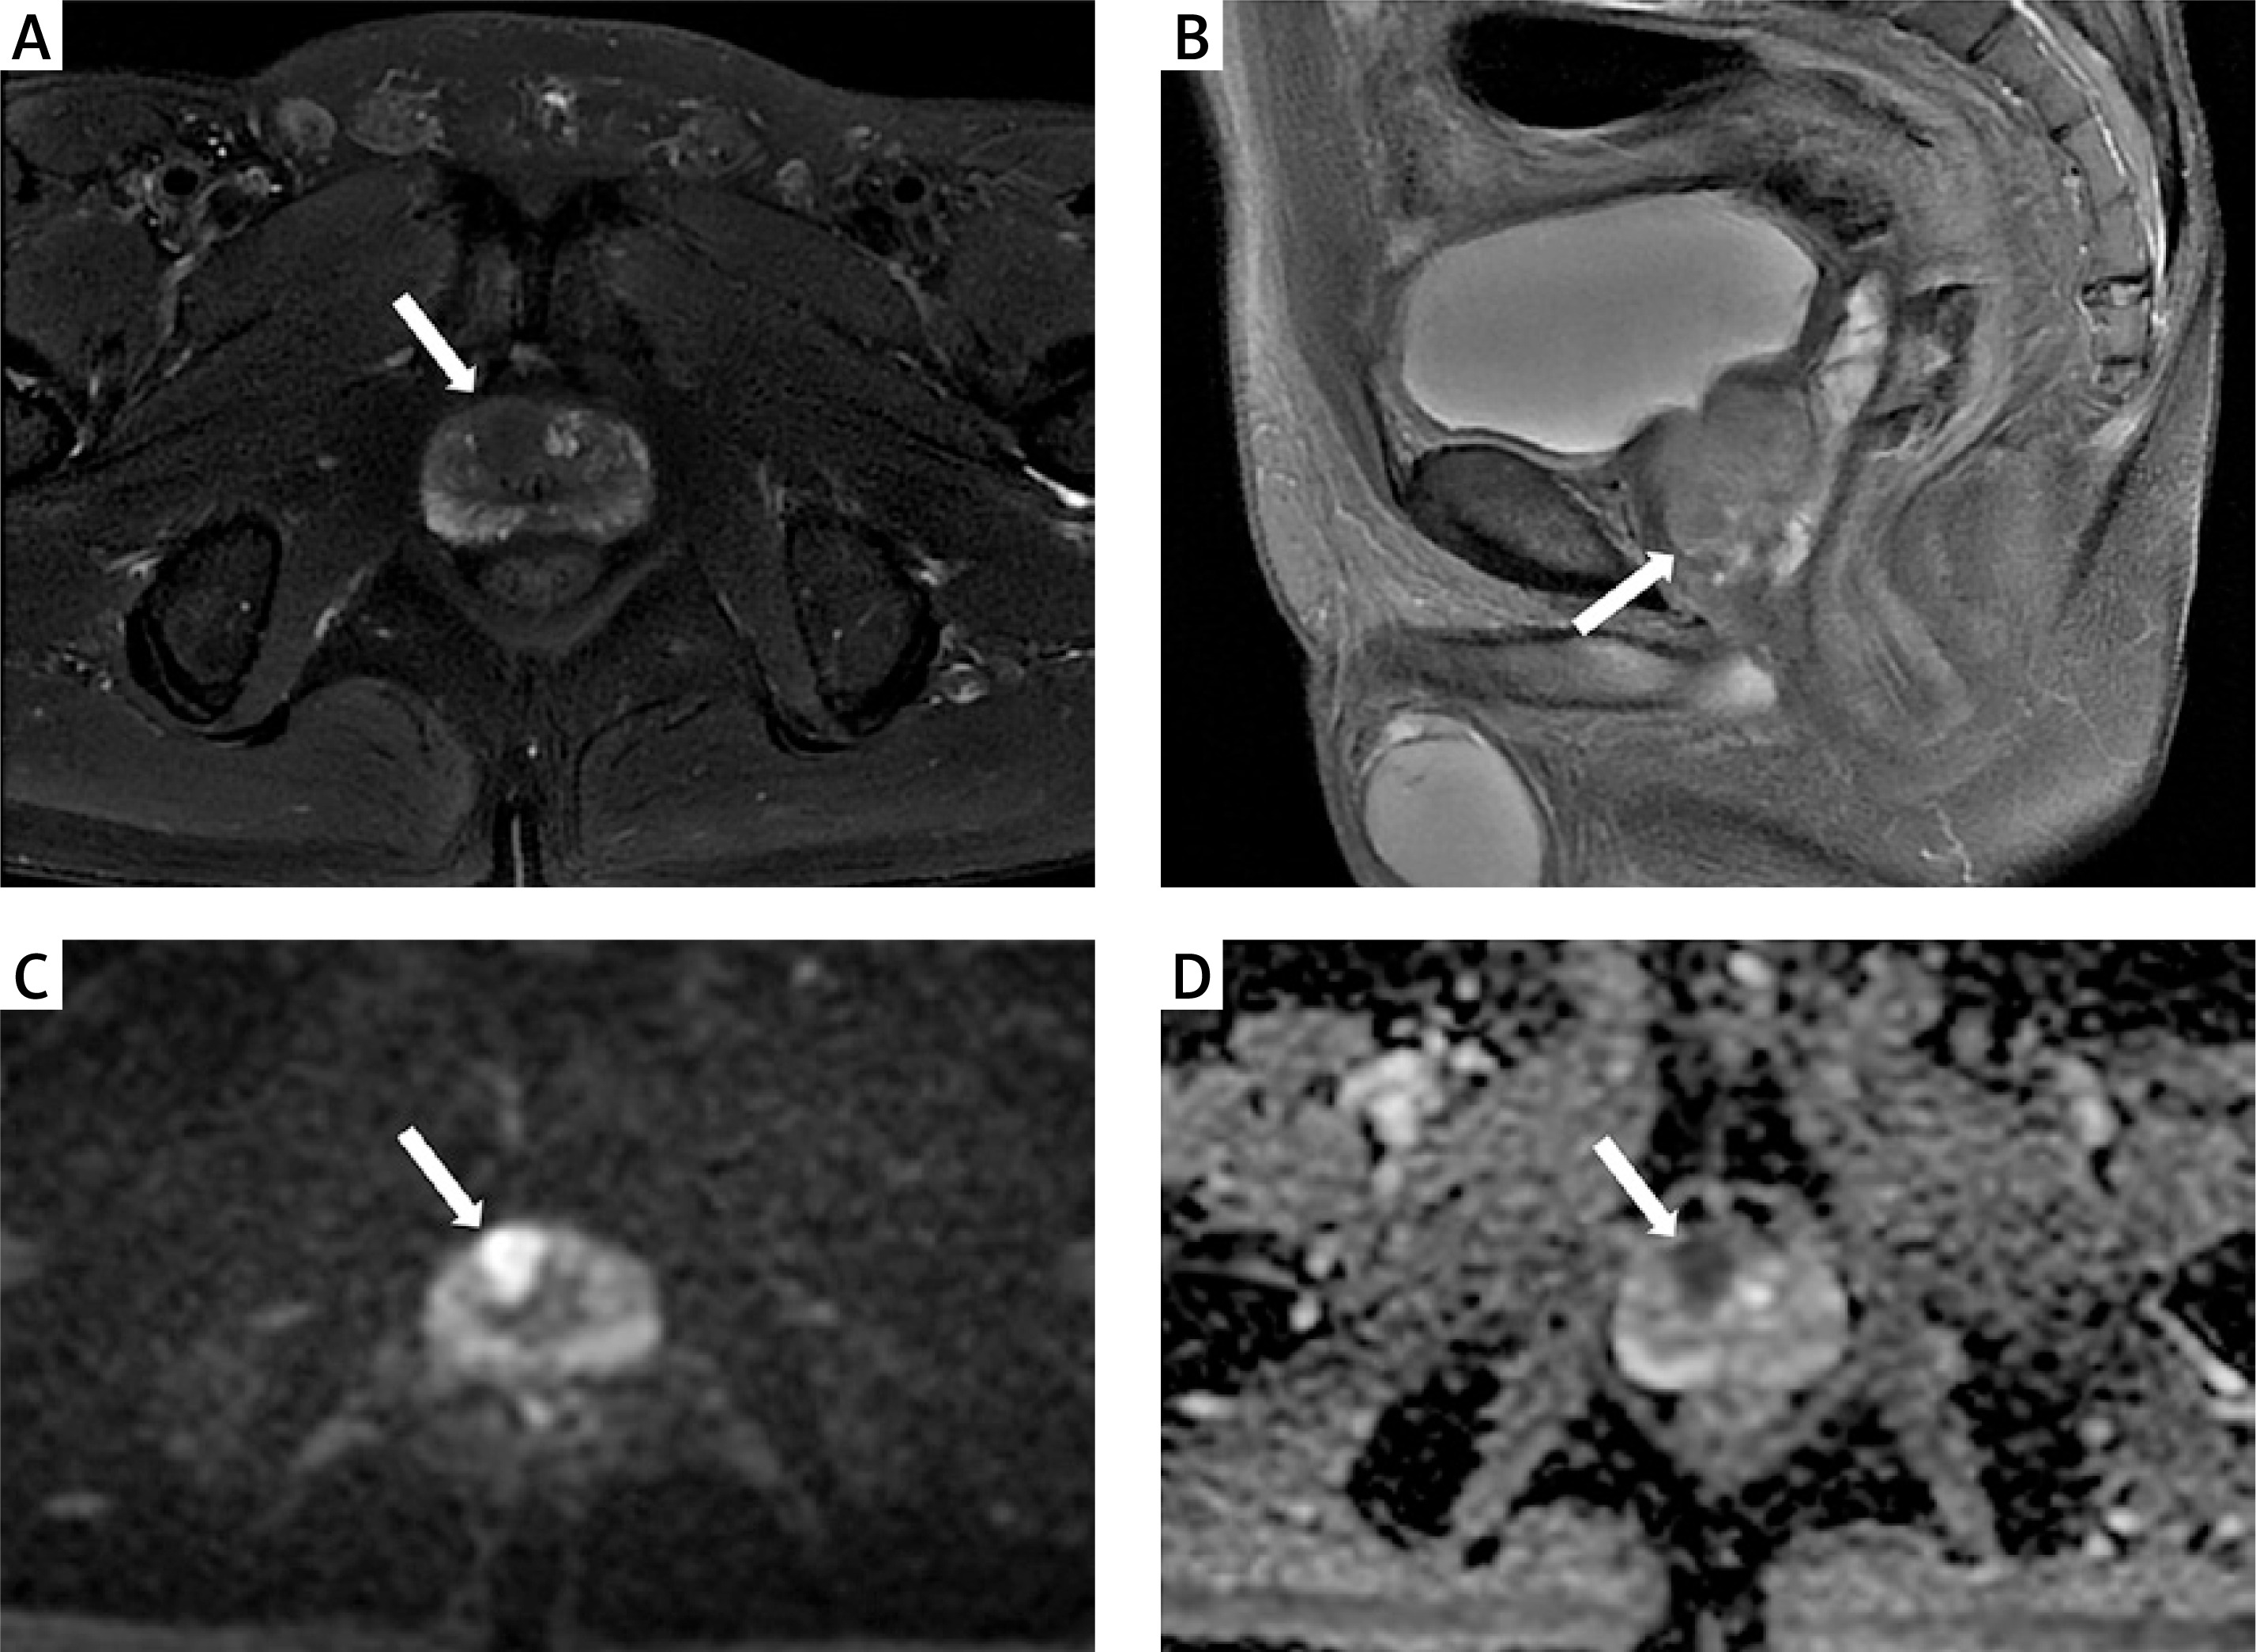
Figure 2
77-year-old man with PSA value of 10.79 ng/ml and PSAD value of 0.08 ng/ml/ml. (A) Axial T2WI and (B) sagittal T2WI show a heterogeneously hypointense focal area (white arrow) in the left TZ with obscured margins. C – DWI shows no clear abnormality on the image. D – The lesion appears mildly hypointense on ADC map (white arrow). The lesion was assigned a PI-RADS score of 3 in prostate MRI and finally pathologically confirmed to be benign (nodular hyperplasia of the prostate gland) in TZ
ADC – apparent diffusion coefficient, DWI – diffusion-weighted imaging, PI-RADS – Prostate Imaging Reporting and Data System, PSA – prostate-specific antigen, PSAD – prostate-specific antigen density, T2WI – T2-weighted imaging, TZ – transition zone.
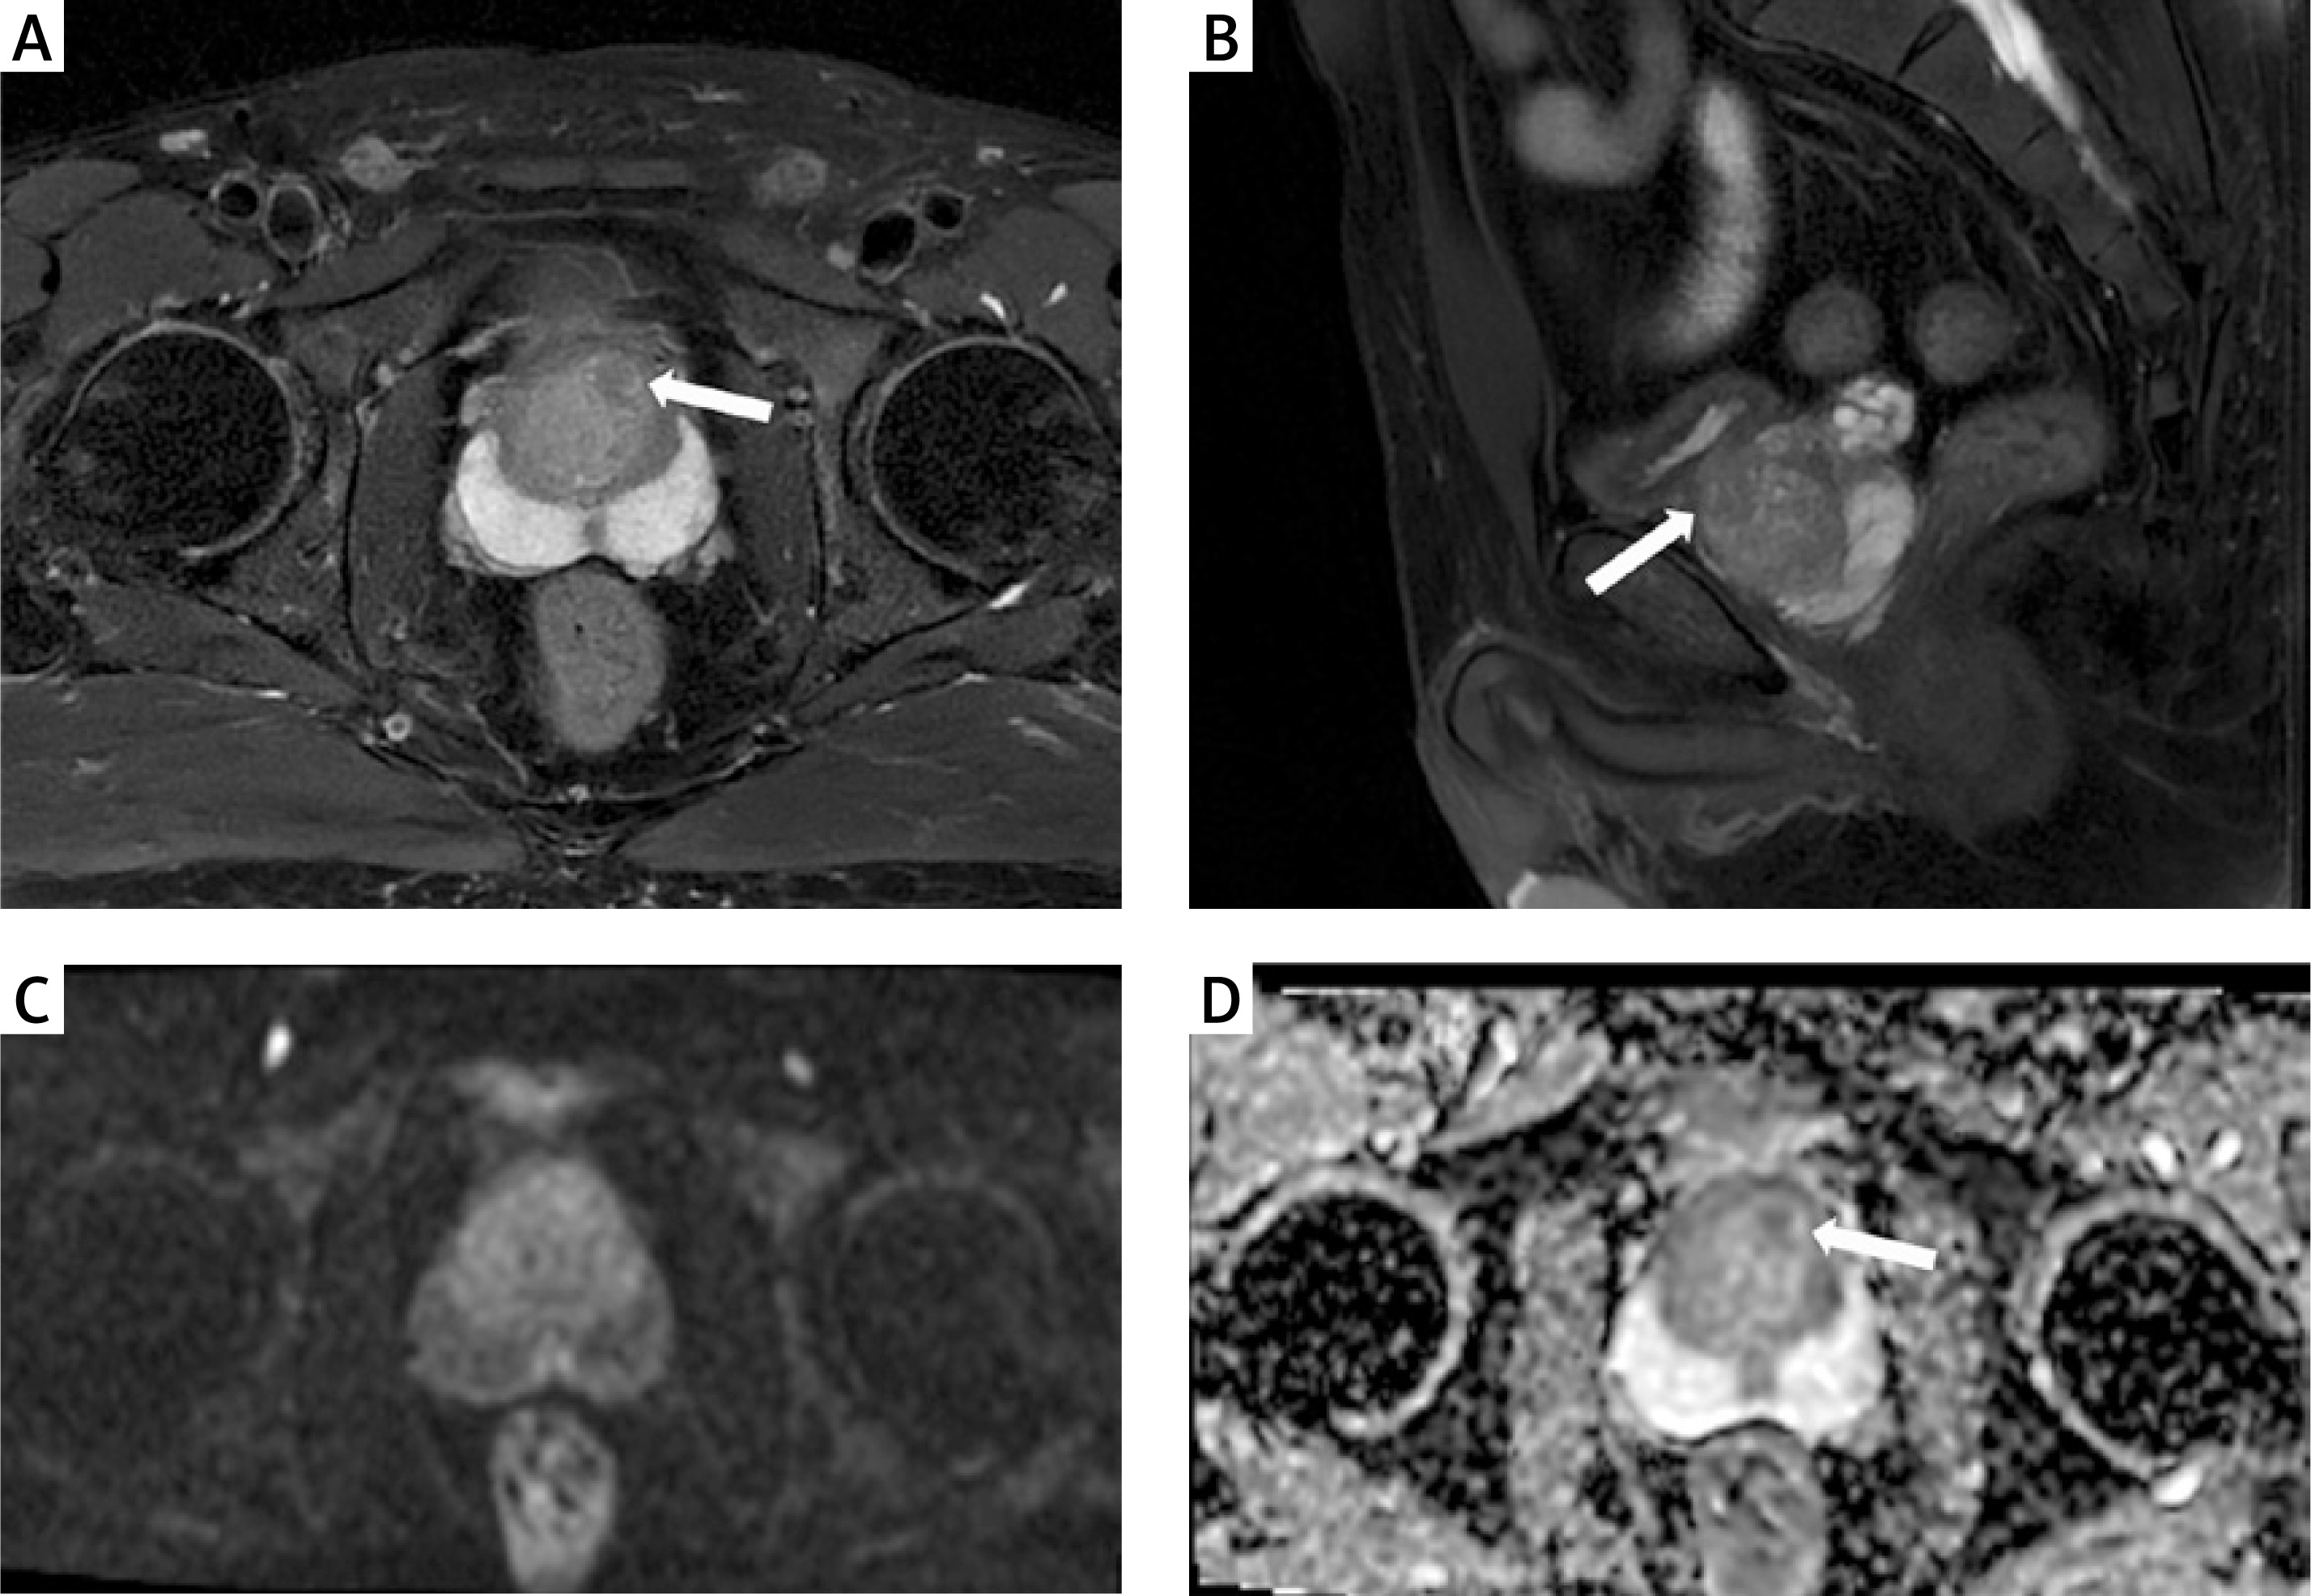
Figure 3
A 74-year-old man with PSA value of 7.40 ng/ml and PSAD value of 0.16 ng/ml/ml. (A) Axial T2WI and (B) sagittal T2WI show a homogeneous, moderately hypointense focal area (white arrow) in the right TZ with > 1.5 cm in the greatest dimension. (C) DWI and (D) ADC map show restricted diffusion in the same lesion (white arrow). The lesion was assigned a PI-RADS score of 5 in prostate MRI and finally pathologically confirmed to be benign (nodular hyperplasia of the prostate gland) in TZ
ADC – apparent diffusion coefficient, DWI – diffusion-weighted imaging, PI-RADS – Prostate Imaging Reporting and Data System, PSA – prostate-specific antigen, PSAD – prostate-specific antigen density, T2WI – T2-weighted imaging, TZ – transition zone.
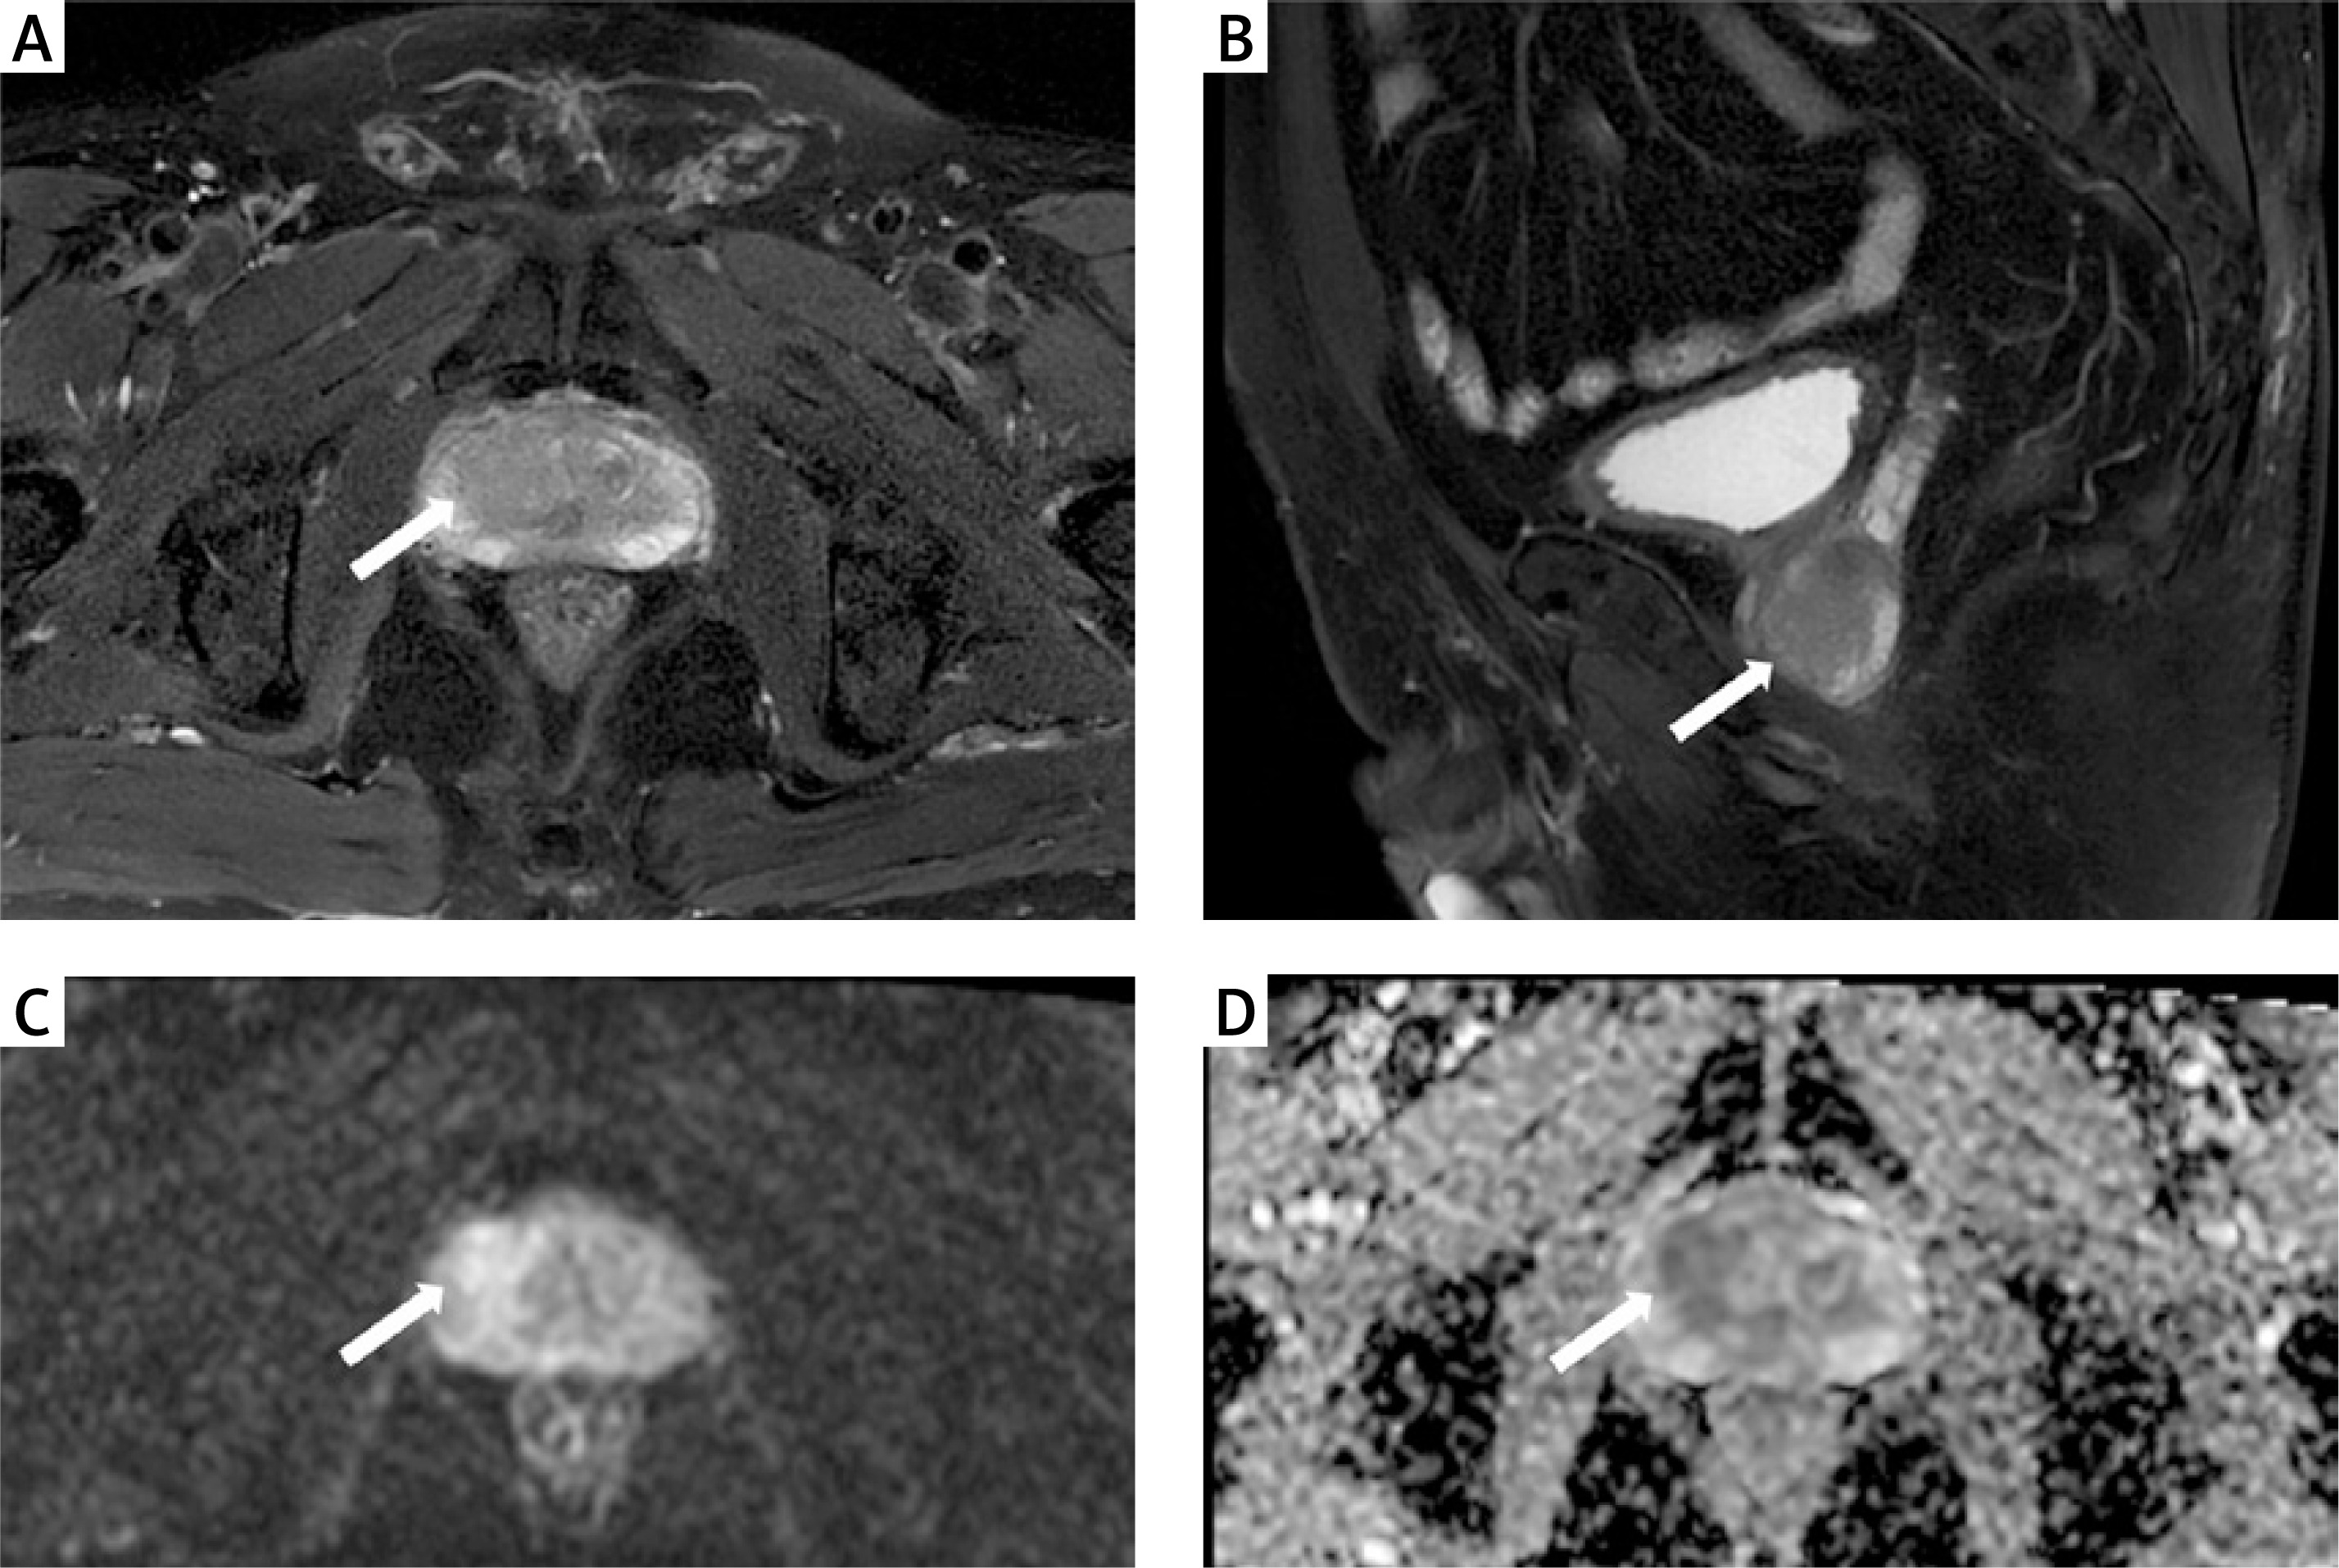
Table I
Comparisons of patients’ characteristics between BPH group and TZ cancer group
Diagnostic performance of PI-RADS v2.1 and PSAD for TZ cancer
Figure 4 shows the ROC curve used to find out the sensitivity and specificity of parameters including PSAD value, PI-RADS score, and PI-RADS score combined with PSAD value. The area under the curve (AUC) of the PI-RADS score for distinguishing TZ cancer from BPH was 0.802 (95% CI: 0.759–0.841), and the cutoff value was ≥ 4, with a sensitivity of 79.14% (95% CI: 71.4–85.6%) and a specificity of 74.37% (95% CI: 68.3–79.8%). Using a PI-RADS score ≥ 3 as the cutoff increased sensitivity to 96.33% (95% CI: 88.5–99.1%), but specificity dropped sharply to 32.57% (95% CI: 29.4–47.9%). When a PI-RADS score of 5 was used as the cutoff, specificity significantly increased to 98.32% (95% CI: 95.8–99.5%), while sensitivity decreased to 32.37% (95% CI: 24.7–40.8%).
Figure 4
ROC curve for PSAD value, PI-RADS score and the combination with AUC
AUC – area under the curve, PI-RADS – Prostate Imaging Reporting and Data System, PSAD – prostate-specific antigen density, ROC – receiver operating characteristic
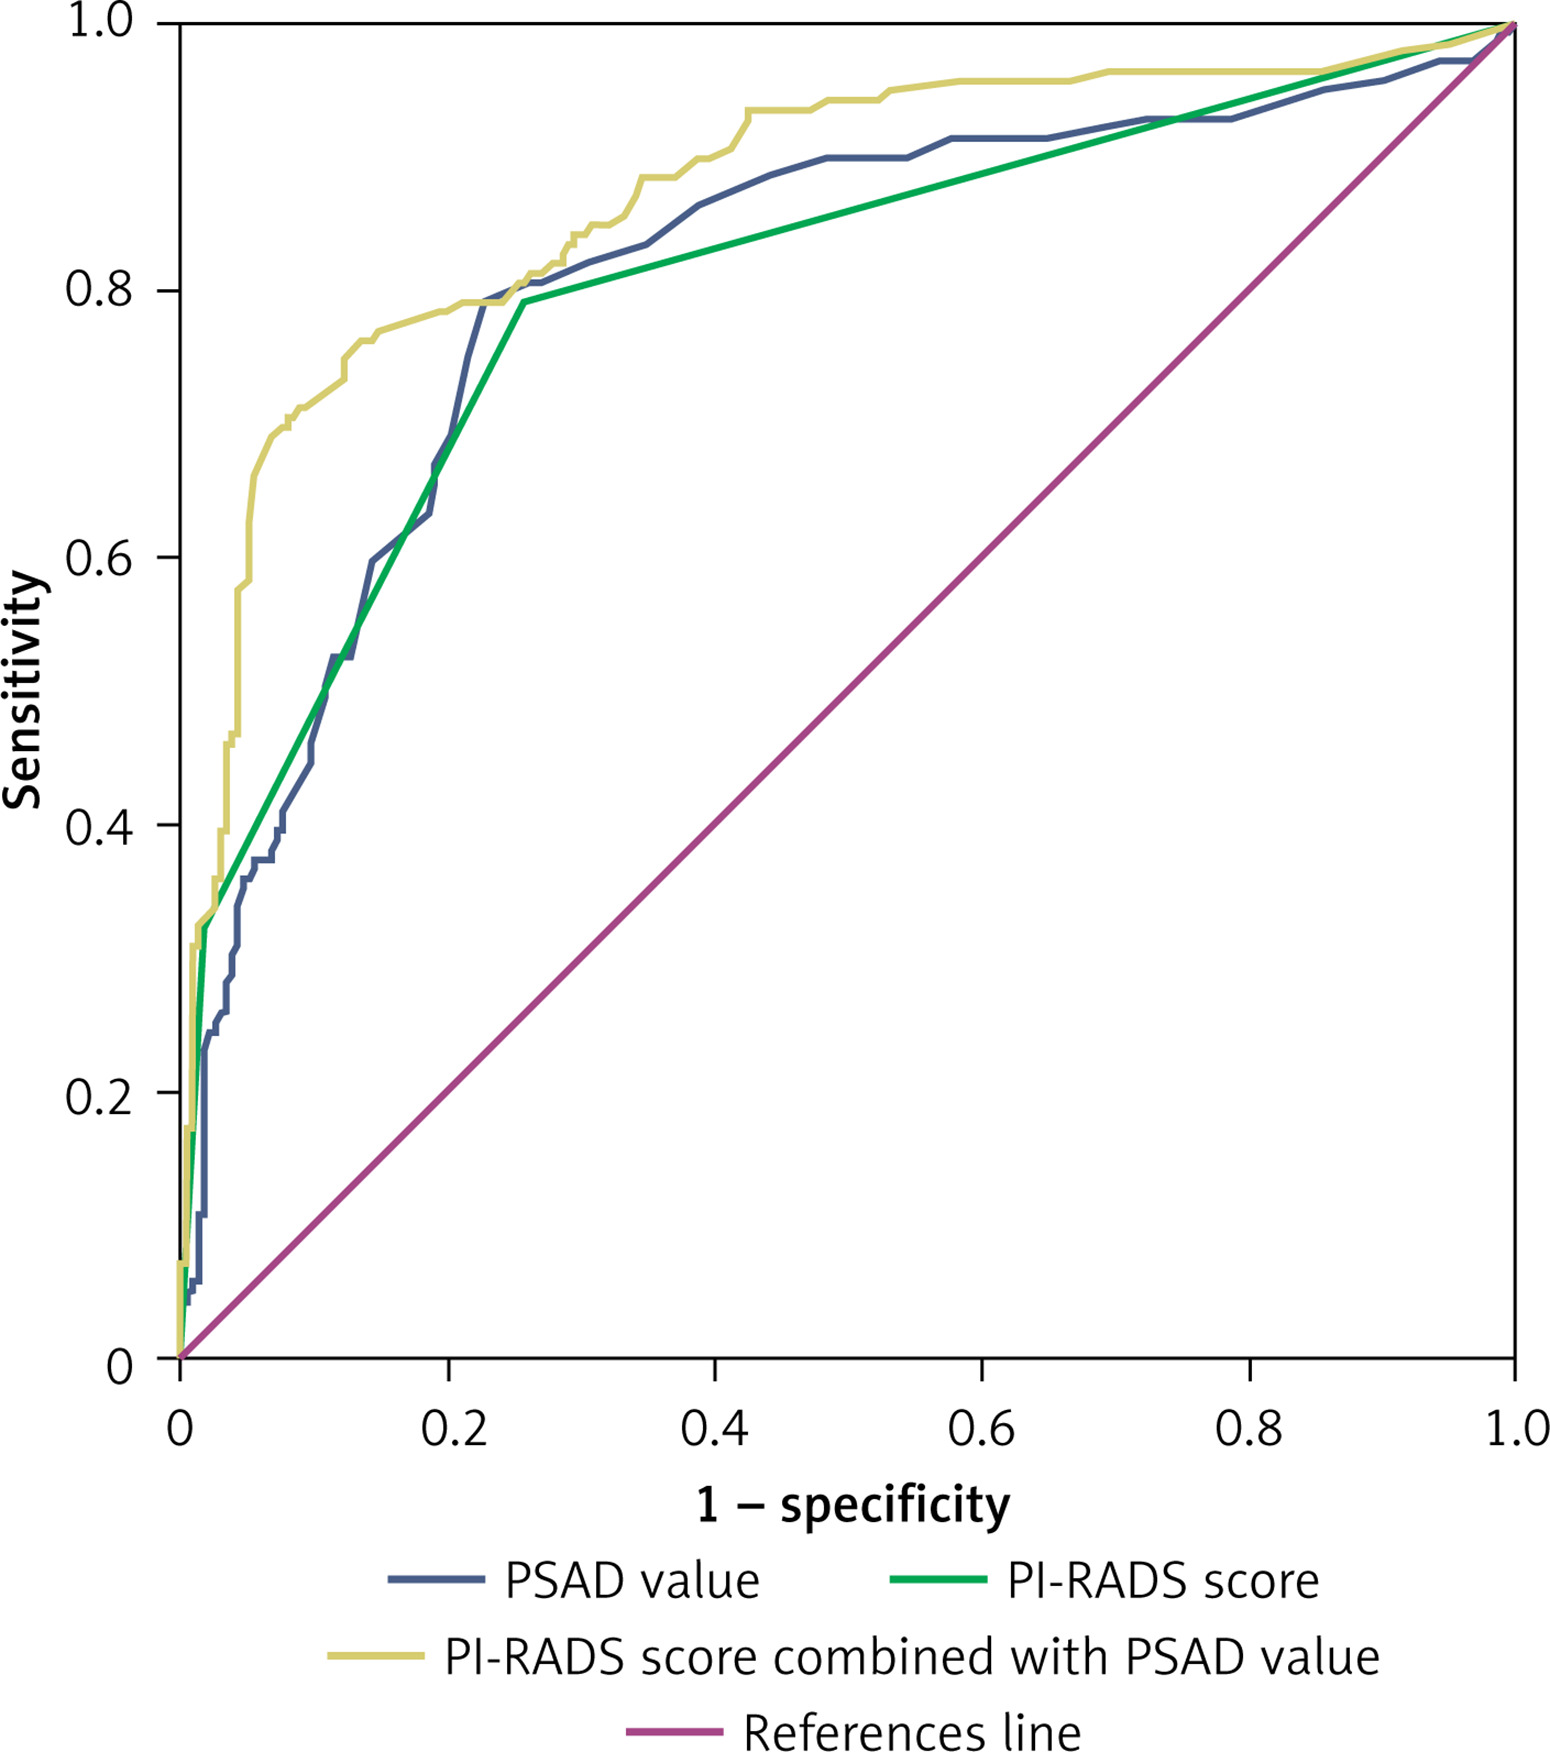
The AUC of PSAD for TZ cancer was 0.808 (95% CI: 0.765–0.847), and the optimal cutoff value was 0.22 ng/ml/ml, at which the sensitivity and specificity were 79.14% (95% CI: 71.4–85.6%) and 77.31% (95% CI: 71.5–82.5%), respectively. Using 0.15 ng/ml/ml as the threshold, the corresponding sensitivity and specificity were 86.33% (95% CI: 79.5–91.6%) and 61.34% (95% CI: 54.8–67.6%), respectively. At this cutoff, the specificity showed a significant decrease. Combining PSAD and PI-RADS yielded a sensitivity of 79.26% (95% CI: 70.6–84.9%), specificity of 86.55% (95% CI: 81.6–90.6%), and an AUC of 0.873 (95% CI: 0.835–0.905). The combination of the PI-RADS score and PSAD value showed higher diagnostic performance compared with the PI-RADS score or PSAD alone (p < 0.0001).
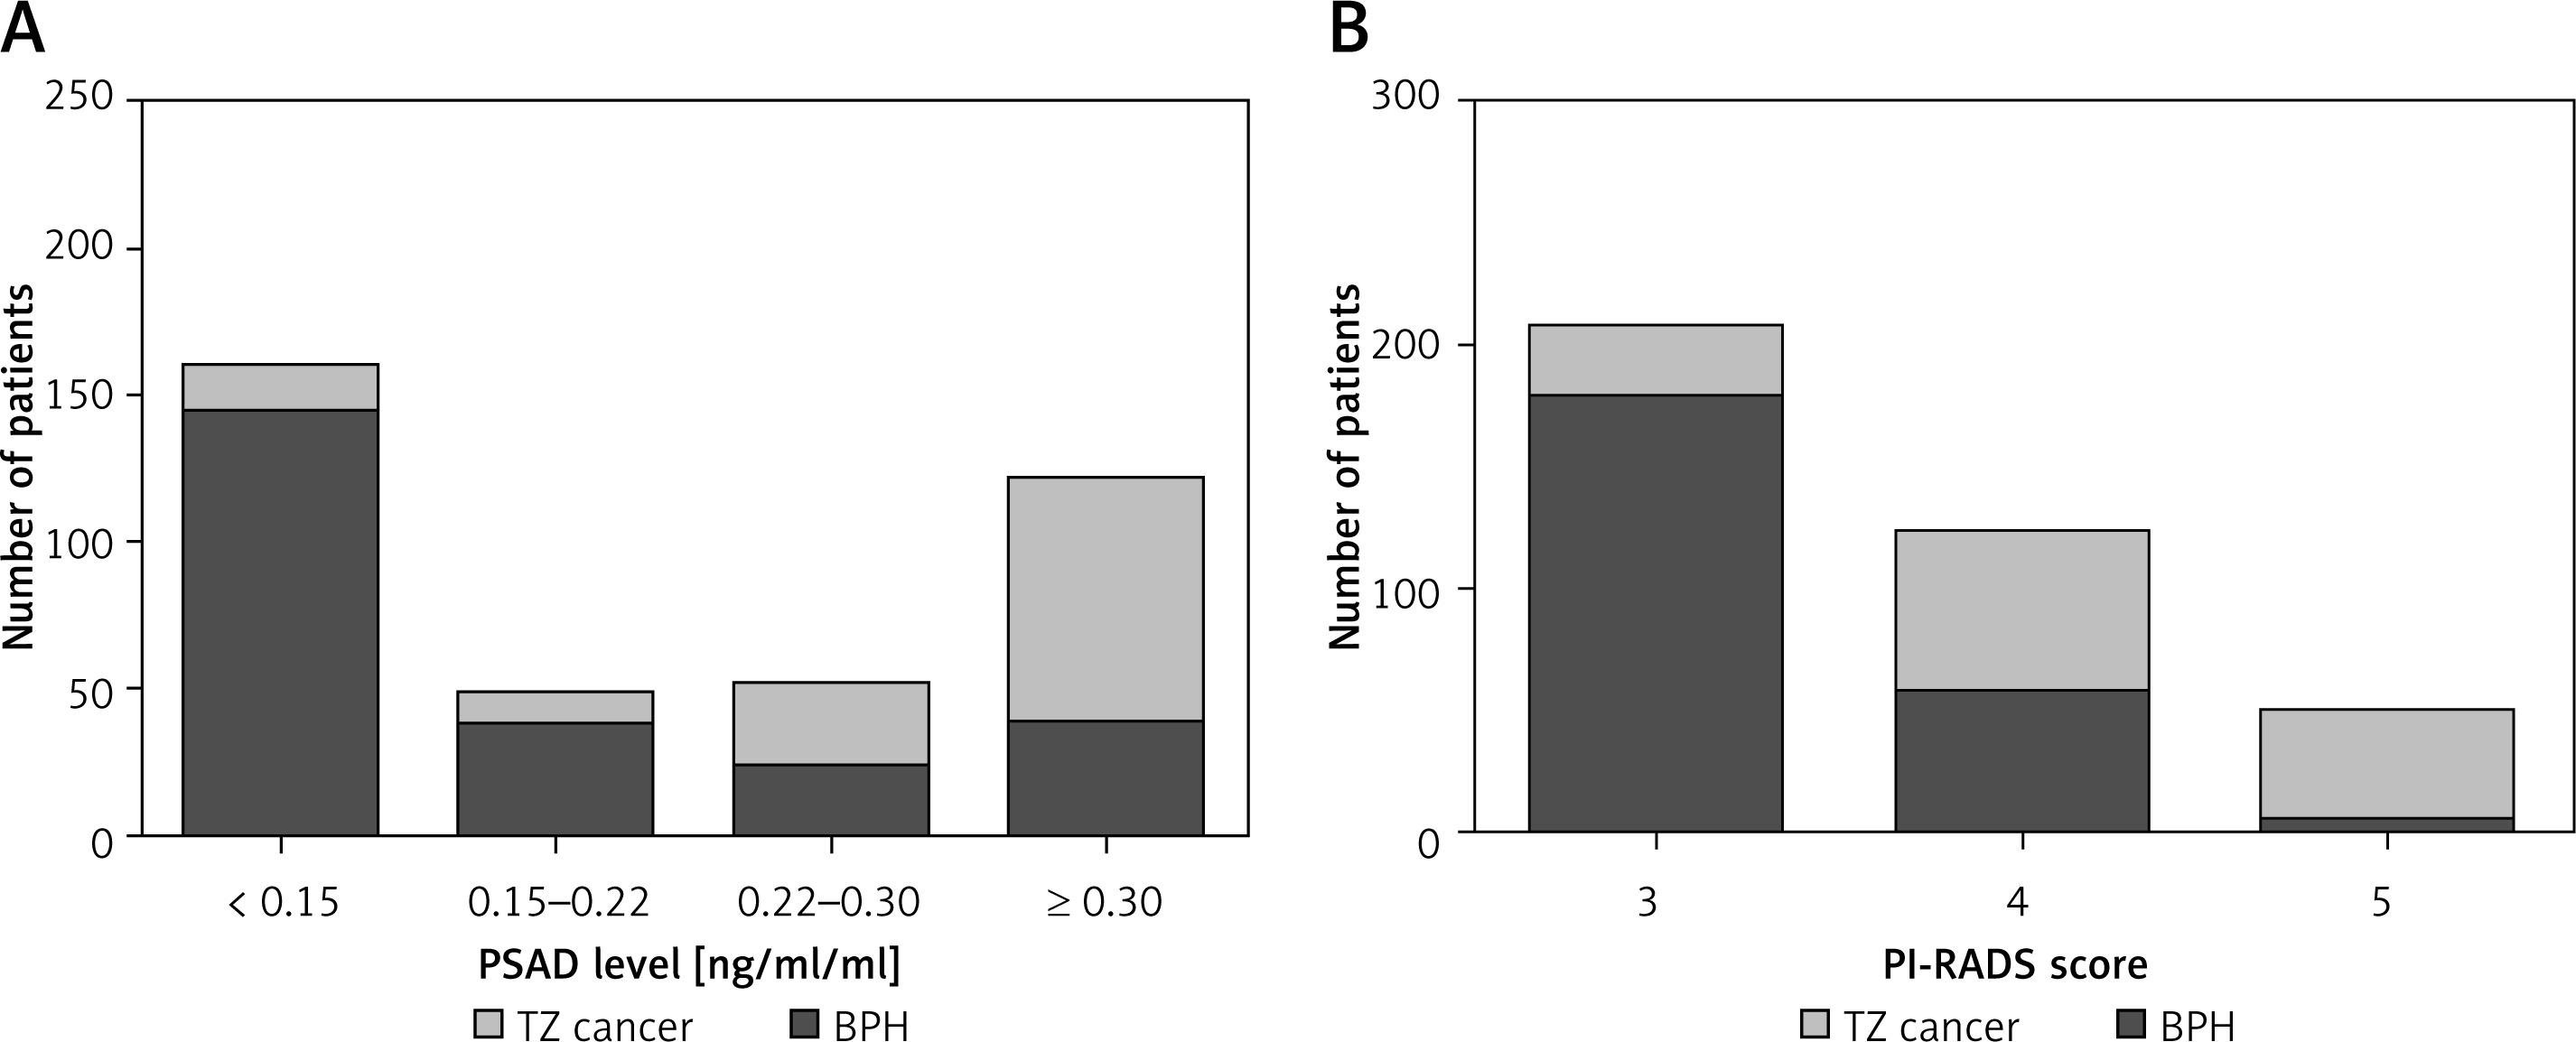
According to the PSAD cutoff values above, the study population was further divided into four groups: PSAD < 0.15, 0.15 ≤ PSAD < 0.22, 0.22 ≤ PSAD < 0.30, PSAD ≥ 0.30 ng/ml/ml. As shown in Table II, 143 patients were diagnosed with BPH and 16 with TZ cancer at PSAD < 0.15 ng/ml/ml; 36 patients with BPH and 11 with TZ cancer at PSAD 0.15 to 0.22 ng/ml/ml; 22 patients with BPH and 28 with TZ cancer at PSAD 0.22 to 0.30 ng/ml/ml; and 37 patients with BPH and 84 with TZ cancer at PSAD ≥ 0.30 ng/ml/ml. The distribution of BPH and TZ cancer across different PSAD ranges is presented in Figure 5 A. The distribution of BPH and TZ cancer according to the PI-RADS score is shown in Figure 5 B.
Table II
Distribution of BPH and TZ cancer across different ranges of PSAD levels
Figure 5
A – Distribution of BPH and TZ cancer across different ranges of PSAD levels. B – Distribution of BPH and TZ cancer according to PI-RADS score
BPH – benign prostatic hyperplasia, PI-RADS – Prostate Imaging Reporting and Data System, PSAD – prostate-specific antigen density, TZ – transition zone.
Discussion
In this study, we found that both PI-RADS and PSAD values could provide specific evaluation of TZ cancer risk. The diagnostic accuracy of PI-RADS scores, PSAD, and their combination were high, with AUCs of 0.802, 0.808 and 0.873, respectively. The combination of PI-RADS scores and PSAD significantly improves the diagnostic accuracy in distinguishing TZ prostate cancer from BPH.
The PI-RADS v2.1 system is a useful framework for assessing the likelihood of prostate cancer based on mpMRI findings, with an emphasis on T2WI and DWI. However, the inherent subjectivity of PI-RADS v2.1 in interpreting mpMRI limits the diagnostic accuracy and affects management decisions. For example, a PI-RADS score of 3, indicating a moderate likelihood of cancer, can often cause uncertainty regarding the need for biopsy for urologists, particularly in TZ. The complex architecture of BPH resulting from new glandular or stromal growth can obscure the presence of TZ cancers, leading to misinterpretation of MRI results.
In addition, serum PSA increases with aging in parallel to the increase in volume of benign prostatic tissues [17]; thus PSAD, which adjusts PSA levels for prostate volume, has been demonstrated to be a better predictor of prostate cancer than PSA alone. In a cohort study [18], researchers compared PSA and various prostate volume-related factors and found that PSAD may inform biopsy decisions as the best predictor of prostate cancer when transrectal ultrasonography findings are ambiguous in patients with a PSA level of 2.5–20.0 ng/ml. Furthermore, Wen et al. [19] evaluated the diagnostic accuracy of PI-RADS and PSAD for clinically significant prostate cancer with PSA levels of 4–10 ng/ml; the results demonstrated that a combination of the two parameters could significantly improve the diagnostic performance compared with each parameter alone. In our study, the AUC for PI-RADS v2.1 alone was 0.802, with sensitivity of 79.14% and specificity of 74.37% at a cutoff value of ≥ 4. The AUC for PSAD alone was 0.808, with sensitivity of 79.14% and specificity of 77.31% at a cutoff value of 0.22 ng/ml/ml. Combining PI-RADS and PSAD value yielded an AUC of 0.873, with sensitivity of 79.26% and specificity of 86.55%. This dual-parameter model outperformed PI-RADS or PSAD alone. These findings were consistent with prior studies emphasizing the limitations of mpMRI in differentiating benign lesions from malignant tumors due to overlapping imaging features, as well as the poor specificity of PSA alone in prostate cancer screening. However, previous studies usually focused on prostate lesions without taking into account the zonal origins of these lesions within the prostate. Liu et al. [20] assessed the diagnostic performance of the PI-RADS score and ADC value in TZ cancer. However, these two parameters were exclusively based on evaluation of subjective imaging features and comparison of quantitative imaging parameters in MRI, lacking an evaluation of clinical diagnostic biomarkers. Wei et al. [21] demonstrated the significance of combining PI-RADS v2.1 and PSAD in enhancing the diagnostic performance for prostate cancer in the TZ. The findings were similar to our study, which focused on evaluating the application of PI-RADS v2.1 in conjunction with PSAD to differentiate TZ cancer from BPH, aiming to optimize clinical decision-making and reduce unnecessary biopsies. Our study provides a relatively straightforward clinical tool to enhance the diagnostic accuracy of TZ cancer and to facilitate the intuitive assessment of related parameters in everyday clinical practice. Considering the increased complexity in differentiating benign from malignant lesions within the TZ where BPH nodules often mimic malignancy, our study investigated the diagnostic efficacy of MR imaging features with a biomarker adjusted for prostate volume for TZ cancer.
Our results also showed that PSAD ≥ 0.30 ng/ml/ml was strongly associated with malignancy (60.43% TZ cancers), whereas PSAD < 0.15 ng/ml/ml predominantly corresponded to BPH (60.08%). A PSAD threshold of 0.15 ng/ml/ml is exactly at the commonly recommended level to identify patients with negative prostate MRI who should proceed to a prostate biopsy [22]. This stratification suggests that PSAD thresholds could refine clinical decision-making, particularly in cases with equivocal PI-RADS scores (e.g., PI-RADS 3). Similarly, the higher prevalence of TZ cancers among PI-RADS 4-5 lesions (79.14% sensitivity at PI-RADS ≥ 4) underscores the utility of PI-RADS v2.1 in risk stratification. However, the modest specificity of PI-RADS ≥ 4 (74.37%) emphasizes the need for adjunct biomarkers like PSAD to reduce unnecessary biopsies. Our results confirmed that PSAD enhances specificity by mitigating confounding factors such as BPH-related PSA elevation.
The synergistic effect of combining PI-RADS and PSAD values likely stems from their complementary diagnostic strengths. This dual-parameter model addresses the inherent limitations of mpMRI in the TZ, where BPH nodules often mimic malignancy due to stromal heterogeneity and glandular compression. Furthermore, the improved specificity of the combined model (86.55%) may reduce overdiagnosis of indolent lesions, consistent with current trends toward personalized risk-adapted management.
This study has several limitations. First, the exclusion of PI-RADS 1-2 lesions and reliance on a single-center retrospective design may limit generalizability. Second, inter-reader variability in PI-RADS scoring, though mitigated by consensus review, remains a concern in clinical practice. Third, the study did not evaluate the impact of other biomarkers, such as the percent free PSA or prostate health index, which could further refine diagnostic pathways. Future multicenter prospective studies incorporating diverse populations and biomarkers are needed to validate these findings and optimize cutoff values for PSAD and PI-RADS integration.
In conclusion, the combination of the PI-RADS score and PSAD offers an effective strategy to enhance diagnostic confidence in TZ prostate cancer. By combining imaging features with a biomarker adjusted for prostate volume, clinicians can better discriminate aggressive malignancies from benign lesions, ultimately reducing unnecessary invasive procedures and improving patient outcomes. This approach aligns with the growing emphasis on precision medicine in prostate cancer diagnostics and warrants further exploration in broader clinical settings.