Introduction
Overweight and obesity are considered epidemics of modern times [1]. The World Health Organization (WHO) has drawn attention to the significant increase in the number of obese adults, with the percentage of people living with obesity doubling between 1990 and 2022, reaching 16% of the global adult population in 2022 [1]. Obesity is a chronic disease caused by the accumulation of excessive amounts of adipose tissue caused by a disturbance in the body’s energy homeostasis [2–4].
One of the basic criteria for diagnosing obesity is calculating the body mass index (BMI); additionally, waist circumference (WC) measurement determines abdominal (central) obesity [1–5]. It should be, however, noted that the BMI value itself is not an ideal parameter defining obesity, because it does not refer to the composition of body mass and fat tissue content in the body. Due to this fact, not all obese individuals, according to BMI, will have an increased risk of developing cardiometabolic complications [6]. According to current knowledge, global cardiometabolic risk factors include features of metabolic syndrome and a pro-inflammatory state associated with adipose tissue dysfunction, which promotes the development of insulin resistance in tissues [7]. To consider the above dilemmas, categories of metabolic health are increasingly used [7]. We can categorize obese individuals who, despite their excess body weight, do not show any symptoms of metabolic disorders, i.e., metabolically healthy individuals living with obesity (MHO), and those living with obesity with defined metabolic disorders, i.e., metabolically unhealthy obese (MUO). Studies indicate that among MHO patients, there is a potentially lower risk of developing cardiovascular diseases and associated lower mortality compared to MUO [7, 8].
Metabolic syndrome (MetS) is widely recognized as a disease of civilization in the 21st century. According to the established criteria diagnostic, the main criterion for diagnosing MetS is obesity and the presence of at least two of the following three disorders: increased blood pressure, abnormal glucose metabolism, or increased non-HDL cholesterol concentration (i.e., atherogenic dyslipidemia) [6]. It should be noted that adverse environmental factors, including a sedentary lifestyle and work, low physical activity, and an improper diet, often based on a high-energy diet rich in simple sugars and saturated fatty acids, may contribute to obesity and MetS [9–11]. Available studies indicate that obesity or MetS may contribute to vascular endothelial dysfunction and thus to the development of atherosclerosis and consequently other cardiovascular diseases (CVDs). Metabolic disorders accompanying MetS are associated with excessive oxidative stress and the observed reduced mechanisms of the body’s antioxidant protection, which may lead to excessive shortening of the length of telomeres in cells [12, 13].
Telomeres are considered nucleoprotein complexes located at the ends of chromosome arms, which are responsible for maintaining genome stability by, among other things, protecting chromosome ends from degradation, enabling cellular repair systems to recognize correct and damaged chromosome ends, and also enabling the regulation of transcription of genes located near them [14]. Additionally, they protect chromosomes from fusion, thus ensuring the correct course of the recombination process. Telomeres comprise several thousand highly conserved repeating nucleotide motifs, the so-called 5ʹ-TTAGGG-3ʹ repeats, and the protective protein complex shelterin. This complex and proteins involved in chromatin remodeling protect the ends of chromosomes [14, 15]. Telomere length (TL) is determined, among other things, by mechanisms that occur during cell replication. It is known that the leading strand of replicated DNA is replicated continuously during cell division [16]. Previous studies have documented that these chromosomal structures are involved in cellular aging, and age-related telomere shortening is a significant factor in aging [12, 17]. Many researchers consider telomere length an important biomarker for measuring aging and the development of pathological conditions such as obesity, MetS, or CVDs [14, 18–22].
Thus, our analysis aimed to assess the association between obesity, metabolic syndrome (metabolic health), and telomere length.
Material and methods
Study cohort
The LIPIDOGEN2015 study was conducted in primary care practices in 2015. Patients recruited to the LIPIDOGEN2015 cohort (n = 1788) were a random subset of the LIPIDOGRAM2015 (n = 13,724) study patients. Patients for the LIPIDOGRAM2015 & LIPIDOGEN2015 study were recruited in all 16 administrative regions in Poland, and physicians were distributed proportionally to the number of inhabitants in each administrative region. The study’s design and other details were described elsewhere [23].
Anthropometric measurements, including height and body weight, were taken for all patients. The BMI was calculated using height in meters and body mass in kilograms (kg/m2). Each patient was asked to complete a questionnaire that included questions related to the patient’s demographics, risk factors, chronic conditions, treatment, level of education, place of residence, and lifestyle. Smoking was defined as the consumption of one or more cigarettes per day at the time of recruitment. Physical activity was defined as engaging in regular physical activity. Alcohol intake was defined as any consumption of alcohol.
Additionally, blood samples were collected for laboratory tests, and saliva was secured for DNA analysis. Recruited patients were divided into four groups based on the presence of MetS: 1) HS – healthy slim; 2) MHO – metabolically healthy obese; 3) NOMS – non-obese with MetS; 4) MUO – metabolically unhealthy obese. MetS was diagnosed based on the Joint Interim Statement 2009 (JIS) criteria [24]. The patient’s diagnosis of MetS was based on meeting at least three of the criteria listed in Table I.
Table I
Diagnostic criteria for the metabolic syndrome (according to [24])
Anthropometric measurements
Height and weight measurements were collected by medical staff recruiting patients to the LIPIDOGRAM2015 study. The BMI value was determined for each patient and was calculated by dividing the patient’s body weight in kilograms (kg) by the square of the patient’s height in meters (m) (kg/m2). BMI ranging from 18.5 to 24.9 classified the patient as having a normal body weight. Patients with a BMI of 30 or higher were considered to be living with obesity. Waist circumference (WC), expressed in centimeters (cm), was also measured midway between the lower edge of the ribs and the anterior superior iliac crest.
Biochemical analyses
Blood samples were collected and transported in cooled containers to the Silesian Analytical Laboratories (SLA) in Katowice, Poland. Lipid profiles were measured using direct immunological methods. These analyses were conducted with the Siemens Advia 1800 analyzer and Siemens reagents (Munich, Germany) within 12 h of sample collection. Fasting blood glucose (FBG) was determined using Bionime glucometers and Rightest strip tests (both from Taichung City, Taiwan). Hemoglobin A1c (HbA1c) was analyzed through high-performance liquid chromatography (HPLC) using the Variant II Turbo system (Bio-Rad, Hercules, California, USA).
Telomere length measurements
In the first step, DNA was extracted from 2 ml of saliva samples secured using the Oragene-DNA/OG-500 kit (DNA Genotek, Ottawa, Canada). According to the manufacturer’s instructions, DNA was isolated using the PrepIT-L2P kit (manual isolation kit DNA Genotek, Ottawa, Canada). Extracted DNA was then quantified using a BioSpectrometer (Eppendorf, Germany). In the second step, the multiplex quantitative polymerase chain reaction (MMQPCR) method was used to determine relative telomere length (RTL) based on the Cawthon protocol with minor modifications [25].
A 3-fold dilution series (60 ng to 0.74 ng) of genome DNA was used as a reference sample to prepare the standard curves. All experimental and standard samples were run in triplicate. Each reaction well contained 2 µl of DNA (10 ng), 2x SYBR Green PCR Master Mix (Bio Rad, USA), two pairs of primers (telg: 5ʹ-ACACTAAGGTTTGGGTTTGGGTTTGGGTTTGGGTTAGTGT-3ʹ and telc primer: 5ʹ-TGTTAGGTATCCCTATCCCTATCCCTATCCCTATCCCTAACA-3ʹ [25], 500nM; albugcr1: 5ʹ-CGGCGGCGGGCGGCGCGGGCTGGGCGGCCATGCTTTTCAGC TCTGCAAGTC-3ʹ and albdgcr2 primer: 5ʹ-GCCCGGCCCGCCGCGCCCGTCCCGCCGAG CATTAAGCTCTTTGGCAACGTAGGTTTC-3ʹ [26], 900 nM) and water to a final volume of 10 µl. Thermal cycling profile was as follows: 15 min at 95°C, 2 cycles of 15 s at 94°C, 15 s at 49°C; 35 cycles of 15 s at 94°C, 10 s at 62°C, 15 s at 74°C with signal acquisition (signal for telomeres), 10 s at 84°C, 15 s at 88°C with signal acquisition (signal for albumin). After thermal cycling and raw data collection, CFX Manager Software (Bio-Rad, USA) was used to generate two standard curves for each plate, one for telomeres and the second for the reference gene – albumin. The efficiency of the reaction was equal for telomeres and albumin, and it was not lower than 90%. After the run was complete, the MyiQ software (Bio-Rad, USA) was used to determine the T (telomere) and S (single copy gene) values. The ratio between products of telomeres and albumin (T/S) represents a quantity that is proportional to the average telomere length per cell and represents relative telomere length (RTL). The average telomere length of a sample with a T/S of > 1.0 is higher than that of the standard DNA; the average telomere length of a sample with a T/S of 1.0 is lower than that of the standard DNA.
Statistical analysis
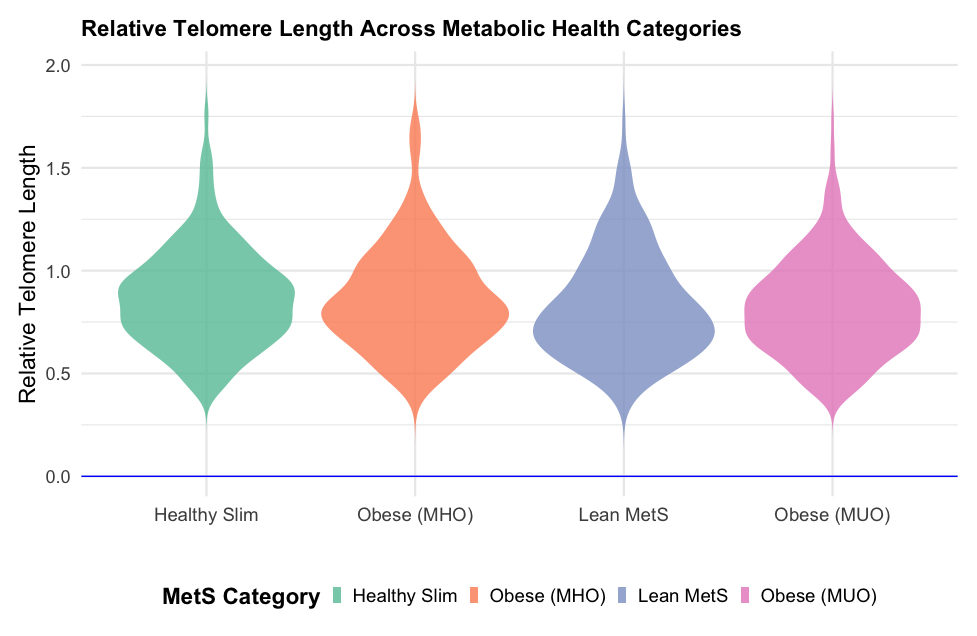
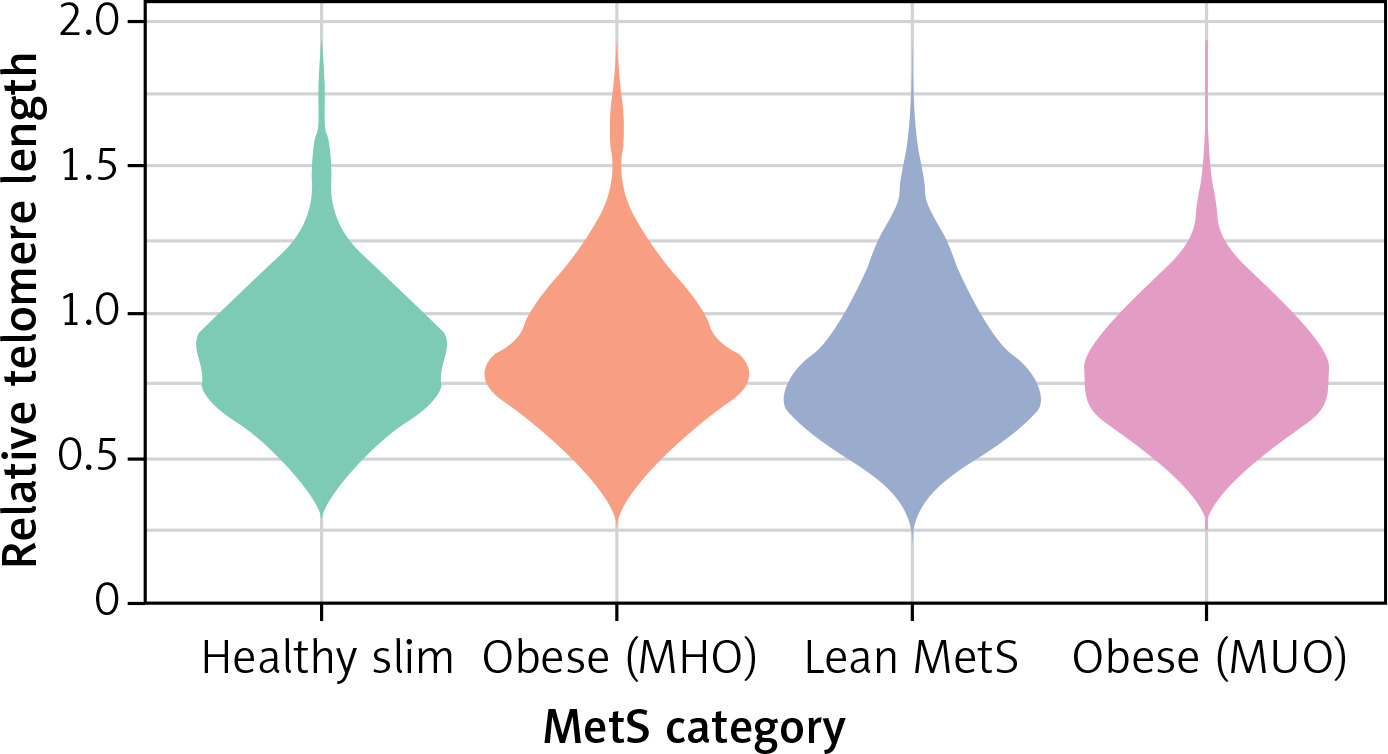
All statistical analyses were conducted using the R software environment. For all statistical tests, a p-value of < 0.05 was considered significant. Outliers in the log-transformed telomere length data were identified and excluded based on the interquartile range (IQR) method. Specifically, outliers were defined as values below Q1 – 1.5IQR or above Q3 + 1.5IQR. Continuous variables are summarized as mean and standard deviation (mean (SD)), and categorical variables are presented as absolute (n) and relative (%) frequencies. To compare clinical characteristics across metabolic health categories (healthy slim, living with obesity (metabolically healthy), lean metabolic syndrome, living with obesity (metabolically unhealthy)), we employed ANOVA for continuous variables and χ2 tests for categorical variables. Post-hoc comparisons were conducted using Tukey’s honest significant difference (HSD) test. A violin plot was created to visualize the distribution of relative telomere length across the metabolic health categories, incorporating a boxplot to show median and interquartile ranges within each category. Univariate regression analysis was also performed to examine the association between metabolic health category and relative telomere length. This was followed by a multivariate regression analysis adjusting for potential confounders, including age, gender, education level, smoking status, place of residence, myocardial infarction, and dyslipidemia. The general linear model (GLM) was used for univariate and multivariate analyses with a Gaussian family specification.
Results
Patient characteristics
Due to the quality of the DNA, the main analysis included 1,604 (90%) patients. After excluding outliers and patients > 75 years, 1,516 patients (85%; 59.7% females, mean age: 50.3 years) were finally included for further analyses (HS-522, MHO-215, NOMS-188, MUO-561, respectively). The clinical characteristics of all four groups, based on BMI category and metabolic health, are presented in Table II.
Table II
Clinical characteristics of the study’s participants
| Characteristic | HS, N = 5221 | MHO, N = 2151 | NOMS, N = 1881 | MUO, N = 5611 | P-value2 |
|---|---|---|---|---|---|
| Age | 45 (12) | 50 (11) | 52 (11) | 54 (11) | < 0.001 |
| Female sex | 368 (67%) | 155 (72%) | 77 (41%) | 305 (54%) | < 0.001 |
| Education (primary/vocational vs. secondary/higher) | 463 (84%) | 174 (81%) | 129 (69%) | 358 (64%) | < 0.001 |
| Place of residence (urban vs rural) | 320 (58%) | 108 (50%) | 100 (53%) | 296 (53%) | 0.14 |
| Smoking | 211 (38%) | 98 (46%) | 103 (55%) | 303 (54%) | < 0.001 |
| Alcohol | 408 (74%) | 150 (70%) | 144 (77%) | 408 (73%) | 0.3 |
| BMI [kg/m2] | 24.0 (2.7) | 30.1 (4.1) | 26.1 (2.2) | 32.0 (4.1) | < 0.001 |
| Physical activity | 287 (52%) | 99 (46%) | 87 (46%) | 221 (39%) | < 0.001 |
| Waist circumference [cm] | 81 (9) | 99 (10) | 90 (8) | 105 (11) | < 0.001 |
| SBP [mm Hg] | 121 (14) | 124 (15) | 133 (15) | 136 (17) | < 0.001 |
| DBP [mm Hg] | 75 (9) | 78 (10) | 82 (10) | 83 (11) | < 0.001 |
| Family history of CVD | 254 (46%) | 99 (45%) | 83 (44%) | 266 (46%) | > 0.9 |
| Diabetes mellitus | 11 (2.0%) | 3 (1.4%) | 24 (13%) | 173 (31%) | < 0.001 |
| Hypertension | 80 (14%) | 50 (23%) | 93 (49%) | 389 (69%) | < 0.001 |
| Atrial fibrillation | 6 (1.1%) | 9 (4.2%) | 5 (2.7%) | 14 (2.5%) | 0.04 |
| Previous MI | 4 (0.7%) | 3 (1.4%) | 9 (4.8%) | 36 (6.4%) | < 0.001 |
| Dyslipidemia | 364 (66%) | 166 (77%) | 158 (84%) | 449 (80%) | < 0.001 |
| CKD | 10 (1.8%) | 2 (0.9%) | 4 (2.1%) | 20 (3.6%) | 0.2 |
| Total cholesterol [mg/dl] | 208 (43) | 213 (40) | 211 (54) | 204 (46) | 0.03 |
| LDL-C [mg/dl] | 128 (39) | 137 (38) | 130 (43) | 128 (41) | < 0.001 |
| HDL-C [mg/dl] | 64 (16) | 60 (14) | 50 (14) | 48 (13) | < 0.001 |
| Trig [mg/dl] | 104 (53) | 114 (41) | 213 (247) | 206 (152) | < 0.001 |
| Non-HDL-C [mg/dl] | 144 (41) | 153 (38) | 161 (51) | 157 (45) | < 0.001 |
| Relative telomere length | 0.87 (0.24) | 0.87 (0.25) | 0.83 (0.25) | 0.83 (0.23) | 0.006 |
| Fibrate | 6 (1.1%) | 4 (1.9%) | 22 (12%) | 49 (8.7%) | < 0.001 |
| Statin | 88 (16%) | 42 (20%) | 59 (31%) | 210 (37%) | < 0.001 |
2 Pearson’s χ2 test; ANOVA test. HS – healthy slim, MHO – metabolically healthy obese, NOMS – non-obese with metabolic syndrome, MUO – metabolically unhealthy obese, BMI – body mass index, SBP – systolic blood pressure, DBP – diastolic blood pressure, CVD – cardiovascular disease, MI – myocardial infarction, CKD – chronic kidney disease, LDL-C – low-density lipoprotein, HDL-C – high-density lipoprotein, Trig – triglycerides, Remnant-C – remnant cholesterol, HbA1c – glycated hemoglobin.
Across all analyzed groups, no differences were observed in terms of place of residence, alcohol consumption, presence of chronic kidney disease (CKD), or family history of CVD. However, patients with MetS, irrespective of BMI category (NOMS and MUO), were older than the other groups. They were also more frequent smokers and had a higher prevalence of diabetes mellitus, hypertension, dyslipidemia, and previous myocardial infarction (MI). Additionally, they showed elevated values of systolic blood pressure (SBP) and diastolic blood pressure (DBP), higher levels of triglycerides (TG), non-high-density lipoprotein cholesterol (non-HDL-C), and lower concentrations of high-density lipoprotein cholesterol (HDL-C). They were more likely to use fibrates and statins. Conversely, the groups of patients without MetS, regardless of BMI category (HS and MHO), were more frequently female and had higher levels of education.
Metabolic health and telomere length
The NOMS and MUO groups had the shortest telomeres (0.83; shortening by 4.6%), suggesting a link between poor metabolic health and accelerated biological aging, as shown in Table II and Figure 1. Post-hoc comparisons of telomere lengths between groups confirmed a significant relationship for MUO and HS (p = 0.01) (Table III).
Table III
Results of Tukey post-hoc tests comparing groups concerning telomere length
Univariate regression analysis showed an association between decreasing RTL and metabolic syndrome (NOMS and MUO for p = 0.038 and p = 0.003, respectively). However, after adjusting for potential confounders, the results from multivariate regression analysis were no longer statistically significant (Table IV).
Table IV
Association of metabolic syndrome category with telomere length
| Characteristic1 | N | Unadjusted analysis | Adjusted analysis* | ||||
|---|---|---|---|---|---|---|---|
| Beta | 95% CI | P-value | Beta | 95% CI | P-value | ||
| Metabolic syndrome category | 1,516 | ||||||
| Healthy slim | – | – | – | – | |||
| Living with obesity (metabolically healthy) | 0.00 | –0.04, 0.03 | 0.8 | 0.01 | –0.03, 0.05 | 0.6 | |
| Lean (non-obese) metabolic syndrome | –0.04 | –0.08, 0.00 | 0.038 | –0.01 | –0.05, 0.03 | 0.5 | |
| Living with obesity (metabolically unhealthy) | –0.04 | –0.07, –0.02 | 0.003 | –0.01 | –0.04, 0.02 | 0.5 | |
Discussion
MetS is defined as a set of disorders characterized by hypertension, obesity, atherogenic dyslipidemia, hyperglycemia, and insulin resistance [6]. The pathophysiology of MetS is complex, and its development is influenced by several factors [5]. Previous work indicates that inflammation and increased oxidative stress play a key role in development of these disorders [13]. Moreover, research indicates that these factors also influence the aging of our body’s cells [12, 27]. In the case of MetS, the increased predisposition to the development and progression of CVD events is caused, among other factors, by increased generation of radicals and increased oxidative stress. Previous literature has described the release of excessive amounts of pro-inflammatory mediators in adipose tissue, including interleukin 6, interleukin 1β, and C-reactive protein (CRP), associated with producing reactive oxygen species [28]. Increasing oxidative stress leads to a weakening of the body’s antioxidant protection mechanisms, which in turn may disturb the function of telomeres and lead to excessive shortening of their length in cells [29, 30].
According to our analysis, the univariate regression analysis showed a significant relationship between decreasing telomere length and MetS, which was interesting irrespective of obesity occurrence. In contrast, after considering potential confounding factors such as age, gender, education, smoking, place of residence, and myocardial infarction, the results of multivariate regression analysis were no longer statistically significant. We observed that NOMS and MUO had shorter telomeres in comparison to HS. These observations indicate that the relationship between TL among patients in different categories of metabolic health may be more complex and an additive value of existing metabolic disorders, factors related to the patient’s lifestyle (alcohol consumption, smoking, physical activity, or diet), and the genetic background.
Our results are also difficult to discuss in relation to previous observations as, to our best knowledge, only a few studies have discussed TL previously in terms of metabolic health and obesity. These results, in fact, also confirm our previous observations in individuals with a positive family history of premature coronary artery disease, where we showed that metabolically healthy individuals with normal body weight have significantly longer telomeres than metabolically unhealthy obese [8]. Molli et al. also observed that obese individuals with MetS had significantly shorter telomeres than those from the metabolically healthy groups with or without obesity. Additionally, researchers emphasized that telomere length decreases as the number of MetS components increases [31]. However, it should be noted that the discussed study distinguished three groups – metabolically healthy non-obese, obese metabolically healthy, and obese individuals with MetS – and it did not include non-obese individuals with MetS as we did. The study was also conducted only on 340 women, while our analysis included over 1500 individuals, both women and men.
Also, other studies focusing on TL analysis among people with MetS indicate that telomeres are shortening. In the Netherlands Study of Depression and Anxiety, it was observed that during the 6-year follow-up, higher baseline values of MetS components, such as glucose levels and WC, as well as lower baseline HDL, were associated with shorter telomeres. The authors also found at the 6-year follow-up that greater increases in WC were associated with greater telomere loss among subjects [19]. Interestingly, analyses conducted on a group of 255 pregnant women and their 10-year postpartum follow-up showed a significant difference in TL in children of women who suffered from MetS during pregnancy compared to women without MetS. They showed that the telomeres of these children were 14% shorter, while other anthropometric indicators such as body weight, height, or calculated BMI did not differ in these groups. Additionally, in a subgroup analysis by gender, researchers found that the group of girls whose mothers suffered from MetS during pregnancy showed shorter telomeres compared to girls of healthy mothers. It is worth noting that in this study, similarly to ours, genetic material collected from children and isolated from saliva was used [32]. Attention should be paid however, to the relatively small study group, which may affect the strength of the results.
Another study found a relationship between higher waist-to-hip ratio (WHR), glucose concentration, lower HDL-C concentration, and cigarette smoking, which were independent and modifiable factors associated with an increased rate of telomere loss. Interestingly, active smokers had a higher rate of annual telomere loss than non-smokers. In contrast, among people who stopped smoking cigarettes before recruitment, a shorter baseline leucocyte TL was still observed. However, it was noted that the value of telomere loss was comparable in the annual assessment to the value determined in those who had never smoked [33]. The above studies indicate a relationship between TL and the component elements of MetS. It is also worth noting that, unlike our study, almost all described studies were carried out using the analysis of telomere length obtained from leukocyte cells, and they did not consider changes in telomere length in terms of obesity and metabolic health.
Similar observations on telomere shortening were made in obesity studies. A study with 3,386 subjects showed that over the analyzed 10 years, subjects with stable obesity had a significantly shorter LTL than the control group, which had a stable, normal body weight. A statistically significant shortening of telomere length was also observed among people with normal weight who experienced weight gain over the analyzed 10 years [34]. In the study by Wang et al., body weight and BMI were significantly negatively associated with TL among 2,918 subjects. The authors found that greater fluctuations in body weight among the study group could be related to faster telomere shortening [35]. Also, in the Dutch population, it was noted that a higher baseline WC value was associated with shorter TL in the study population, and in the 6-year follow-up, an increase in WC was associated with greater TL reduction [19].
Although many studies with MetS patients indicate that they have significantly shorter TL compared to healthy populations, it should be noted that a published Mendelian randomization (MR) analysis is inconsistent with these observations. An MR study conducted on the European population indicated that the genetically predicted length of leukocyte telomeres may be associated with components of MetS and an additional higher odds ratio for developing MetS. It was stated that although genetically determined changes in the length of telomeres are associated with a risk of developing MetS, the process of their shortening itself may not be the leading cause of dysfunction and aging of adipose tissue cells in humans [36]. Additionally, according to a literature review and meta-analysis of previously published MR studies, which concerned the analysis of the relationship between TL and cancer and non-cancer diseases, genetically determined changes in the length of telomeres are associated with the risk of many cancers and the development of diseases such as hypertension or MetS [37]. The works mentioned above indicate that telomere length is unspecified in developing many diseases, including MetS. Further basic research on these mechanisms is necessary to explain this relationship.
The univariate regression analysis showed a relationship between decreasing TL and MetS in obese and non-obese patients with MetS. After adjusting for potential confounding factors, the results of the multivariate regression analysis were no longer statistically significant. Nevertheless, it is important to note that we observed that NOMS and MUO had shorter telomeres than HS and MHO, suggesting an association between poor metabolic health and accelerated biological aging. It should be emphasized that many other factors may influence the phenomenon of telomere shortening and that the inflammation accompanying metabolic disorders and the associated oxidative stress may directly impact cell health and greater TL shortening.
Additionally, it is worth noting that most of the described works concerned the analysis of telomere length obtained from leukocytes [38, 39]. In our study, saliva was the biological material from which we isolated DNA to determine TL. This might explain some differences in our results compared to other studies where TL was measured in venous blood. The literature indicates the comparable quality of genomic DNA obtained from saliva and blood samples and the use of this material for scientific research [40]. DNA obtained from saliva samples may be an alternative to invasive venous blood sampling for TL measurements [41]. However, there are some inconsistencies in the comparison of these two methods. Lahnert, in his study, found that saliva samples had a lower measurement precision than blood samples [42]. Conversely, a study conducted by Geronimus et al., which aimed to compare TL measurements between venous blood, dried blood spots, and saliva samples, found that telomere length was longer in saliva than in blood [43]. The rate of telomere shortening may also vary among different populations or cell types, which could explain some of the differences in telomere length depending on the type of sample used [44].
Our analyses indicate a potential association between presence of MetS and shorter telomeres, regardless of obesity. However, we are aware of the limitations of the present results: 1) The analyses are based on clinical, anthropometric data and patient samples recruited from individuals in a cross-sectional study. This may have some limitations for causal inferences, and perhaps future longitudinal studies may provide deeper insight into the temporal relationship between MetS and TL. 2) Increasing the number of patients in the studied subgroups perhaps could provide more precise insights; however, due to the adopted inclusion criteria, it was not possible to increase the number of studied individuals in this investigation. 3) The analysis of TL based on collected biological material, which is saliva, is not often used and creates certain inconveniences in comparing our results with the results of other research teams that base their analyses on DNA isolated from whole blood. Due to a large number of participants in the LIPIDOGRAM2015&LIPIDOGEN2015 project and the fact that recruitment covered 16 administrative regions in Poland, we chose saliva as the source of genomic DNA – it is a minimally invasive process of obtaining the material and, in addition, it will provide logistical convenience in the transport of secured samples from many recruitment sites to one laboratory. 4) It should be noted that the assessment of telomeres in cells from one tissue, regardless of whether it is blood or epithelium, has its limitations for the assessment of the relationship between TL and studied disease, which affects different tissues to a different extent.
In conclusion, we found a potential association between MetS individuals with shorter telomeres irrespectively of occurrence of obesity. Multivariate analysis did not confirm this, so further studies involving more patients are required. It should also be emphasized that a group of non-obese people with MetS was investigated in our analyses, which may help to increase the awareness that MetS may also occur in lean people and might be associated with a risk of mortality [45–47].