Introduction
Sepsis, characterised as a systemic reaction to microbial infections, is frequently seen in patients with severe illness, and it can result in serious organ dysfunction or even death [1, 2]. It is estimated that approximately 48.9 million individuals experience sepsis globally, with a mortality rate of 19.7% [3]. It poses significant harm not only to the patients’ families but also to the whole society [4]. Given the significant morbidity and mortality of sepsis, the clinicians’ demand for more affordable and simplified biomarkers that can accurately forecast the prognosis of individuals experiencing sepsis is urgent.
Red blood cell distribution width (RDW), a well-known indicator of inflammation, has the potential to function as both a diagnostic and prognostic indicator of sepsis [5]. RDW reflects the heterogeneity of circulating red blood cell (RBC) size [6, 7]. Several studies have indicated a link between elevated RDW levels and an escalated mortality for individuals experiencing sepsis [8–10]. According to previous studies, it has been noted that sepsis patients who exhibit reduced levels of serum albumin (ALB), a biochemical indicator of nutritional status, tend to have unfavourable outcomes [11]. That association is believed to be attributed to the potential anti-inflammatory effects and mitigation of oxidative stress provided by ALB [12, 13]. The RDW-to-albumin ratio (RAR), combining RDW and ALB levels, has been identified as a valuable predictor of mortality in certain medical conditions [14, 15]. Based on a retrospective analysis carried out by Zhao et al., it was observed that a higher level of RAR was linked to an increased likelihood of all-cause mortality in stroke patients [14]. Furthermore, the correlation between RAR and mortality has been observed in patients undergoing burn surgery [16], acute respiratory distress syndrome [17], diabetic ketoacidosis [18], and critically ill pneumonia [19]. Nevertheless, the effect of RAR on outcomes in patients with sepsis has been sparsely investigated in the existing literature.
This research postulated that RAR might be able to serve as a prognostic factor for septic patients. To validate this hypothesis, we designed this research to explore the correlation of RAR with the outcomes of sepsis patients, and to develop predicting models in assessing the prognostic significance of RAR.
Material and methods
Population selection
For this study, we utilised data from Medical Information Mart for Intensive Care III (MIMIC-III) to conduct this retrospective cohort analysis. MIMIC-III is a freely accessible database that stores anonymised information on over 40,000 individuals who were hospitalised in the intensive care unit (ICU) at Beth Israel Deaconess Medical Centre [20]. Because patients’ information in the database is desensitised, the ethical review of our hospital was exempted.
Inclusion criteria: (1) patients identified as having sepsis according to the sepsis-3 guidelines and the identification of sepsis involved the presence of both infection and the sequential organ failure assessment (SOFA) score exceeding or equal to 2 [21]; and (2) patients with complete information about RDW and ALB.
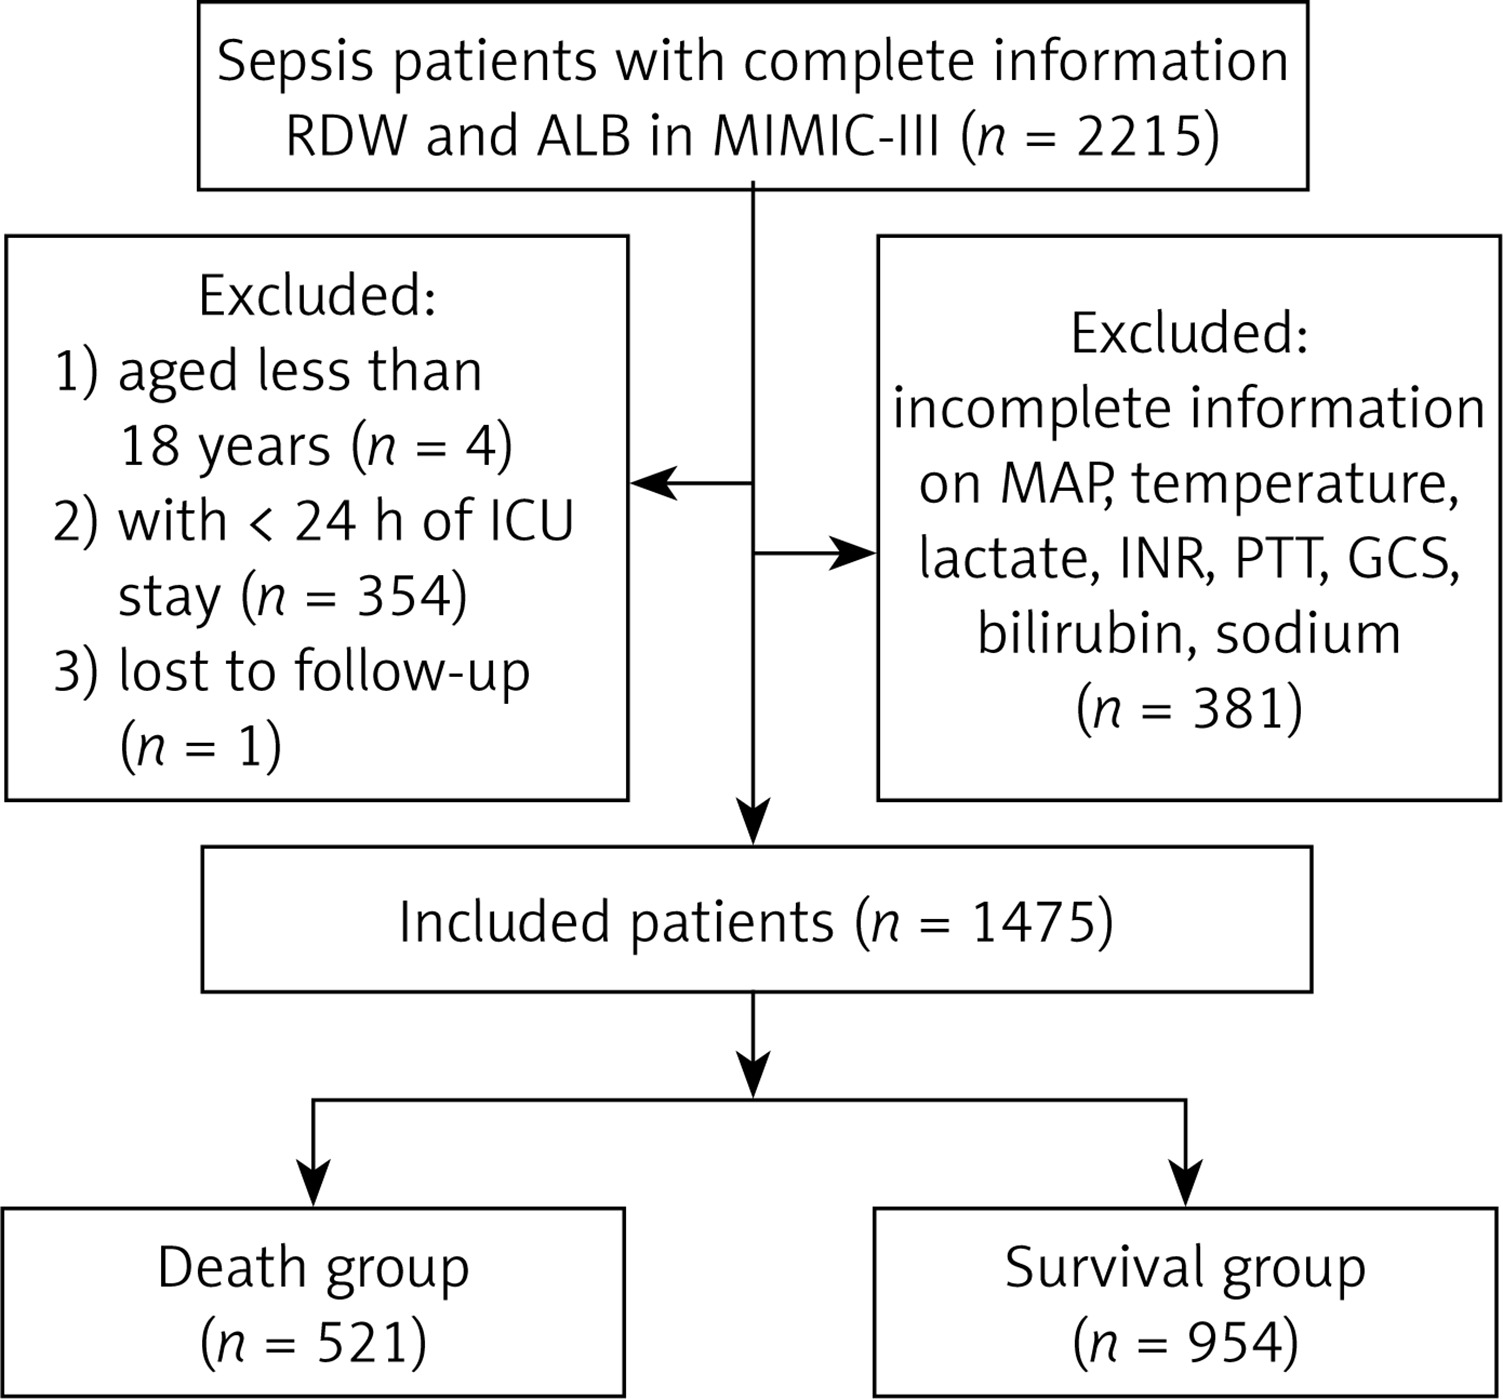
Exclusion criteria: (1) patients with ICU stay < 24 h; (2) patients aged < 18 years; (3) patients lacking information on vital signs or key variables; and (4) patients lost to follow-up. Figure 1 illustrates the process of participants’ selection in this investigation. The final analysis encompassed a cohort of 1475 individuals diagnosed with sepsis.
Figure 1
The process of population selection for this study
RDW – red blood cell distribution width, ALB – albumin, MIMIC – Medical Information Mart for Intensive Care, ICU – intensive care unit, MAP – mean arterial pressure, INR – international normalized ratio, PTT – partial thromboplastin time, GCS – Glasgow coma scale.
Outcome
The main outcome of this study was to focus on 28-day mortality after ICU admission. The initiation of the follow-up period commenced upon ICU admission, while its termination occurred 28 days after ICU admission.
Data collection
Data were collected from ICU patients during the initial 24-hour period following their admission. In cases where septic patients had multiple admissions to the ICU, only data from their initial admission was included in our analysis. We collected data on the following variables: (1) demographic data: gender, age (years), race, and status of marriage; (2) vital signs and laboratory values: mean arterial pressure (MAP, mm Hg), systolic blood pressure (SBP, mm Hg), diastolic blood pressure (DBP, mm Hg), temperature (°C), respiratory rate (breaths/min), heart rate (times/min), RAR, blood urea nitrogen (BUN, mg/dl), creatinine (mg/dl), bilirubin (mmol/l), lactate (mmol/l), white blood cell count (WBC, K/µl), sodium (mEq/l), haemoglobin (g/dl), potassium (mEq/l), bicarbonate (mEq/l), chloride (mEq/l), international normalised ratio (INR), prothrombin time (PT, sec), and partial thromboplastin time (PTT, s); (3) interventions: the use of mechanical ventilation, renal replacement therapy (RRT), and vasopressor; (4) severity score: sequential organ failure assessment (SOFA) score, Glasgow coma scale (GCS), and simplified acute physiology score II (SAPS II); and (5) comorbidities: diabetes, liver disease, hypertension, congestive heart failure (CHF), septic shock, atrial fibrillation, Charlson comorbidity index (CCI), coronary heart disease (CHD), acute respiratory failure (ARF), acute kidney failure (AKF), and sepsis-induced myocardial dysfunction (SIMD).
Statistical analysis
For continuous variables that exhibited a normal distribution, we used mean ± standard deviation (mean ± SD) to represent them. When the variables did not follow a normal distribution, we represented them using the median and quartiles. We employed t-test or Wilcoxon rank sum test to assess inter-group differences. Categorical variables were analysed for the number of cases and the composition proportion, and assessed for inter-group differences using the χ2 test. The patients with missing variables were excluded, and sensitivity analysis was performed on the population both before and after deletion (Supplementary Table SI). The threshold for statistical significance was p < 0.05.
Patients were categorised into 2 cohorts, namely the group of patients who survived for 28 days and the group of patients who did not survive for 28 days. A comparison was conducted to analyse the distribution of characteristics between the 2 groups. Variables of p < 0.05 were identified as confounding factors in this study, and both univariate and multivariate COX analyses were performed to investigate the association between RAR and 28-day mortality for sepsis patients. We further performed analyses of the subgroups stratified by age, gender, intervention modality, and disease progression. The hazard ratio (HR) along with a 95% confidence interval (CI) was calculated.
In addition, we assessed the predictive value of RAR by developing the predictive models. All cases were assigned to 2 groups, namely training and testing groups, using a random allocation method with an 8 : 2 ratio. The predictive models were established in the training group to predict the mortality of sepsis patients, and they were validated in the testing group. Herein, we adopted least absolute shrinkage and selection operator (LASSO) regression analysis to identify potential predictors in the training group. Those predictors were included to establish 4 predictive models related to RAR: logistic regression (LR) model, random forest (RF) model, light gradient boosting machine (LGBM) model, and extreme gradient boosting (XGBoost) model, and the importance of each variable in each model was analysed. The performance of these constructed models and the SOFA and SAPS II scoring systems was assessed using the receiver operator characteristic (ROC) curve.
Results
Characteristics
This study involved 1475 individuals diagnosed with sepsis, who had an average age of 64.47 ±16.44 years. The follow-up period had a median duration of 28 (11.86, 28) days. Table I presents the characteristics of the enrolled sepsis patients, among whom 954 survived and 521 died.
Table I
Characteristics of population
[i] SBP – systolic blood pressure, DBP – diastolic blood pressure, MAP – mean arterial pressure, WBC – white blood cell count, BUN – blood urea nitrogen, INR – international normalised ratio, PT – prothrombin time, PTT – partial thromboplastin time, RRT – renal replacement therapy, GCS – Glasgow coma scale, SOFA – sequential organ failure assessment, SAPS II – simplified acute physiology score II, CCI – Charlson comorbidity index, CHF – congestive heart failure, CHD – coronary heart disease, AKF – acute kidney failure, ARF – acute respiratory failure, SIMD – sepsis-induced myocardial dysfunction, RAR – red blood cell distribution width-albumin ratio, SD – standard deviation.
The survival group were significantly younger than the death group. Additionally, we found notable variations between the survival and death groups in the variables of age, gender, DBP, SBP, MAP, temperature, BUN, bilirubin, creatinine, lactate, sodium, potassium, bicarbonate, chloride, INR, PT, PTT, use of vasopressor, use of mechanical ventilation, GCS, CCI, liver disease, septic shock, atrial fibrillation, AKF, and ARF (all p < 0.05), suggesting that those variables may be confounding factors.
Relationship of RAR with 28-day mortality
In the unadjusted model, RAR was relevant to 28-day mortality of sepsis patients (Table II; Model 1: HR = 1.14, 95% CI: 1.10–1.18). After adjusting confounding factors, including age, gender, DBP, SBP, MAP, temperature, BUN, bilirubin, creatinine, lactate, sodium, potassium, bicarbonate, chloride, INR, PT, PTT, GCS, use of vasopressor, use of mechanical ventilation, CCI, liver disease, septic shock, atrial fibrillation, AKF, and ARF, multivariate COX analysis indicated that RAR exhibited independent association with 28-day mortality in sepsis patients, with an adjusted HR value of 1.13 (95% CI: 1.08–1.17). Subsequently, we proceeded to analyse the impacts of SOFA and SAPS II on the mortality within 28 days. In the adjusted model, both SOFA (HR = 1.09) and SAPS II (HR = 1.04) exhibited significant associations with 28-day mortality.
Table II
The correlation analysis of RAR, SOFA, SAPS II, and 28-day mortality for patients with sepsis
[i] RAR – red blood cell distribution width-albumin ratio, SOFA – sequential organ failure assessment, SAPS II – simplified acute physiology score II, HR – hazard ratio, CI – confidence interval. Model 1: unadjusted variables. Model 2: adjusted age, gender, systolic blood pressure, diastolic blood pressure, mean arterial pressure, temperature, blood urea nitrogen, bilirubin, creatinine, lactate, sodium, potassium, bicarbonate, chloride, international normalized ratio, prothrombin time, partial thromboplastin time, Glasgow coma scale, use of vasopressor, use of mechanical ventilation, Charlson comorbidity index, liver disease, septic shock, atrial fibrillation, acute kidney failure, acute respiratory failure.
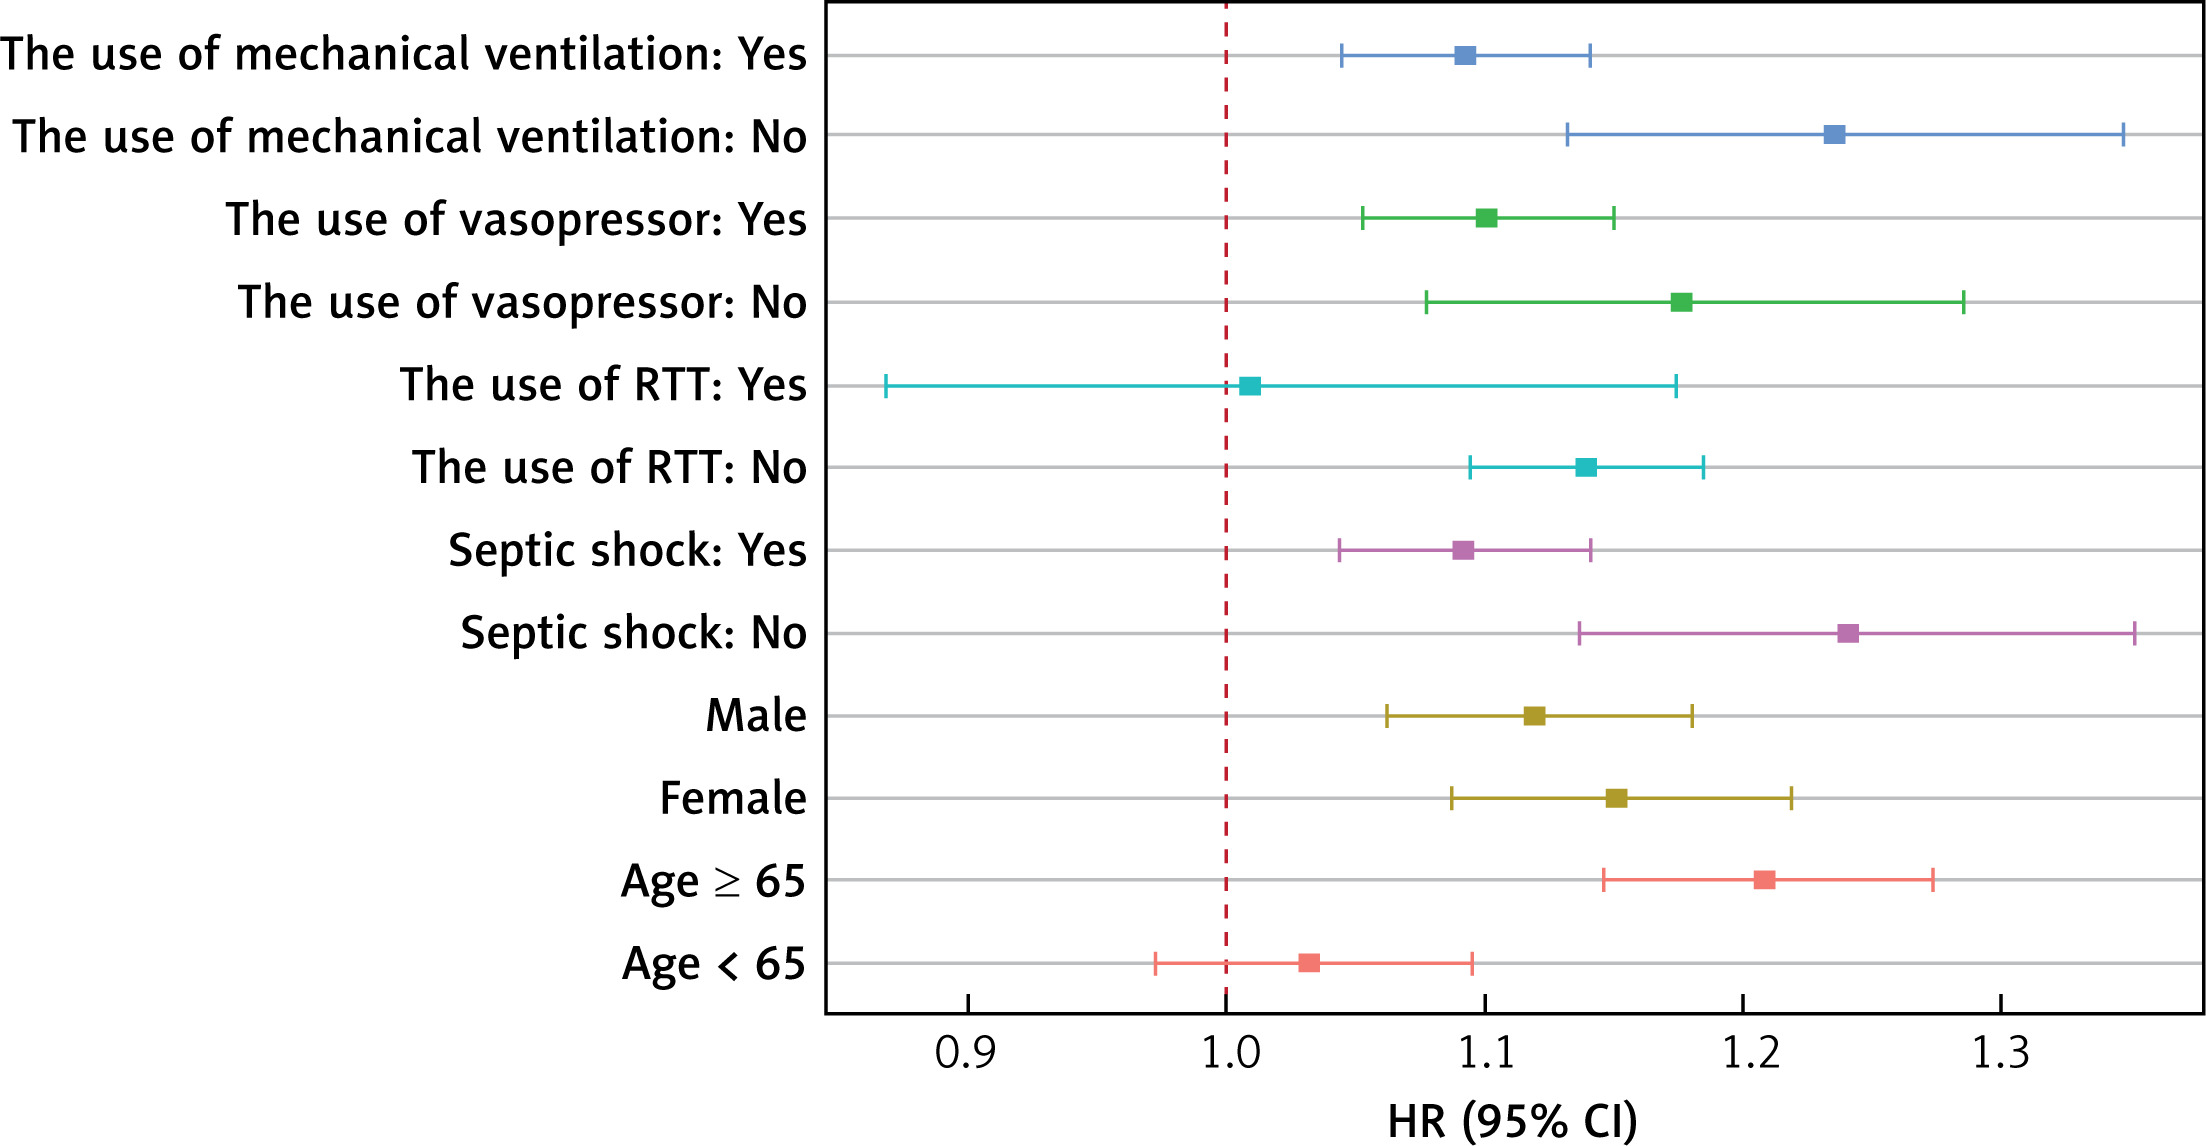
Subgroup analysis
We explored the correlation between RAR and the likelihood of 28-day mortality in sepsis patients exhibiting diverse characteristics. As depicted in Figure 2, we conducted subgroup analyses based on the use of RRT, the use of mechanical ventilation, the use of vasopressor, septic shock, age, and gender. The findings indicated a significant association of RAR with 28-day mortality for sepsis patients who did not use RRT and were aged ≥ 65 years, whether they were male or female, had mechanical ventilation, vasopressor, and septic shock or not. Notably, the impacts of RAR on the prognosis of patients at 28 days after ICU admission may not apply to sepsis patients who have the use of RRT and are younger than 65 years old.
Development of prediction model associated with RAR
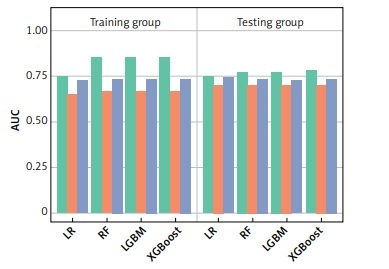
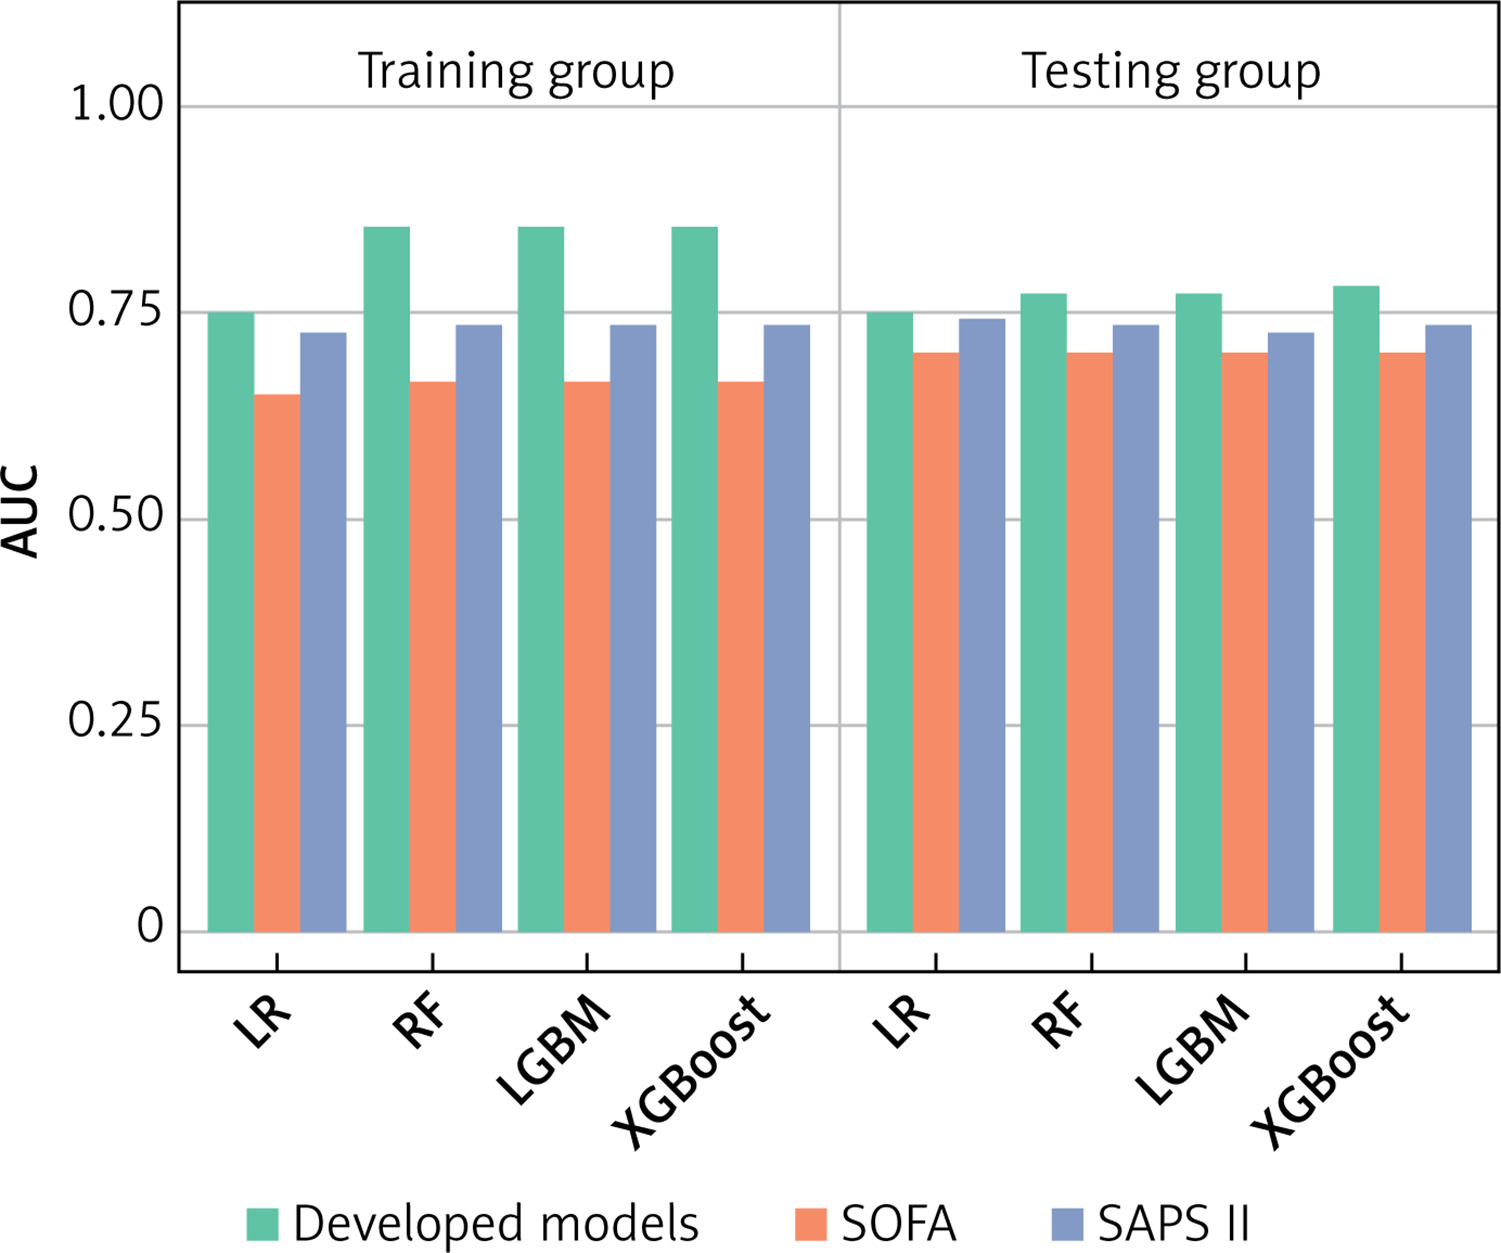
To assess the predictive value of RAR, we developed 4 predictive models for predicting 28-day mortality of sepsis patients. LASSO regression analysis was adopted for the selection of predictors. As shown in Supplementary Figure S1, the results indicated that CCI, RAR, age, BUN, lactate, ARF, INR, liver disease, use of mechanical ventilation, GCS, SBP, potassium, DBP, use of vasopressor, CHF, AKF, and septic shock were predictors, which were used to develop 4 predictive models associated with RAR: LR model, RF model, LGBM model, and XGBoost model. Simultaneously, we analysed the contributions of each predictor (Figure 3). According to the results of each feature’s contributions in the 4 predictive models, RAR was an important feature for forecasting the 28-day mortality. Table III represents the predictive capabilities of the LR, RF, LGBM, and XGBoost models in the training and testing groups. The results showed that the LR model, RF model, LGBM model, and XGBoost model had good predictive performance for forecasting the 28-day mortality of sepsis patients. The ROC curves, SOFA score, and SAPS II score of these constructed models are shown in Figure 4. These constructed models, compared with SOFA and SAPS II scores, had significantly higher AUCs in both the training and testing groups.
Table III
The predictive performance of the constructed models
Figure 3
Importance of each predictor
RF – random forest, LGBM – light gradient boosting machine, XGBoost – extreme gradient boosting, CCI – Charlson comorbidity index, RAR – red blood cell distribution width-albumin ratio, BUN – blood urea nitrogen, ARF – acute respiratory failure, INR – international normalized ratio, GCS – Glasgow coma scale, SBP – systolic blood pressure, DBP – diastolic blood pressure, CHF – congestive heart failure, AKF – acute kidney failure.
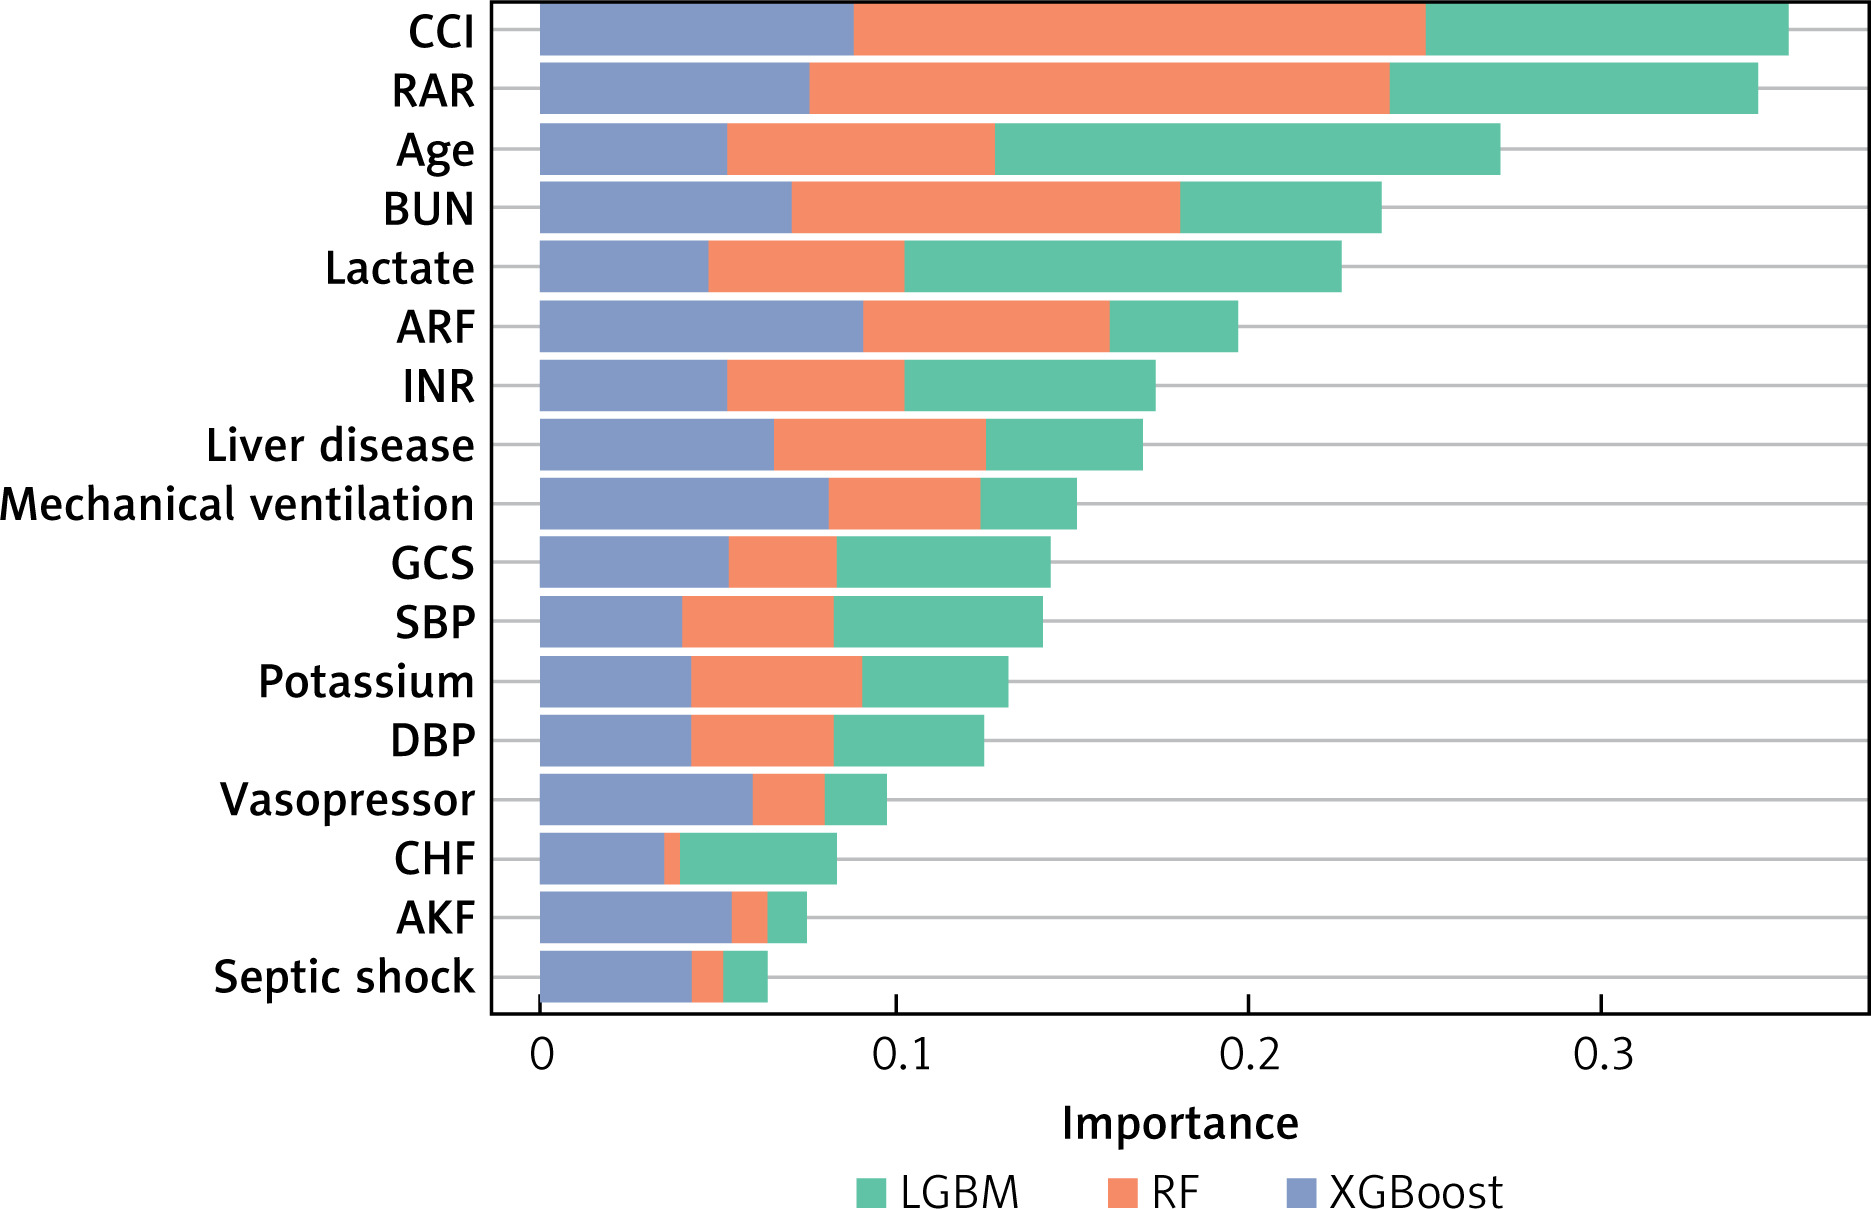
Figure 4
Comparison of the predictive performance of the constructed models with SOFA and SAPS II scores
LR – logistic regression, RF – random forest, LGBM – light gradient boosting machine, XGBoost – extreme gradient boosting, SOFA – sequential organ failure assessment, SAPS II – simplified acute physiology score II.
Discussion
The relationship of RAR with 28-day mortality for sepsis patients admitted to the ICU was investigated in this paper, involving a cohort of 1475 individuals from the MIMIC-III database. The findings indicated that RAR was linked to an increased risk of 28-day mortality in sepsis patients.
The RAR parameter is formed by combining RDW and ALB. Numerous studies have revealed that RAR, as an easily accessible and low-cost biomarker, possesses the capability to serve as a predictive marker for various diseases [22, 23]. Qiu et al. analysed 1174 individuals diagnosed with chronic obstructive pulmonary disease and found that the high level of RAR was associated with hospital mortality; furthermore, it was observed that RAR could serve as a predictive factor for hospital mortality (AUC = 0.706, 95% CI: 0.665–0.747) [22]. Zhao et al. designed a cross-sectional study and concluded that RDW showed a significant association with the development of diabetic retinopathy (odds ratios = 1.64, 95% CI: 1.23–2.19) [23]. In the present study, after adjusting age, gender, DBP, SBP, MAP, temperature, BUN, bilirubin, creatinine, lactate, sodium, potassium, bicarbonate, chloride, INR, PT, PTT, GCS, use of vasopressor, use of mechanical ventilation, CCI, liver disease, septic shock, atrial fibrillation, AKF, and ARF, we observed that RAR was linked with increased 28-day mortality among sepsis patients. After performing subgroup analyses, the correlation of RAR with 28-day mortality remained statistically significant for sepsis patients who did not use RRT, aged ≥ 65 years, whether they were male or female, and had mechanical ventilation, vasopressor, and septic shock or not. This research was an initial attempt to explore the correlation of RAR with 28-day mortality among sepsis patients utilising the MIMIC-III database. However, the underlying mechanism regarding that association is unclear. Possible explanations are as follows: as one of the components of the RAR, RDW, may reflect the heterogeneity of peripheral blood erythrocyte volume [6]. Oxidative stress, hypertension, malnutrition states, dyslipidaemia, and inflammation can lead to an increase of RDW, and these abnormalities associated with sepsis may lead to adverse outcomes [6, 9]. Sepsis causes increased oxidative stress [24], which potentially leads to a decrease in the lifespan of RBC and an elevated release of immature RBC into peripheral circulation, and these may lead to an elevated RDW level [25]. Additionally, ALB, the other component of RAR, is a negative acute phase protein that assumes a pivotal function in upholding physiological equilibrium and contributes to mitigating inflammatory responses [26, 27]. ALB could be oxidised under oxidative stress, leading to significant hypoalbuminaemia [28, 29]. Sepsis is a systemic inflammatory response [30].
Furthermore, we also evaluated the predictive value of RAR by building 4 prediction models. Those developed models, relevant to RAR, performed well in predicting 28-day mortality. Compared to conventional SOFA and SAPS II scores, these models exhibited a better predictive power. The findings indicate that RAR might have promise as a reliable prognostic indicator for patients with sepsis.
Nevertheless, certain limitations were present in this research. First, considering that this study is a retrospective single-centre design, there is inevitably a potential bias. However, we have adjusted many covariates to ensure the credibility of the results. Second, the data utilised in our study was obtained from the MIMIC-III database, and we only extracted RAR data in the initial 24 h after the patients’ admission to the ICU, without considering any dynamic changes in RAR. Also, our investigation was carried out on adult individuals admitted to the ICU, so it is still unclear whether the prognostic value of RAR is applicable to other populations. Further prospective studies are warranted to validate our findings.
In conclusion, this research provides evidence that RAR was linked to 28-day mortality for sepsis patients admitted to the ICU. The predictive value of RAR was also assessed by developing predictive models. Clinical attention to RAR as a prognostic indicator could be helpful to understand the prognosis in sepsis patients, thereby taking timely and appropriate therapeutic measures based on the patient’s prognosis prediction. However, more prospective studies will be required to validate these results in the future.