Partial hepatectomy (PH) remains the first-line curative treatment for liver malignancies; however, an extended hepatectomy is accompanied by higher risk of postoperative liver failure, which is the most common cause of mortality after this procedure. Whether a hepatic resection is performed generally depends on preoperative liver function and the volume of the further liver remnant (FLR) [1–4].
Previous studies have demonstrated that Kupffer cells produce important cytokines that induce cell proliferation after hepatectomy [3]. For the present study, it was hypothesized that, instead of performing a liver parenchymal transection after portal vein ligation (PVL), injecting polarized proinflammatory CD86+ macrophages could trigger a full inflammatory response and accelerate liver regeneration through the release of proinflammatory cytokines.
Inbred male Sprague-Dawley (SD) rats aged 8–10 weeks (body weight 260–290 g) were obtained from the Animal Laboratories of Jilin University, Changchun, China. The study was in compliance with the Guide for the Care and Use of Laboratory Animals published by the US National Institutes of Health (NIH publication no. 85-23, revised 1996).
The rats were separated into four groups: (1) a sham group, in which the abdomen was opened and closed after manipulation of the liver hilum (n = 6); (2) a PVL group, in which a caudate lobectomy and selective ligation of the portal vein feeding the left median, left lateral, and right lobes were performed (n = 6); (3) an associating liver partition and portal vein ligation for staged hepatectomy (ALPPS) group, in which a caudate lobectomy and a parenchymal transection between the right and left median lobes after selective PVL were performed (n = 6); (4) a PVL/injection of CD86+ macrophages group (PVL/macrophages), in which CD86+ macrophages were injected into the body via the portal vein after the PVL procedure (n = 6). Four time points were used during the experiment: postoperative day 1 (POD1), postoperative day 3 (POD3), postoperative day 5 (POD5), and postoperative day 7 (POD7).
Macrophages were recovered from the peritoneal cavity of euthanized SD rats using 10 ml of ice-cold phosphate buffer saline (PBS) supplemented with ethylenediaminetetraacetic acid (EDTA). Purified macrophages were incubated for 24 h without fetal bovine serum (FBS) and with 20 ng/ml of interferon gamma (IFN-γ), before being stimulated with 500 ng/ml of lipopolysaccharide (LPS). The cells were then stained using indicated fluorochrome-conjugated antibodies for 30 min at 4°C before being washed with PBS supplemented with 2% bovine serum albumin (BSA), 4 mM EDTA, and 0.01% sodium azide (NaN3) and fixed in 4% paraformaldehyde.
The culture supernatant of the macrophages was collected 24 h after being treated with 20 ng/ml IFN-γ and 500 ng/ml LPS. Tumor necrosis factor α (TNF-α), interleukin-6 (IL-6), interleukin-1β (IL-1β), and interleukin-2 (IL-2) in the cell culture supernatant were measured using enzyme-linked immunosorbent assay (ELISA) kits according to the manufacturer’s instructions (ABclonal Biotechnology Co. Ltd., Wuhan, China).
The rats were anesthetized with 30 mg/kg barbital sodium (Ketalar; Par Pharmaceutical Co. Inc., Spring Valley, New York, USA) via intraperitoneal injection after the skin was cleaned with iodine and 70% alcohol. All surgical procedures were performed under an operating microscope (binocular operation microscope, type GX.SS.22-3; Shanghai Medical Optical Instruments Co. Ltd., China). Transection of the liver parenchyma was carried out using bipolar coagulation forceps (electrosurgery unit, ART-E1; Bonart Co. Ltd., Taipei, Taiwan).
The HRR of the right median lobe was calculated using the formula HRR = (WA – WI )/WI × 100% (5), where WA was the actual weight of the right median lobe measured at the time of death and WI was the initial weight of the lobe before surgery. The initial weight of the right median lobe was calculated with the formula WI = body weight × 0.97%. The value of 0.97% represented the mean right median lobe weight as a percentage of the body weight of 10 normal male SD rats weighing 260–290 g.
Liver tissue was stained with hematoxylin and eosin (H&E). The numbers of Ki-67+ hepatocytes and CD86+ macrophages were counted using an immunohistochemical staining assay with the Ki-67 and CD86+ antibodies according to the manufacturer’s instructions (ABclonal Biotechnology Co. Ltd., Wuhan, China).
All animal experiments were carried out according to the experimental practices and standards approved by the Animal Welfare and Research Ethics Committee at Jilin University (no: IZ-2009-008). The experimental protocols were reviewed and approved by the committee.
Data were expressed as mean ± standard deviation (SD). Differences between the groups were assessed using the Mann-Whitney U test and Student’s t-test. Statistical analyses were conducted using Prism 5.0 (GraphPad Software Inc, San Diego California, USA). P < 0.05 was considered statistically significant.
The injection of polarized macrophages resulted in significantly increased production of IL-2, IL-6, TNF-α, and IL-1β compared with the injection of non-polarized macrophages (p < 0.01) (Table I).
Table I
Expression of M1 macrophage and levels of pro-inflammatory cytokines in culture supernatant
| Parameter | CD68+ macrophage group | CD86+CD68+ macrophage group |
|---|---|---|
| Cell purity(%) | 96.0 ±0.9 | 98.1 ±0.7 |
| Cytokines[pg/ml]: | ||
| IL-2 | 601.4 ±62.1 | 1165.0 ±76.4* |
| IL-6 | 70.9 ±5.2 | 181.6 ±18.5* |
| TNF-α | 105.5 ±5.8 | 155.8 ±7.8* |
| IL-1β | 14.2 ±1.4 | 32.6 ±4.7* |
Compared with the PVL group, the ALPPS group and PVL/macrophage group had a greater regeneration response, with an increased HRR at POD3, POD5, and POD7 (p < 0.01). Although the HRR of the ALPPS group was higher than that of the PVL/macrophage group at POD3 (p < 0.01), there was a gradual increase in the HRR of the PVL/macrophage group. At POD5, the increased HRR of the PVL/macrophage group was comparable to the HRR of the ALPPS group; however, the increased HRR was significantly lower in the PVL/macrophage group than in the ALPPS group at POD7 (p < 0.05).
There was a significant difference between the number of CD86+ macrophages per visual field (magnification 20×) in the four groups at POD1, POD3, and POD5. The number of CD86+ macrophages was significantly higher in the ALPPS group and the PVL/macrophage group than in the PVL and sham groups at POD1, POD3, and POD5 (p < 0.01), while the number of CD86+ macrophages was significantly higher in the ALPPS group than in the PVL/macrophage group (p < 0.05) (Figures 1 A, B).
Figure 1
Infiltration of Kupffer cells and levels of proinflammatory cytokines and HGF. A – Immunohistochemical staining for CD86+ in regenerating lobes at POD7. Kupffer cells with nuclear deposition of blue pigment were positive (original magnification 200×). B – The number of CD86+ macrophages per visual field (magnification 20×). C – Serum IL-6 levels. D – Serum IL-1β levels. E – Serum TNF-α levels F – Serum IL-2 levels. G – Serum HGF levels
Values are means ± SD. *p < 0.01 compared with the sham group; &p < 0.01 PVL group vs. PVL/macrophage group; #p < 0.01 PVL group vs. ALPPS group; Ɏp < 0.01 PVL/macrophage group vs. ALPPS group.
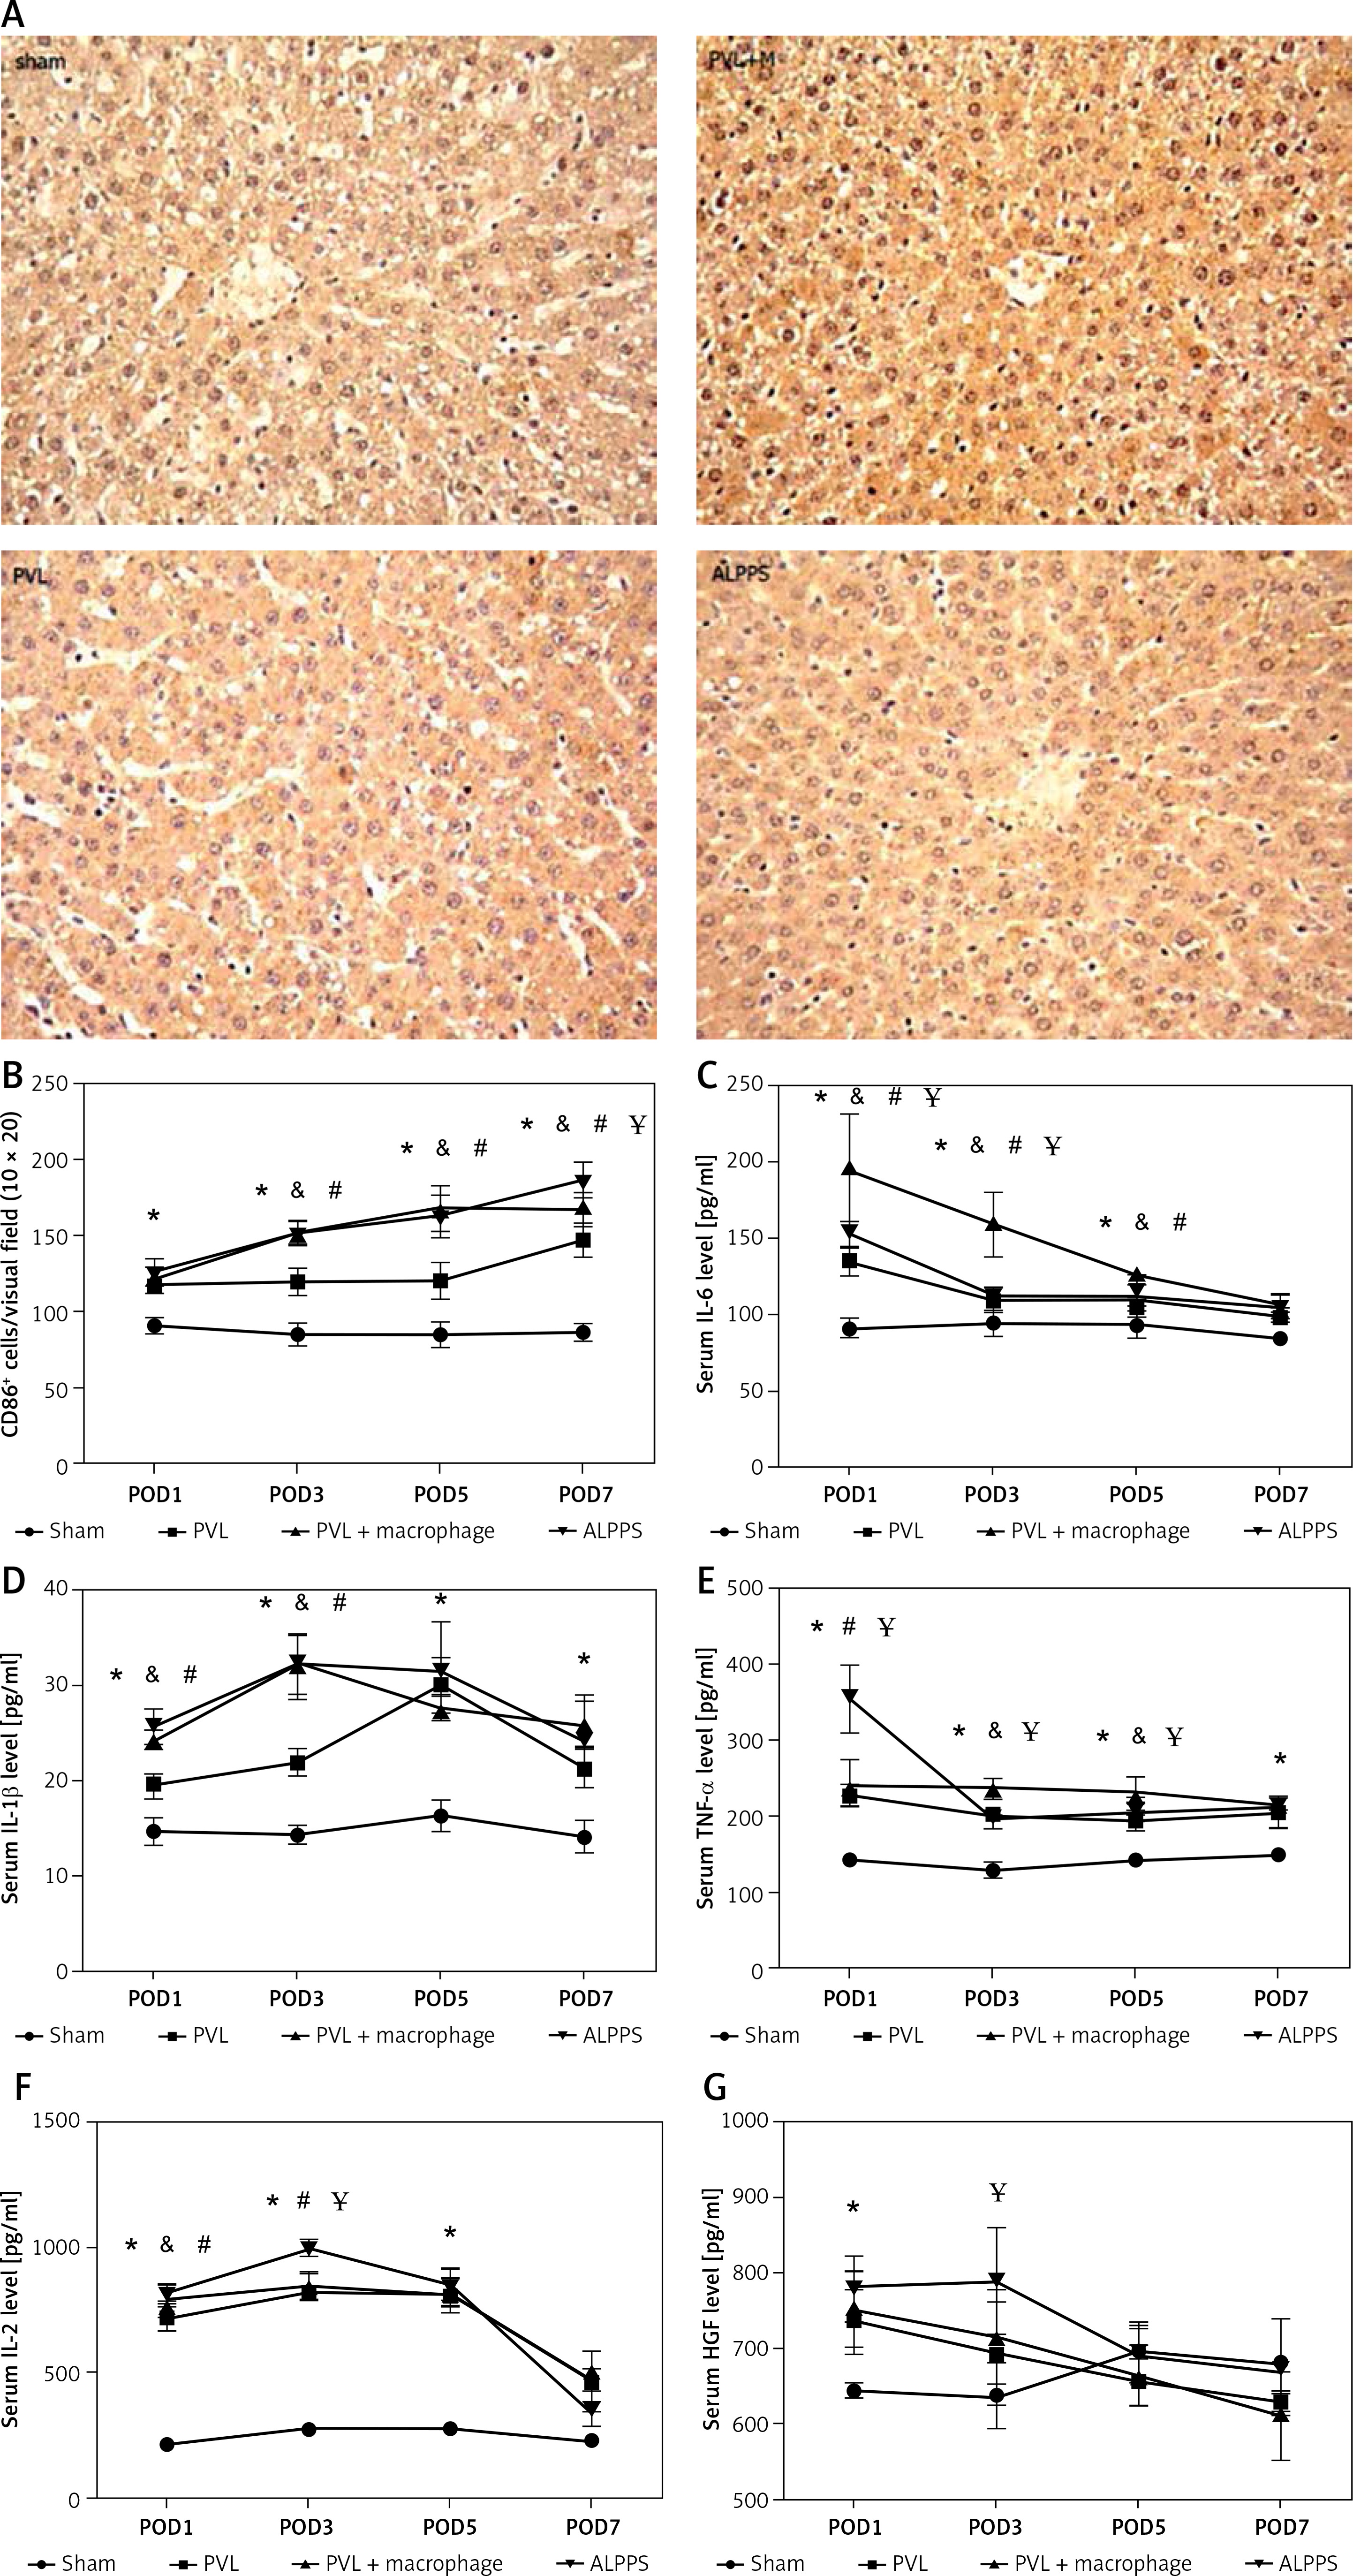
The serum levels of IL-6 and IL-1β were significantly elevated in the ALPPS and PVL/macrophage groups at POD1 and POD3 compared with those of the PVL group (p < 0.01) at the same time point. There were significant differences in levels of serum TNF-α (PVL group vs. ALPPS group) and IL-2 (PVL group vs. PVL/macrophage group) at POD1 (p < 0.01) and in the serum levels of IL-2 (PVL group vs. ALPPS group) and TNF-α (PVL group vs. PVL/macrophage group) at POD3 (p < 0.01). It was observed that the serum HGF levels of the three surgical groups were significantly higher than those of the sham group (p < 0.01), and there were no differences between the HGF levels of the surgical groups at any of the time points except in the ALPPS group, which had higher levels than the PVL/macrophage group at POD3 (p < 0.01) (Table II, Figures 1 C–G).
Table II
Protein levels of proinflammatory cytokines and HGF
| Variable | IL-6 [pg/ml] | TNF-α [pg/ml] | IL-2 [pg/ml] | IL-1β [pg/ml] | HGF [pg/ml]) |
|---|---|---|---|---|---|
| Sham: | |||||
| POD1 | 93.1 ±6.7* | 142.2 ±8.6* | 216.1 ±12.9* | 14.8 ±1.4* | 645.1 ±12.1* |
| POD3 | 92.2 ±8.3* | 131.5 ±11.2* | 280.3 ±26.5* | 14.5 ±1.0* | 637.0 ±45.3 |
| POD5 | 94.4 ±8.8* | 143.3 ±9.1* | 281.3 ±23.2* | 16.4 ±1.6* | 698.2 ±37.3 |
| POD7 | 85.1 ±4.3 | 155.1 ±5.2* | 232.1 ±22.0 | 14.2 ±1.6* | 679.2±62.1 |
| PVL | |||||
| POD1 | 137.0 ±8.4&# | 227.0 ±14.0# | 717.6 ±45.4& | 19.5 ±1.4&# | 743.0 ±45.1 |
| POD3 | 110.0 ±3.4&# | 213.1 ±8.6& | 818.6 ±20.9# | 22.0 ±1.5&# | 688.3 ±67.6 |
| POD5 | 109.9 ±10.4& | 194.8 ±12.4 | 816.8 ±40.4 | 30.2 ±2.9 | 657.0 ±31.5 |
| POD7 | 98.4 ±4.1 | 204.2 ±18.6 | 476.6 ±43.4 | 21.0 ± 2.0 | 628.8 ± 14.9 |
| PVL + macrophage: | |||||
| POD1 | 196.1 ±36.0Ɏ | 243.9 ±30.9Ɏ | 798.7 ±41.0 | 24.4 ±1.1 | 753.5 ±50.2 |
| POD3 | 159.9 ±20.7Ɏ | 238.3 ±11.9Ɏ | 848.9 ±50.0Ɏ | 32.1 ±3.3 | 714.4 ±62.4ξ |
| POD5 | 126.5 ±4.6Ɏ | 231.7 ±20.7Ɏ | 810.0 ±67.1 | 27.9 ±1.2 | 664.3 ±40.0 |
| POD7 | 108.3 ±5.5 | 212.2 ±8.1 | 463.7 ±119.0 | 26.0 ±2.4 | 612.0 ±58.1 |
| ALPPS: | |||||
| POD1 | 153.9 ±8.7 | 353.1 ±43.4 | 817.9 ±35.3 | 25.8 ±1.8 | 788.0 ±48.7 |
| POD3 | 115.4 ±4.2 | 196.9 ±11.1 | 998.3 ±30.8 | 32.4 ±3.1 | 798.9 ±21.4 |
| POD5 | 112.4 ±4.7 | 204.6 ±12.2 | 852.0 ±64.8 | 31.6 ±5.2 | 690.9 ±36.3 |
| POD7 | 105.9 ±3.8 | 223.4 ±6.9 | 339.7 ±44.8 | 24.3 ±4.8 | 677.1 ±5.2 |
In this rat surgical model, although both the PVL and ALPPS groups exhibited accelerated liver regeneration in the FLR compared with the sham group, ALPPS was more effective. The levels of IL-6, TNF-α, IL-1β, IL-2, and HGF were significantly elevated after ALPPS but not after PVL alone, suggesting that proinflammatory cytokines and HGF could play a vital role in accelerating liver regeneration after ALPPS. Previous studies using the rodent model of ALPPS strongly suggest that parenchymal transection induces an inflammatory response and releases proliferating factors, which in turn induces accelerated regeneration of the FLR [5–7]. To assess the effect of this accelerated regeneration, an injection of proinflammatory CD86+ macrophages was administered during the PVL procedure in the present study. It was found that the HRR of the PVL/macrophage group was higher than that of the PVL group at POD3, POD5, and POD7. In addition, the HRR in the PVL/macrophage group was similar to that of the ALPPS group at POD5. These results suggest that injection of proinflammatory CD86+ macrophages after PVL accelerates liver regeneration. To further explore whether the PVL/proinflammatory CD86+ macrophage procedure could have the same mechanisms as the ALPPS procedure in accelerating liver regeneration, the study measured the levels of IL-6, TNF-α, IL-1β, IL-2 and HGF in serum samples and CD86+ macrophages in the FLR.
In conclusion, proinflammatory CD86+ macrophages combined with PVL can induce accelerated liver regeneration comparable to the FLR growth seen after ALPPS. Proinflammatory cytokines secreted by CD86+ macrophages and the increased number of CD86+ macrophages in the FLR may play a role in the acceleration of FLR regeneration.