Introduction
Beta thalassaemia major (β-TM) is a congenital haemoglobinopathy with complications affecting many organs. Chronic anaemia due to ineffective erythropoiesis, hypoxia, frequent blood transfusions, and high serum iron levels despite iron chelation treatment are the most common problems seen in these patients. It is known that the ferroportin-hepcidin pathway plays an important role in the regulation of iron metabolism. The ferroportin-1 molecule is a protein that provides the release of iron molecule from tissues such as intestine and liver into blood according to the body’s needs. Hepcidin and hypoxia-induced factor 2α (HIF2α) molecules are involved in the regulation of ferroportin-1 molecule levels. In the literature about iron metabolism, it is stated that hepcidin hormone increases in periods when the serum iron level is high, and it causes a decrease in iron level by causing degradation of ferroportin [1]. The HIF2α molecule increases serum iron levels by increasing the gene expression of the ferroportin molecule, especially in the intestinal cells [2]. There are studies showing that high iron levels in β-TM patients are related to increased iron absorption due to impaired hepcidin-ferroportin pathway and chronic hypoxia, especially from the small intestine [3].
Ghrelin hormone is synthesised in many organs, especially in the fundus of the stomach, hypothalamus, pituitary, thyroid, small intestine, liver, kidney, heart, pancreas, and gonads. Regulating appetite, releasing growth hormone, producing an anti-insulinergic effect, and vasodilation are stated as physiological effects of the ghrelin hormone [4, 5]. Studies conducted in recent years have emphasised the relationship between serum ghrelin and iron levels. In most of these studies, the effects of ghrelin on iron metabolism were investigated in iron deficiency anaemia [6, 7]. There are few studies examining the interaction with ghrelin hormone in patients with high iron levels (haemoglobinopathy, etc.). The effects of ghrelin hormone on gonadal development in β-TM patients were examined, and it was emphasised that gonadal developmental failure may occur due to ghrelin hormone deficiency [8]. There are very few studies on ghrelin hormone and iron metabolism in the literature. In one study, it was reported that ghrelin peptide increased expression of the ferroportin-1 molecule in the liver and spleen [9].
In this study, we investigated the relationship between serum ghrelin, hepcidin, HIF2α, and ferritin levels in patients with β-TM. We aimed to contribute to the aetiopathogenesis of this disease by examining the changes in ghrelin hormone levels in patients with β-TM.
Material and methods
Fifty-two (24 males, 28 females) patients with β-TM and 23 (9 males, 14 females) healthy controls were included in this study. The volunteers included in the study group did not have any chronic diseases such as diabetes mellitus, hypertension, thyroidal, or renal diseases. In addition, iron deficiency anaemia was accepted as an exclusion criterion in the control group. Venous blood samples were taken from all volunteers in the morning after 10–12 h of fasting. The blood samples were taken from the patient group before transfusion. Each patient was on a regular transfusion program (every 2–4 weeks). The haemogram parameters (red blood cells – RBC, haemoglobin – Hb, Hct-haematocrit – Hct, mean corpuscular volume – MCV) from the blood samples were measured with an XN 1000 autoanalyzer (Sysmex Corp. Japan) using impedance and flow cytometry methods. Measurements of serum iron, total iron binding capacity (TIBC), unsaturated iron binding capacity (UIBC), total bilirubin, and direct bilirubin levels were performed spectrophotometrically with a fully automatic AU 5800 analyser (Beckman Coulter Inc., USA). Serum ferritin levels were measured by chemiluminescence method on a fully automatic DxI 800 analyser (Beckman Coulter Inc., USA). Serum ghrelin, HIF2α, and hepcidin levels were measured by ELISA method using the USCN ELISA kit (Cloud-clone Corp., Wuhan, China).
Statistical analysis
Descriptive statistics were presented with mean, standard deviation, median, and range of distribution values. The Kolmogorov-Smirnov test was used to determine the distribution of the collected data for each variable considered in the study. In the analysis of the difference between the data of the patient and control groups, the unpaired sample t-test was used for the data that fit the normal distribution, and the Mann-Whitney U test was used for the data that did not fit the normal distribution. Spearman test was used for correlation analysis between the 2 groups. P < 0.05 was considered statistically significant.
Results
A total of 75 subjects, including 52 patients with β-TM (24 men (46.1%), 28 women (53.8%)) and 23 healthy controls (9 (39.1%) men, 14 (61.9%) women) were included in this study. The mean age of the participants was 29.73 ±6.78 years in the patient group and 33.26 ±8.22 years in the control group. There was no significant difference between the groups in terms of age and gender. When the erythrocyte indexes of the patient group and the control group were compared, in the patient group the RBC levels were found to be significantly higher, while Hb, Hct, and MCV levels were found to be significantly lower (p < 0.05). In the comparison of the biochemical parameters of the patient group and the control group, serum iron, ferritin, total bilirubin, and direct bilirubin levels were significantly higher in the patient group (p < 0.05), while unsaturated iron blood capacity (UIBC) and TIBC levels were significantly lower in the patient group (p < 0.05) (Table I).
Table I
Comparison of CBC and biochemical parameters of patient and control groups. Mann-Whitney U test was used to compare the groups. Statistical significance was defined as p-value < 0.05
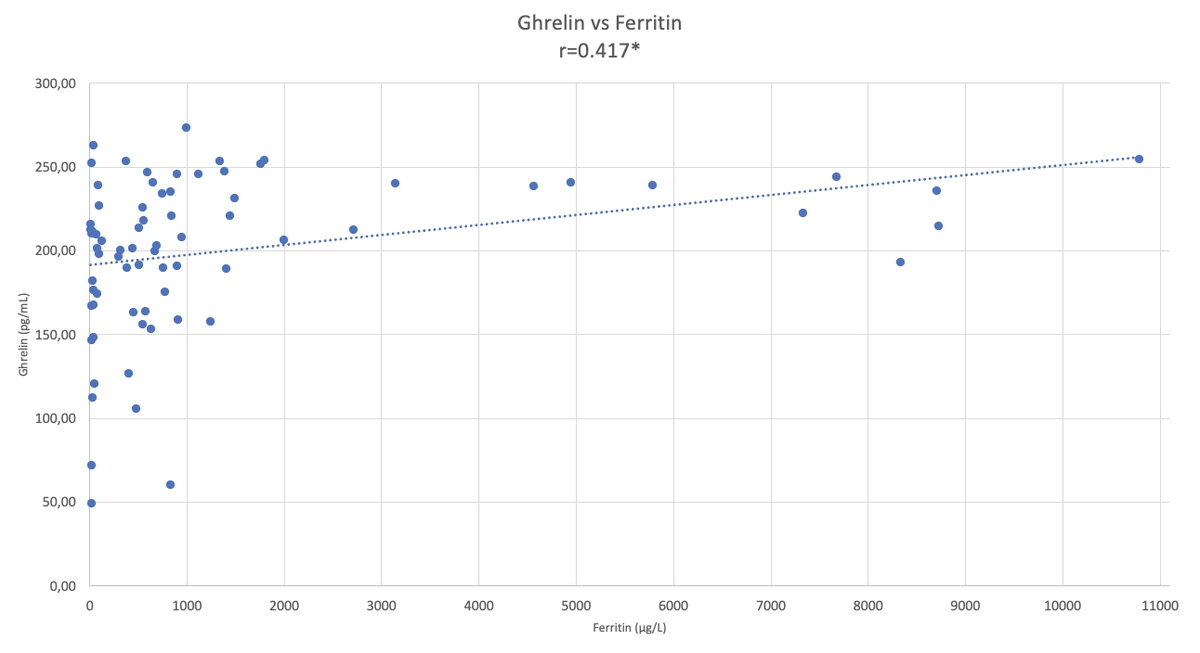
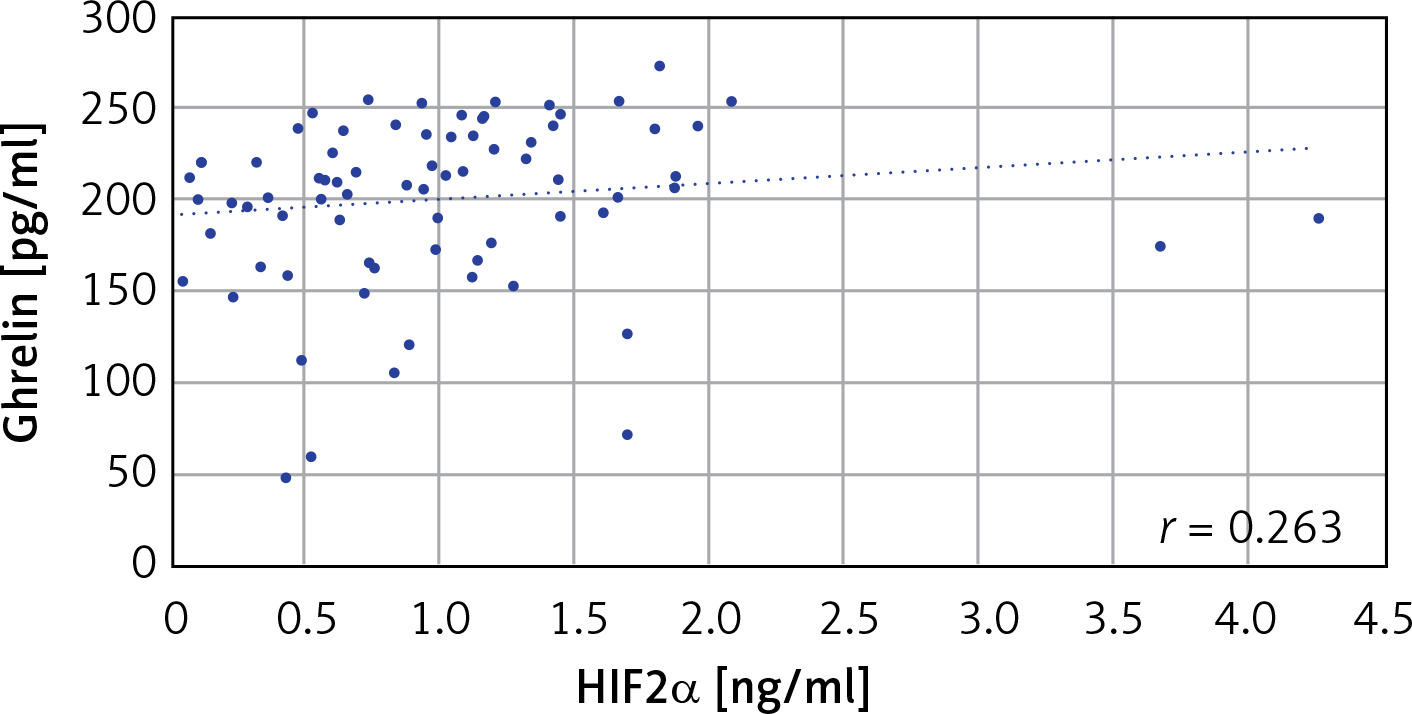
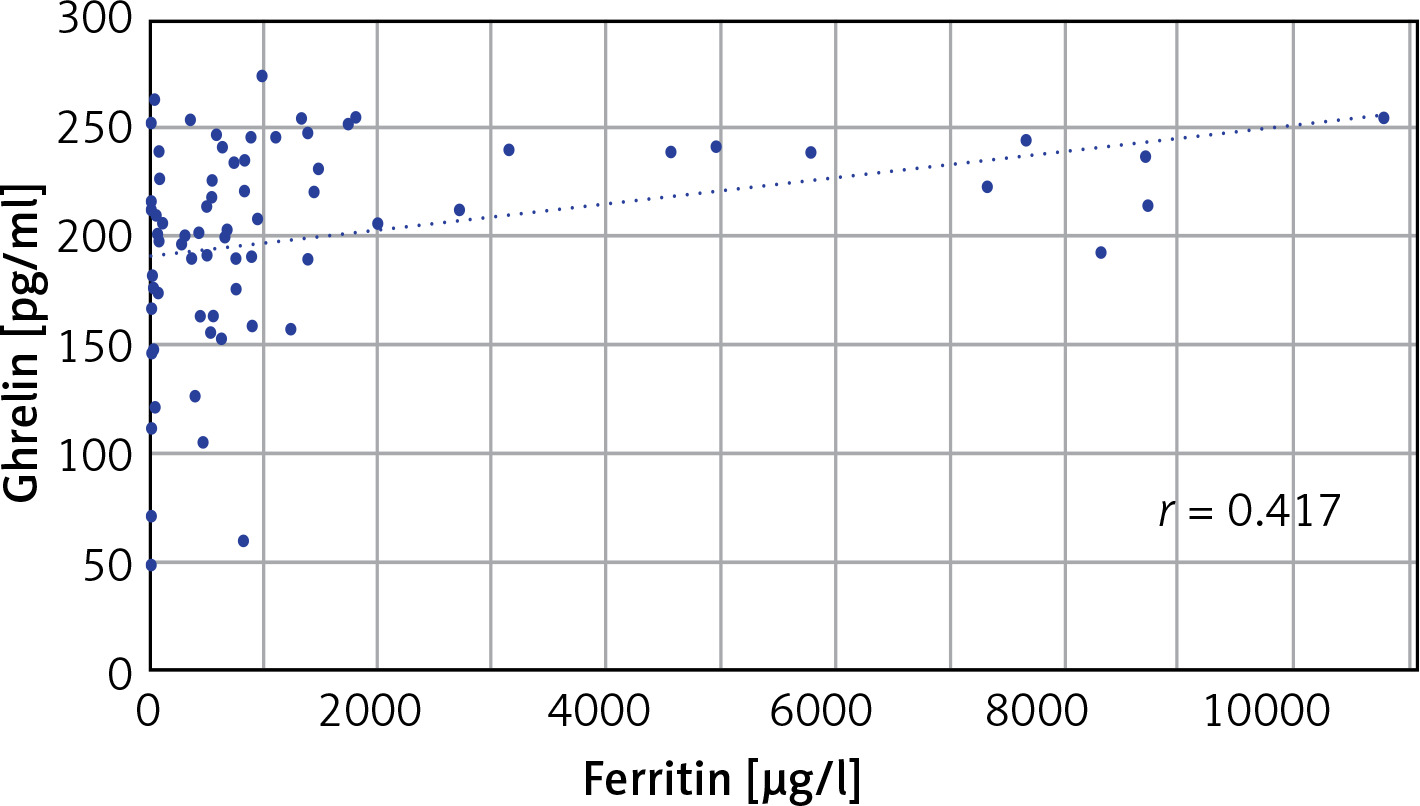
In the comparison of serum ghrelin, HIF2α, and hepcidin parameters of the patient and the control groups, ghrelin levels were found to be significantly higher in the patient group (p < 0.05). There was no significant difference in HIF2α and hepcidin levels between the patient and control groups (Table II). When the correlation between ghrelin-HIF2α, ghrelin-hepcidin, and HIF2α-hepcidin were examined, a weak positive correlation was found with ghrelin-HIF2α (r = 0.263) (p < 0.05) in all subjects (Table III, Figure 1), no significant correlation was found between these parameters in the control group (Table III), and a weak positive correlation was found with ghrelin-HIF2α (r = 0.285) (p < 0.05) in the patient group (Table III). When the correlations between ghrelin-iron, ghrelin-UIBC, ghrelin-TIBC, and ghrelin-ferritin were examined, a positive correlation was found between ghrelin-ferritin (r = 0.417) (p < 0.05) in all subjects (Table IV, Figure 2). Furthermore, a weak positive correlation was found with HIF2α-UIBC (r = 0.291) (p < 0.05) in the patient group. No significant correlation was found between other parameters in the patient and control groups. The correlation analysis of ghrelin, HIF2α, and hepcidin parameters with iron, UIBC, TIBC, and ferritin parameters is shown in Table IV.
Table II
Comparison of ghrelin, HIF2α, and hepcidin parameters of the patient and control groups. Mann-Whitney U test was used to compare the groups. Statistical significance was defined as p-value < 0.05
Table III
Correlation analysis between ghrelin, HIF2α, and hepcidin parameters. Spearman correlation test was used in the correlation analysis between groups. Statistical significance was defined as *p-value < 0.05
| Parameters | All subjects (n = 75) r | Control (n = 23) r | Patient (n = 52) r |
|---|---|---|---|
| Ghrelin-HIF2α | 0.263* | 0.108 | 0.285* |
| Ghrelin-hepcidin | –0.085 | –0.023 | –0.128 |
| HIF2α-hepcidin | 0.120 | –0.061 | 0.163 |
Table IV
Correlation analysis of ghrelin, HIF2α, and hepcidin parameters with iron, UIBC, TIBC, and ferritin parameters. Spearman correlation test was used in the correlation analysis between groups. Statistical significance was defined as *p-value < 0.05
Discussion
In β-TM, RBC indexes show hypochromic microcytic anaemia. Consistent with other studies in the literature, hypochromic microcytic anaemia was also found in the patient group of our study [10–13]. Increased erythrocyte production and homolysis in thalassaemia patients result in increased haemoglobin breakdown products. In some studies, the bilirubin results of thalassaemia patients were found to be high [14–16]. In our study, total bilirubin and direct bilirubin levels were found to be higher than the control group, which is consistent with the literature. Iron overload occurs in patients with β-TM due to repeated blood transfusions, ineffective erythropoiesis, progressive iron absorption from the gastrointestinal tract, and reticuloendothelial iron recycling. Regular transfusions can double the rate of iron accumulation [17]. Consistent with other studies in the literature, in our study, the serum iron level of the patient group was found to be statistically significantly higher than the control group [18–20]. Ferritin levels were found to be high due to iron load in thalassaemia [21–26]. In our study, serum UIBC and TIBC levels were found to be significantly lower and ferritin levels were found to be significantly higher in the patient group, consistent with the literature.
Hepcidin expression increases in iron overload and inflammation, and it decreases in iron deficiency and hypoxia states [26–28]. However, hepcidin production was found to be low despite iron overload in thalassaemia studies. A possible reason for this is the inhibition of hepcidin gene expression by factors such as erythroferrone (ERFE) [29–31]. ERFE is synthesised by erythroblasts upon erythropoietin (EPO) stimulation. ERFE is released into the circulation and attenuates hepcidin signal in response to iron. When anaemia causes hypoxia, other mediators such as platelet-derived growth factor-BB (PDGF-BB) released by different cell types also suppress hepcidin [32]. It is known that a low serum hepcidin level increases intestinal iron absorption and decreases iron stores in macrophages, leading to iron overload. Many studies have shown that low serum hepcidin levels in patients with β-TM can lead to increased levels of iron absorption and iron overload. As a therapeutic target, hepcidin may help manage iron overload in β-TM patients [17, 26]. Because some studies in the literature have shown that a moderate increase in hepcidin expression in β-thalassaemic mice limits iron overload, reduces the formation of reactive oxygen species and improves anaemia [33, 34]. In our study, serum hepcidin levels in the β-TM patient group did not show a statistically significant difference when compared to the control group. When we examined the correlation between hepcidin and iron parameters, no significant correlation was found in both groups. Contrary to expectations, the reason why hepcidin was not suppressed in the patient group may be the blood transfusion, which keeps the patients’ Hb at optimum levels and the administration of a controlled iron chelation therapy. The measurement of hepcidin at normal values, even in samples taken before transfusion, may be an indication that high hepcidin levels have been reached after treatment. This may reflect the effectiveness of treatment in our patient group. Under normal conditions, high hepcidin levels, which we expect in the case of iron overload, can be used as an indicator of effectiveness of response to treatment.
HIF2α plays an important role in enterocyte iron uptake and is the primary regulator of EPO production [35]. HIF1α is activated in response to acute hypoxia, while HIF2α is associated with chronic hypoxia [36]. Intestinal HIF2α is a critical regulator of iron absorption in cases of iron deficiency, erythropoiesis, and hepcidin deficiency [37, 38]. Intestinal HIF2α is critical in patients with β-thalassaemia, as anaemia has been shown to induce intestinal hypoxia, and excessive iron absorption significantly contributes to iron overload. In the literature, intestinal HIF2α has been shown to be elevated in diseases with iron overload [37, 39]. In our study, when serum HIF2α levels in the thalassaemia major patient group were compared with the HIF2α levels in the control group, no significant difference was observed. This may be because the hepcidin levels were not suppressed in the patient group. This may lead us to think that the ongoing treatments of the patient group are effective. In addition, the mean Hb levels of our patients were measured to be 8.9 g/dl. These Hb levels may not have caused an increase in the synthesis of HIF2α. When we examined the correlation between HIF2α and iron parameters, no significant correlation was found in the control group. In the patient group, we found a significant correlation with HIF2α-UIBC. The reason for this may be that UIBC decreases as a result of increased iron demand despite iron load in β-TM patients, and that increased iron demand is a stimulus for HIF2α.
There are studies in the literature investigating the relationship between ghrelin and anorexia seen in iron deficiency anaemia (IDA) [40–42]. It has been shown that both ghrelin and iron content decrease in IDA, and a significant positive correlation was found between the 2 parameters. In addition, it has been shown that both ghrelin and iron levels are significantly lower in prepubertal children with IDA compared to controls. Another study showed that hepcidin and serum ghrelin, which are the main regulators of systemic iron homeostasis, increased with iron treatment in children with IDA, suggesting that iron treatment plays an important role in hepcidin and ghrelin synthesis [9, 41, 42]. These findings suggest that iron plays a role in ghrelin synthesis.
Investigation of ghrelin levels in patients with β-TM is important to learn the place of ghrelin in iron metabolism. In the literature, there is a study investigating the effect of ghrelin on puberty and reproductive function in β-TM patients. In this study, it is stated that serum ghrelin levels were lower compared to the control group. Researchers stated that low ghrelin level is related to growth and development retardation during puberty in β-TM patients [8]. In another study, Karamifar et al. investigated leptin and ghrelin levels and their relationship with short and lean body structure in β-TM and thalassaemia intermedia patients. Ghrelin levels were found to be significantly higher in the β-TM patient group compared to the control group. They stated that the reason for this may be a compensatory response to growth retardation or a partial resistance that causes an increase in ghrelin levels [43]. Unfortunately, we could not find any study in the literature investigating ghrelin levels in β-TM patients, except for these 2 studies. In our study, we found that serum ghrelin levels were significantly higher in the patient group (Table II). Conversely, Moshtaghi-Kashanian et al. found lower levels of ghrelin in their study [8]. On the other hand, the study by Karamifar et al. found higher levels of ghrelin in the patient group, which supports our study [43]. The different results between these 2 studies may be due to the difference in age distribution of the β-TM patients included in the study.
Although we found that there are many studies in the literature about changes in HIF2α, hepcidin, and ferroportin levels in iron absorption in patients with β-TM, we could not find any study examining the relationship between ghrelin and iron metabolism. Investigating the relationship between ghrelin and iron metabolism, Luo et al. conducted their studies in cell culture in mice. This study showed that ghrelin increased the expression of GHSR1α, GOAT, hepcidin, ferritin light chain, and ferroportin1 in the spleens of mice [9]. This study, which showed that ghrelin increased ferroportin expression, led us to think that ghrelin plays a role in iron metabolism. It is known that HIF2α plays a role in the synthesis of ferroportin. HIF2α and ferroportin levels play an important role in iron absorption in patients with β-TM.
In this study, we tried to contribute to the metabolism of iron absorption in patients with β-TM major by examining the relationship between HIF2α, hepcidin, and ghrelin levels. When we examined the correlation between ghrelin and iron parameters (iron, UIBC, TIBC, and ferritin) in our study, no significant correlation was found in the control group. In the patient group, we found a significant positive correlation between serum ghrelin and ferritin (Table IV). This finding made us to think that there is a relationship between ghrelin synthesis and ferritin levels. When we compare our findings with the literature, there are many publications about iron deficiency anaemia in which ferritin and ghrelin levels increase with iron treatment. The low ghrelin levels in iron deficiency anaemia and the increase in ghrelin levels with subsequent treatments suggested that iron is required for ghrelin synthesis.
In conclusion, we think that hepcidin, HIF2α, and ghrelin can be examined in more details by cell culture studies using intestinal cells to explain the iron absorption metabolism in patients with β-TM. Further clinical studies are needed in larger patient groups.
Limitations: The patient group participating in our study comprised an adult group between the ages of 18 and 45 years and undergoing treatment. Therefore, hepcidin, HIF2α, and ghrelin levels may not be sufficient to show the main effects in β-TM disease. Our study used blood samples taken before planned blood transfusion according to the treatment protocol in patients with β-TM. Therefore, the data on hepcidin HIF2α and ghrelin levels coincide with the period when patient values are most irregular. Since blood was not taken from the same people again after the treatment, we cannot comment on the change of these parameters with the treatment. Since our study was based on serum samples, we could not demonstrate the interaction of hepcidin, HIF2α, and ghrelin at the cellular level.