Introduction
Vitamin D is a lipid-soluble hormone that is mostly synthesised from skin when exposed to ultraviolet B irradiation (280–320 nm) from sunlight [1]. A minor source of vitamin D could be derived from dietary intake of fish, cereals, dairy products, and vitamin D supplements [2]. Vitamin D has been known to be associated with calcium metabolism and bone mineralisation [3]. Vitamin D deficiency results in osteomalacia, osteoporosis, and increased risk of fractures [3]. However, recent data from various studies has demonstrated that vitamin D deficiency may be associated with several chronic diseases including cancer, infections, autoimmune disease, cardiovascular disease (CVD), diabetes mellitus, and microbial infection [4–8].
Several mechanisms of vitamin D in developing CVD have been proposed. Previous studies have supported that vitamin D plays an important role in reducing the risk of CVD by inhibiting the renin–angiotensin system, reducing parathyroid hormone levels, decreasing coagulation, reducing inflammation, and then reducing atherosclerosis and increasing insulin production [9]. In addition, vitamin D could prevent CVD through the regulation of several genes that are involved in cellular differentiation, proliferation, apoptosis, and angiogenesis [3]. Moreover, another proposed mechanism for the protective effect of vitamin D on CVD is the regulation of lipid profiles. Several cross-sectional studies have reported an association between vitamin D and lipid levels [10–26]. Nevertheless, some reports have shown that there is no association between vitamin D and lipid levels [27, 28]. Thus, the relationship between 25-hydroxyvitamin D (25[OH]D) levels and serum lipids is inconsistent among various studies.
In Southern Thailand, dyslipidaemia, which is an independent modifiable risk factor for CVD [29, 30], has been found to affect more than 50% of people [31]. Additionally, the prevalence of vitamin D deficiency (6.30% to 6.91%) and vitamin D insufficiency (43.74% to 43.80%) is highest when compared with other regions of Thailand [32, 33]. This may be due to the Southern Thai population having a higher percentage of Muslims [33]. Furthermore, the association between vitamin D status and lipid levels has not been reported yet in Southern Thailand. Thus, the aim of this study was to evaluate the relationship between 25(OH)D levels and serum lipids among the Southern Thai population.
Material and methods
Study subjects
The study group included 726 individuals from the Kiriwong and Bansakha districts of Nakhon Si Thammarat in Southern Thailand. Body mass index (BMI) and waist circumference (WC) were recorded. Systolic blood pressure and diastolic blood pressure were measured. Body composition including body fat percentage, fat mass, fat free mass (FFM), muscle mass, and visceral fat rating were all measured using Bioelectric Impedance Analysis, Tanita SC-330 (Tanita Corp, Japan). Exclusion criteria for subjects were the presence of chronic disease, thyroid disease, renal or hepatic disease, the use of hormone replacement therapy or lipid lowering agents, and drug abuse. The study protocol was approved by the Ethics Committee of Walailak University (protocol no. 14/101). Written informed consent was obtained from all subjects before being included in the study.
Data collection
Demographic data were obtained using a questionnaire. The questionnaire was conducted by well-trained interviewers and contained information on age, gender, smoking (yes, no), alcohol intake (current, former, never), physical activity (yes, no), education (Bachelor, secondary school, primary school, none), residential area (coastal, inland), religion (Buddhist, Muslim), intake of multivitamins (yes, no), intake vitamin D supplements (yes, no), intake of fish oil (yes, no), frequency of milk consumption (daily, ≥ 1 to 6 days per week, no), use of sunscreen (yes, no), sunlight exposure (< 30 min/day, ≥ 30 min/day), chronic diseases, medications, and family history of diseases.
Laboratory analysis
Blood samples were collected from subjects after 12 h fasting. The serum and plasma were separated by centrifugation at 3000 rpm for 10 min. Serum total cholesterol (TC), high-density lipoprotein cholesterol (HDL-C), and triglycerides (TG) were measured using the standard enzymatic method. Low-density lipoprotein cholesterol (LDL-C) was calculated using the Friedewald formula. Fasting plasma glucose (FPG) was measured using glucose oxidase method. All tests were performed by using a Konelab analyser (KONELAB 20, Tokyo, Japan). Serum 25(OH)D levels were measured with an electrochemiluminescent immunoassay (VITROS® 25-OH Vitamin D Total Assay) on an automated machine (Vitros ECi, Johnson and Johnson, Rochester, NY, USA).
Diagnostic criteria
Dyslipidaemia was defined according to the NCEP ATPIII guidelines [34]. High TC was defined as TC ≥ 200 mg/dl, high TG was defined as a serum TG level ≥ 150 mg/dl, high LDL-C was defined as serum LDL-C ≥ 130 mg/dl, and reduced HDL-C was defined as serum HDL-C < 40 mg/dl in men and HDL-C < 50 mg/dl in women. Based on an Endocrine Society Clinical Practice Guidelines [35], 25(OH)D of 30 ng/ml or greater was defined as sufficient, 25(OH)D of 20 to 29.9 ng/ml was defined as insufficient, and 25(OH)D of less than 20 ng/ml was defined as vitamin D deficient. Hypovitaminosis D was defined as 25(OH)D of less than 30 ng/ml.
Statistical analysis
All data were analysed using SPSS (SPSS Inc., Chicago, IL; Version 17). Data were tested for normality. Continuous variables were expressed as mean, and standard deviation and categorical variables were presented as a percentage. Differences between 2 groups were tested using Student’s t-test for parametric, Mann-Whitney U Test for non-parametric for continuous variables, and the χ2 test for categorical variables. Partial correlation analysis was used to assess the relation between serum 25(OH)D and biochemical parameters after adjusting for age. Multiple linear regression analysis was used to evaluate the independent effect of lipids, FPG, and BMI on serum 25(OH)D after adjusting for the confounders. The association of vitamin D status and dyslipidaemia was evaluated using logistic regression analysis. Confounders included the following: age, smoking, alcohol intake, physical activity, education, residential area, religion; intake of multivitamins, vitamin D supplements, or fish oil; milk consumption, the use of sunscreen, and sunlight exposure. A p-value < 0.05 was considered statistically significant.
Results
Characteristics of the study subjects are summarised in Table I. The demographic characteristics of the study subjects are shown in Supplementary Table SI. A total of 726 subjects participated, of whom 19.97% were men and 80.03% were women. The age of the subjects ranged from 19 to 84 years. Men had significantly higher 25(OH)D levels, visceral fat, FFM, muscle mass, and bone mass, but lower BMI, percentage fat, and fat mass, compared with women. There were no significant differences in other parameters.
Table I
Characteristics of the study population
[i] BMI – body mass index, WC – waist circumference, SBP – systolic blood pressure, DBP – diastolic blood pressure, FPG – fasting plasma glucose, TC – total cholesterol, TG – triglyceride, HDL-C – high-density lipoprotein cholesterol, LDL-C – low-density lipoprotein cholesterol, FFM – fat free mass, 25(OH)D – 25-hydroxyvitamin D. Data are presented as mean ± standard deviation.
A comparison of characteristics of different vitamin D statuses according to gender is shown in Supplementary Table SII. The vitamin D status was categorised into 2 groups of hypovitaminosis D and vitamin D sufficiency because of the low number of subjects with vitamin D deficiency, particularly in men. BMI, WC, TC, TG, LDL-C, visceral fat, percentage fat, fat mass, FFM, muscle mass, and bone mass were significantly higher in hypovitaminosis D compared to vitamin D sufficiency in women. Moreover, the prevalence of hypertriglyceridaemia and reduced HDL-C was significantly higher in hypovitaminosis D compared to vitamin D sufficiency in women. However, these parameters were not significantly different in men.
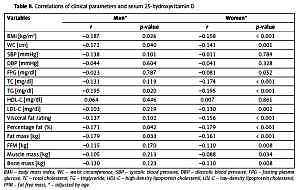
The correlations of clinical parameters and serum 25(OH)D are shown in Table II. 25(OH)D was negatively correlated to BMI, WC, TG, percentage fat, and fat mass in both men and women after adjusting for age, whereas 25(OH)D was negatively correlated to TC, LDL-C, visceral fat rating, FFM, and bone mass only in women after adjusting for age. Multiple linear regression analysis was used to assess the independent factors of lipids, FPG, and BMI on serum 25(OH)D concentrations after controlling for confounders, as shown in Supplementary Table SIII. TC and BMI were significant independent predictors for 25(OH)D concentrations in women.
Table II
Correlations of clinical parameters and serum 25-hydroxyvitamin D
| Variables | Men* | Women* | ||
|---|---|---|---|---|
| r | P-value | r | P-value | |
| BMI [kg/m2] | –0.187 | 0.026 | –0.158 | < 0.001 |
| WC [cm] | –0.172 | 0.040 | –0.141 | 0.001 |
| SBP [mm Hg] | –0.138 | 0.101 | –0.011 | 0.784 |
| DBP [mm Hg] | –0.044 | 0.604 | –0.041 | 0.328 |
| FPG [mg/dl] | –0.023 | 0.787 | –0.081 | 0.052 |
| TC [mg/dl] | –0.131 | 0.119 | –0.174 | < 0.001 |
| TG [mg/dl] | –0.195 | 0.020 | –0.195 | < 0.001 |
| HDL-C [mg/dl] | 0.064 | 0.446 | 0.007 | 0.861 |
| LDL-C [mg/dl] | –0.103 | 0.219 | –0.130 | 0.002 |
| Visceral fat rating | –0.137 | 0.102 | –0.156 | < 0.001 |
| Percentage fat (%) | –0.171 | 0.042 | –0.179 | < 0.001 |
| Fat mass [kg] | –0.179 | 0.033 | –0.161 | < 0.001 |
| FFM [kg] | –0.115 | 0.170 | –0.110 | 0.008 |
| Muscle mass [kg] | –0.105 | 0.213 | –0.088 | 0.034 |
| Bone mass [kg] | –0.130 | 0.123 | –0.110 | 0.008 |
Logistic regression analysis of 25(OH)D levels and dyslipidaemia is shown in Table III. Multivariate logistic regression analysis showed that the odds ratio of hypertriglyceridaemia and reduced HDL-C were significantly lower in vitamin D sufficiency when compared with hypovitaminosis D (p < 0.05) after adjusting for confounders in women.
Table III
Odds ratio of dyslipidaemias by serum 25-hydroxyvitamin D levels
[i] 25(OH)D – 25-hydroxyvitamin D, LDL-C – low-density lipoprotein cholesterol, HDL-C – high-density lipoprotein cholesterol, *adjusted for age, body mass index, smoking, alcohol intake, physical activity, education, residential area, religion; intake of multivitamin, fish oil, or vitamin D supplement; milk consumption, the using of sunscreen, sunlight exposure.
Discussion
The present study expanded on our prior work that showed the association between the VDR polymorphisms and MetS, as well as serum 25(OH)D levels in the Thai population [36] by investigating the association between vitamin D status and lipid profiles in Thai subjects. In this study, high serum 25(OH)D levels were associated with a decreased risk for hypertriglyceridaemia and reduced HDL-C, particularly in women. Our results were consistent with previous studies of Chinese [11] and Korean Adults with prediabetes [12], and Canadian adults [13] in whom the highest serum 25(OH)D level showed a significant decrease in the prevalence of hypertriglyceridaemia and/or reduced HDL-C.
In addition, serum 25(OH)D was negatively correlated with TC, TG, and LDL-C levels in women, and negatively with TG in men after adjusting for age. Our findings were consistent with several previous studies in China [10, 14], Japan [15], Poland [16], the USA [17, 18], Korea [12], Finland [19], Germany [20], adults of European descent [21], Hispanic American adolescents [22], and a study from the US National Health and Nutrition Examination Survey 2001–2006 [23] in which serum 25(OH)D concentrations were inversely correlated with TC, and/or TG, and/or LDL-C after adjusting for confounders.
In contrast, the 25(OH)D concentrations were found to be positively correlated with apoA-I and/or HDL-C concentrations in British Bangladeshis [24], patients in the USA [17], and Black American and Caucasian children [25]. Moreover, the 25(OH)D concentration was also found to be positively correlated with TC, and/or LDL-C levels in China [10], and obese adolescent women [26]. Nevertheless, some studies demonstrated no association between serum 25(OH)D and LDL-C, and HDL-C levels, as well as lipid profiles in postmenopausal women [27] and Iranian children and adults [28].
In this study, BMI, WC, visceral fat rating, percentage fat, and fat mass were significantly higher in hypovitaminosis D compared to vitamin D sufficiency in women. In addition, there was a negative correlation between serum 25(OH)D levels and BMI, WC, visceral fat rating, percentage fat, and fat mass in women. Our findings were consistent with the previous studies in which the inverse correlation between serum 25(OH)D and BMI, and/or adiposity was observed in black and white adolescents in the USA [37], Hispanic and African American adults [38], adults in the Framingham Heart Study [39], and young women in Canada [40]. This is probably due to the decreased bioavailability of vitamin D because vitamin D is fat soluble and can be deposited in adipose tissue [41]. Nevertheless, no association between plasma 25(OH)D and body adiposity was observed in adolescent girls in China [42], nor in children and adolescents in the USA [43]. Altogether, we suggest that such inconsistent results between serum 25(OH)D and lipid levels and body composition may result from several factors, e.g. age, gender, BMI, menopausal status, underlying diseases, ethnicity, environmental factors, and genetic factors.
Although, the mechanism in which vitamin D affects lipid levels is still unclear, several mechanisms have been proposed. First, vitamin D could affect serum lipids by enhancing intestinal calcium absorption and result in increased serum calcium. The increased calcium level may reduce formation and secretion of hepatic TG and intestinal absorption of fatty acid [44]. Second, serum calcium could enhance faecal fat excretion and the secretion of bile acids and then may reduce the cholesterol levels [45, 46]. Third, low serum 25(OH)D concentrations were associated with increased parathyroid hormone concentrations. Hyperparathyroidism promoted lipogenesis in adipocytes, decreased lipolysis, decreased lipoprotein lipase activity, decreased peripheral removal of TG, and activated microsomal TG transfer protein, which leads to TG elevation [44, 47]. Fourth, vitamin D deficiency was found to be associated with impaired β-cell function and insulin resistance, which leads to an increase in TG level and a decrease in HDL-C level [48]. Finally, vitamin D can regulate the lipid levels through the increased expression of VLDL receptor gene [49].
In the present study, the association between 25(OH)D levels and serum lipids was more pronounced in women than in men. This may be due to the low number of men, which is one of the limitations in this study. In addition, behaviour lifestyles that may influence serum lipids and 25(OH)D levels may be different among genders. Moreover, the prevalence of hypovitaminosis D in men was also significantly lower than in women (28.28% vs. 59.38%, respectively, p < 0.001). Another limitation is the study’s cross-sectional design; thus, it may not prove the cause and effect of the relationship between serum vitamin D and lipid profiles. However, our study has a clear strength because it recorded several confounders for vitamin D status.
In conclusion, vitamin D sufficiency may reduce the risk for hypertriglyceridaemia and reduced HDL-C, particularly in women, suggesting that vitamin D sufficiency may have beneficial effects on lipid levels and a decreased risk for CVD in Thai women.