Introduction
Depression is a prevalent mental illness that significantly impacts psychological and social well-being, leading to a decrease in quality of life. It is estimated that around 300 million individuals globally are affected by depression. The Global Burden of Disease study (GBD) has garnered global recognition since 2000, highlighting depression as a major burden comparable to other well-known physical diseases [1].
The burden of depressive disease is measured using disability-adjusted life years (DALYs) in the Global Burden of Disease Study. In 2019, depression accounted for the largest proportion of DALYs caused by mental disorders at 37.3%, followed by anxiety disorder at 22.9% [2]. Depression contributes to 1.85% of all DALYs globally, with major depressive disorder (MDD) accounting for 1.47%. Approximately 185 million people worldwide suffer from severe depression, impacting various aspects of their lives. Depression is associated with clinical conditions [3], such as abnormalities in the hypothalamic-pituitary-adrenal (HPA) axis [4], estrogen [5], and more. Epidemiological studies reveal a significant gender difference in depression incidence [2], with women having a much higher rate at 170.4 per million people compared to men. Various factors, including biology, emotions, cognition, and socio-cultural aspects, contribute to women being more susceptible to severe depression [6, 7]. At the individual level, socioeconomic status (SES) factors such as educational attainment, income, and occupational status are also significantly associated with depression risk [8, 9]. These micro-level factors, often obscured in macro-level analyses, may mediate the impact of broader socio-economic conditions on mental health outcomes.
Depression, despite being treatable with psychotherapy and antidepressant medication [10], continues to be a significant public health concern for women of childbearing age worldwide. With the current global focus on mental health issues, it is crucial to stay informed about the trends in depression incidence rates to inform public health policies and medical services effectively [11]. This study utilized the 2019 Global Burden of Disease data to analyze variations in global depression incidence and DALY rates among women of childbearing age based on year, age group, and socio-economic status [12].
Material and methods
Data sources
The Global Burden of Disease Study 2019 conducted an estimation of the incidence rate of depression among women of childbearing age across 204 countries, 21 regions, and 20 age groups starting from 1990. Using the Bayesian meta-regression tool DisMod-MR 2.1, all relevant information on depression was gathered, including data from published literature, monitoring, surveys, hospitals, clinics, and other sources [13]. The statistical codes for GBD estimation are publicly available online. The incidence rate is standardized by age using the GBD reference population [14]. This analysis provides details such as the number of cases, age-standardized incidence rate (ASIR), and DALYs. This study is based on a publicly available database and does not require ethical approval.
Social and Economic Development Index
The Socio-demographic Index (SDI) serves as a comprehensive indicator of a country’s distribution of per capita income, average years of education, and fertility rate among women under 25 years old, offering a holistic assessment of socio-economic development. The GBD study applied the Human Development Index method to calculate the composite SDI by taking the geometric mean of these three covariates [15]. The 2019 national level SDI estimate was then used to establish the threshold value for categorizing the data into quintiles. SDI values range from 0 to 1, with higher values indicating better socio-economic development. Based on the SDI, the study spatially segmented the research sample into Low SDI, Low-Middle SDI, High-Middle SDI, and High SDI categories based on the social development status of 21 regions and 204 countries.
Statistical analysis
Age standardization based on the GBD reference population was used to account for changes in population size and age structure. Point estimates and 95% confidence intervals (CI), representing the 25th and 97.5th percentiles in the distribution, were extracted to illustrate the uncertainty of the estimates. A linear regression model and natural logarithmic transformation were employed to assess the trend of the age-standardized rate (ASR) over a specific time interval. The goodness of fit of the model was evaluated by checking for bias. The model assumes a linear relationship between the natural logarithm (Y) of ASIR and historical years (X), with the random error (ε). The equation used for this relationship is Y = α + βX + ε, where β indicates the direction and magnitude of ASIR trends. The annual percentage change (EAPC) is calculated as EAPC = 100 × (exp(β) – 1). A positive EAPC with a low confidence interval (CI) suggests an upward trend in ASR, while a negative EAPC with a high CI indicates a downward trend in ASR. The linear model provides a 95% CI. All statistical analyses were performed using R version 4.05 and visualized using ggplot2.
Results
Trends in the burden of depression among women of childbearing age from 1990 to 2019
The global incidence of depression in women of childbearing age rose from 77,558,029.60 in 1990 to 106,384,438.29 in 2019, marking an 86% increase. The ASIR per 100,000 women was 5,875.89 in 1990 and 5,442.47 in 2019, with an EAPC of -0.53. Furthermore, the number of DALY cases of depression in women of childbearing age globally increased from 12,376,479.11 in 1990 to 17,322,159.90 in 2019. The EAPC of the age-standardized DALY rate per 100,000 women decreased from 941.77 in 1990 to 884.70 in 2019.
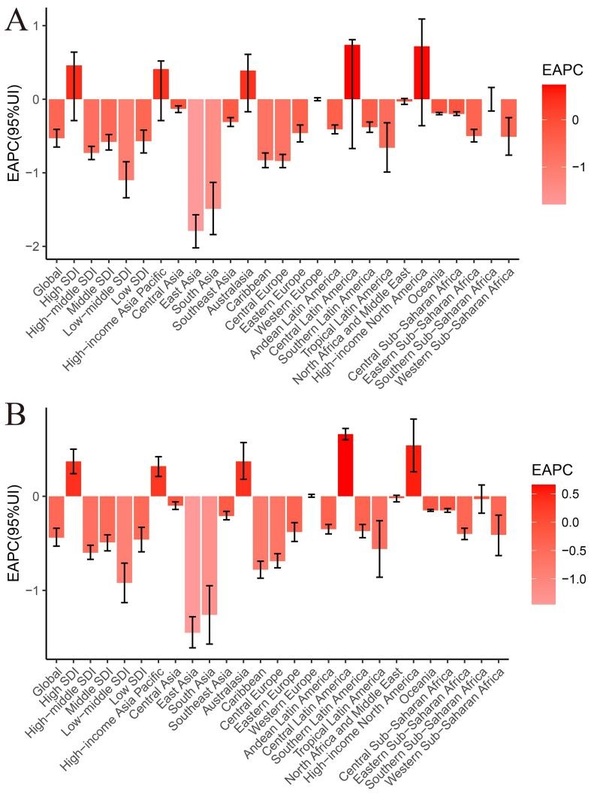
From 1990 to 2019, the ASIR of depression in women of childbearing age exhibited notable fluctuations across the three subgroups of SDI. The High SDI region experienced the most significant increase (EAPC = 0.46), whereas the largest decrease was observed in the Low-Middle SDI region (EAPC = –1.10). With the exception of the High SDI region (EAPC = 0.37), all SDI regions consistently displayed declining trends in age-standardized DALY rates. Across different countries and regions, there was a gradual decrease in ASIR and age-standardized DALY rates as SDI increased to 0.56, followed by an increase as SDI continued to rise. Notably, based on SDI alone, Greenland exhibited much higher ASIR and age-standardized DALY rates than anticipated, whereas Myanmar showed considerably lower rates than expected (Figure 1).
Figure 1
Association between age-standardized incidence and age-standardized DALY and SDI by region and country in 2019. A – Association between age-standardized incidence and SDI by region and country in 2019. B – Association between age-standardized DALY and SDI by region and country in 2019
Among the 21 geographical regions, Central Latin America had the highest EAPC for ASIR and DALY from 1990 to 2019, with EAPC values of 0.74 and 0.66, respectively. In contrast, the East Asia region had the lowest EAPC, with values of –1.79 and –1.45 for ASIR and DALY, respectively (Tables I and II, Figure 2). When considering 204 countries, Mexico, Spain, and Germany exhibited the highest increase in both ASIR and age-standardized DALY rate. Specifically, the EAPC for depression ASIR among women of childbearing age was 1.55, 1.46, and 1.17 for these countries, respectively. Similarly, the EAPC for depression age-standardized DALY rate among the same demographic was 1.40, 1.29, and 1.01, respectively. Conversely, Singapore, Cuba, and India displayed the greatest decrease in ASIR and age-standardized DALY rate among women of childbearing age, with EAPC values of –2.24, –2.24, and –1.89 for ASIR, and –2.11, –2.06, and –1.60 for age-standardized DALY rate (Table I, Supplementary Tables SI, SII, Figure 2).
Table I
Global depression DALY and corresponding EAPC among women of childbearing age in 1990 and 2019
Table II
Global incidence of depression in women of reproductive age and corresponding EAPC in 1990 and 2019
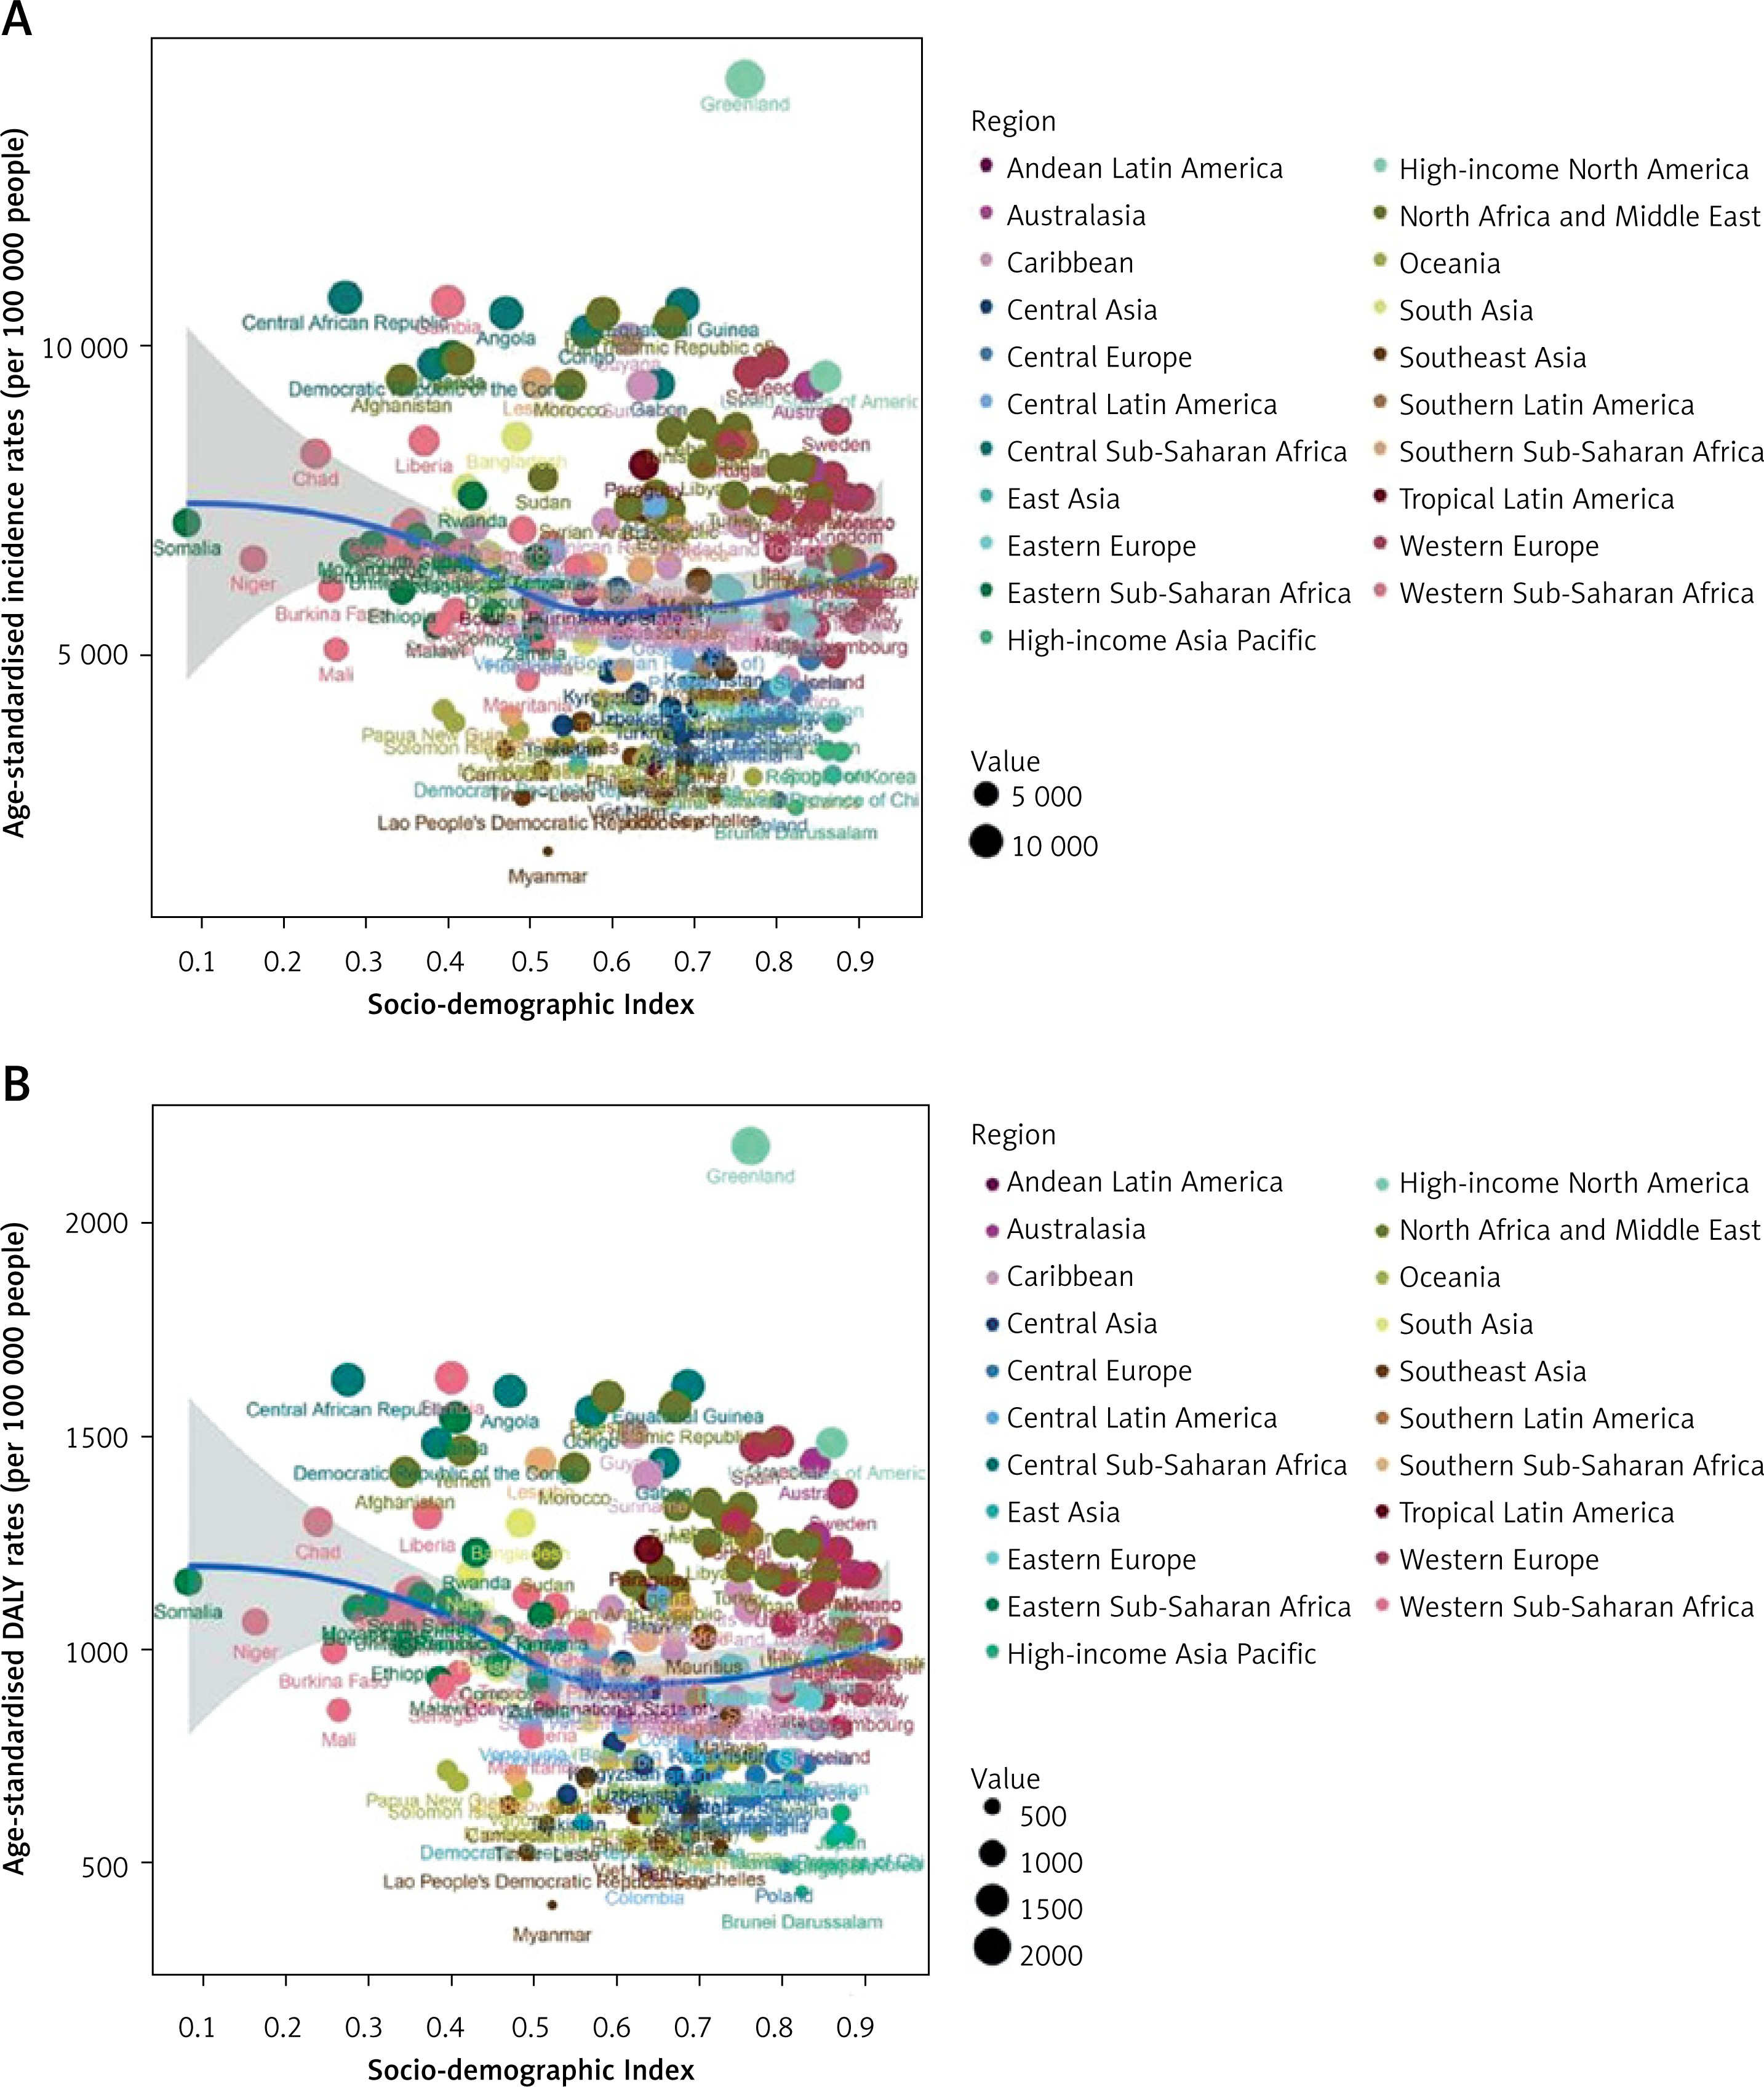
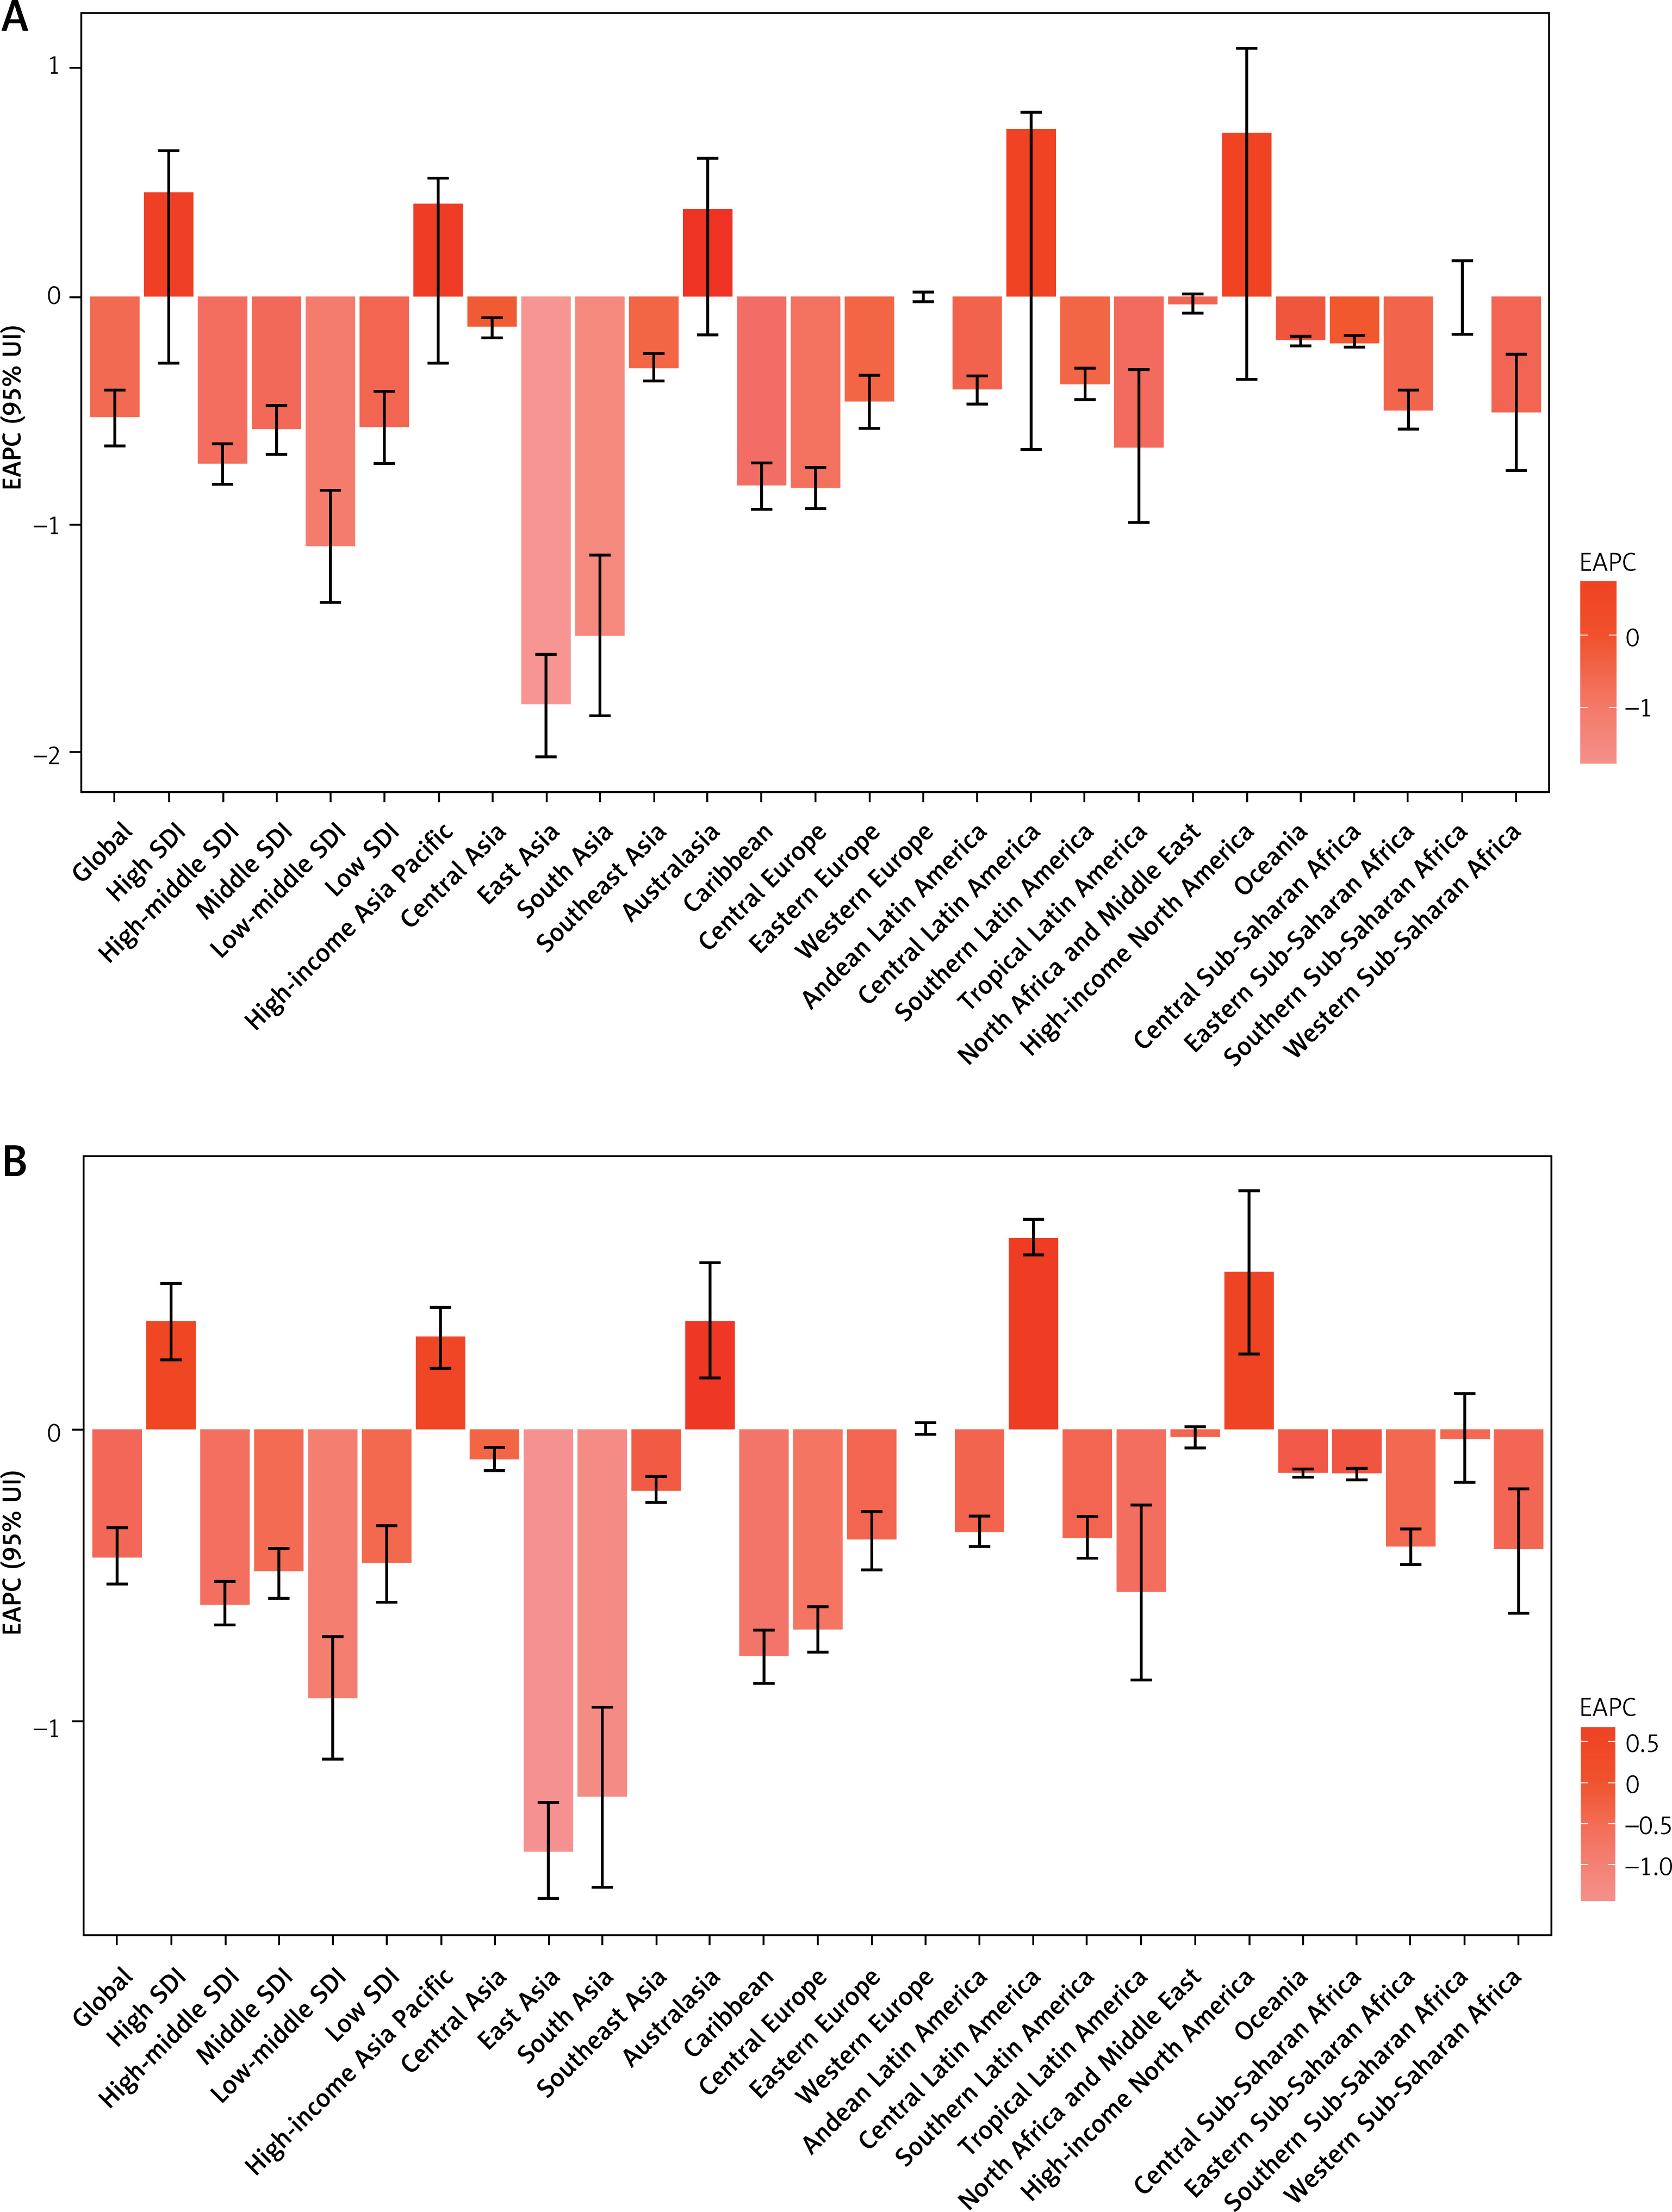
Figure 2
EAPC of depression in women of reproductive age in different regions of the world in 2019. A – Number of depressive episodes and EAPC among women of childbearing age in different regions of the world in 2019; B – DALY and EAPC of depression in aged women in different regions of the world in 2019
Distribution of depression burden among women of childbearing age at the national and regional levels in 2019
In 2019, the highest ASIR and age-standardized DALY rate per 100,000 were observed in women of childbearing age in the High SDI region, with an ASIR of 7021.94 and an age-standardized DALY rate of 1106.94. The Low SDI region followed closely, with an ASIR of 6560.07 and an age-standardized DALY rate of 1050.54. Conversely, the Middle SDI region exhibited the lowest burden of depression among women of childbearing age, with an ASIR of 4630.44 and an age-standardized DALY rate of 772.12 (Tables I, II).
In 2019, the Central Sub-Saharan Africa region exhibited the highest ASIR of depression among women of childbearing age, with a rate of 9942.84 per 100,000 individuals. Conversely, Southeastern Asia had the lowest ASIR at 2976.48. Geographically, Australasia (ASIR = 9127.27) and high-income North America (ASIR = 9202.25) were among the top three regions in terms of ASIR for depression among women of childbearing age, while East Asia (ASIR = 3039.55) and Central Europe (ASIR = 3594.76) were among the bottom three regions (Table I, Supplementary Table SIII, Figure 3). Among the 204 countries analyzed, Greenland had the highest ASIR for depression among women of childbearing age at 14256.94 per 100,000 individuals, with Poland having the lowest ASIR at 2677.33 (Supplementary Table SIII, Figure 4).
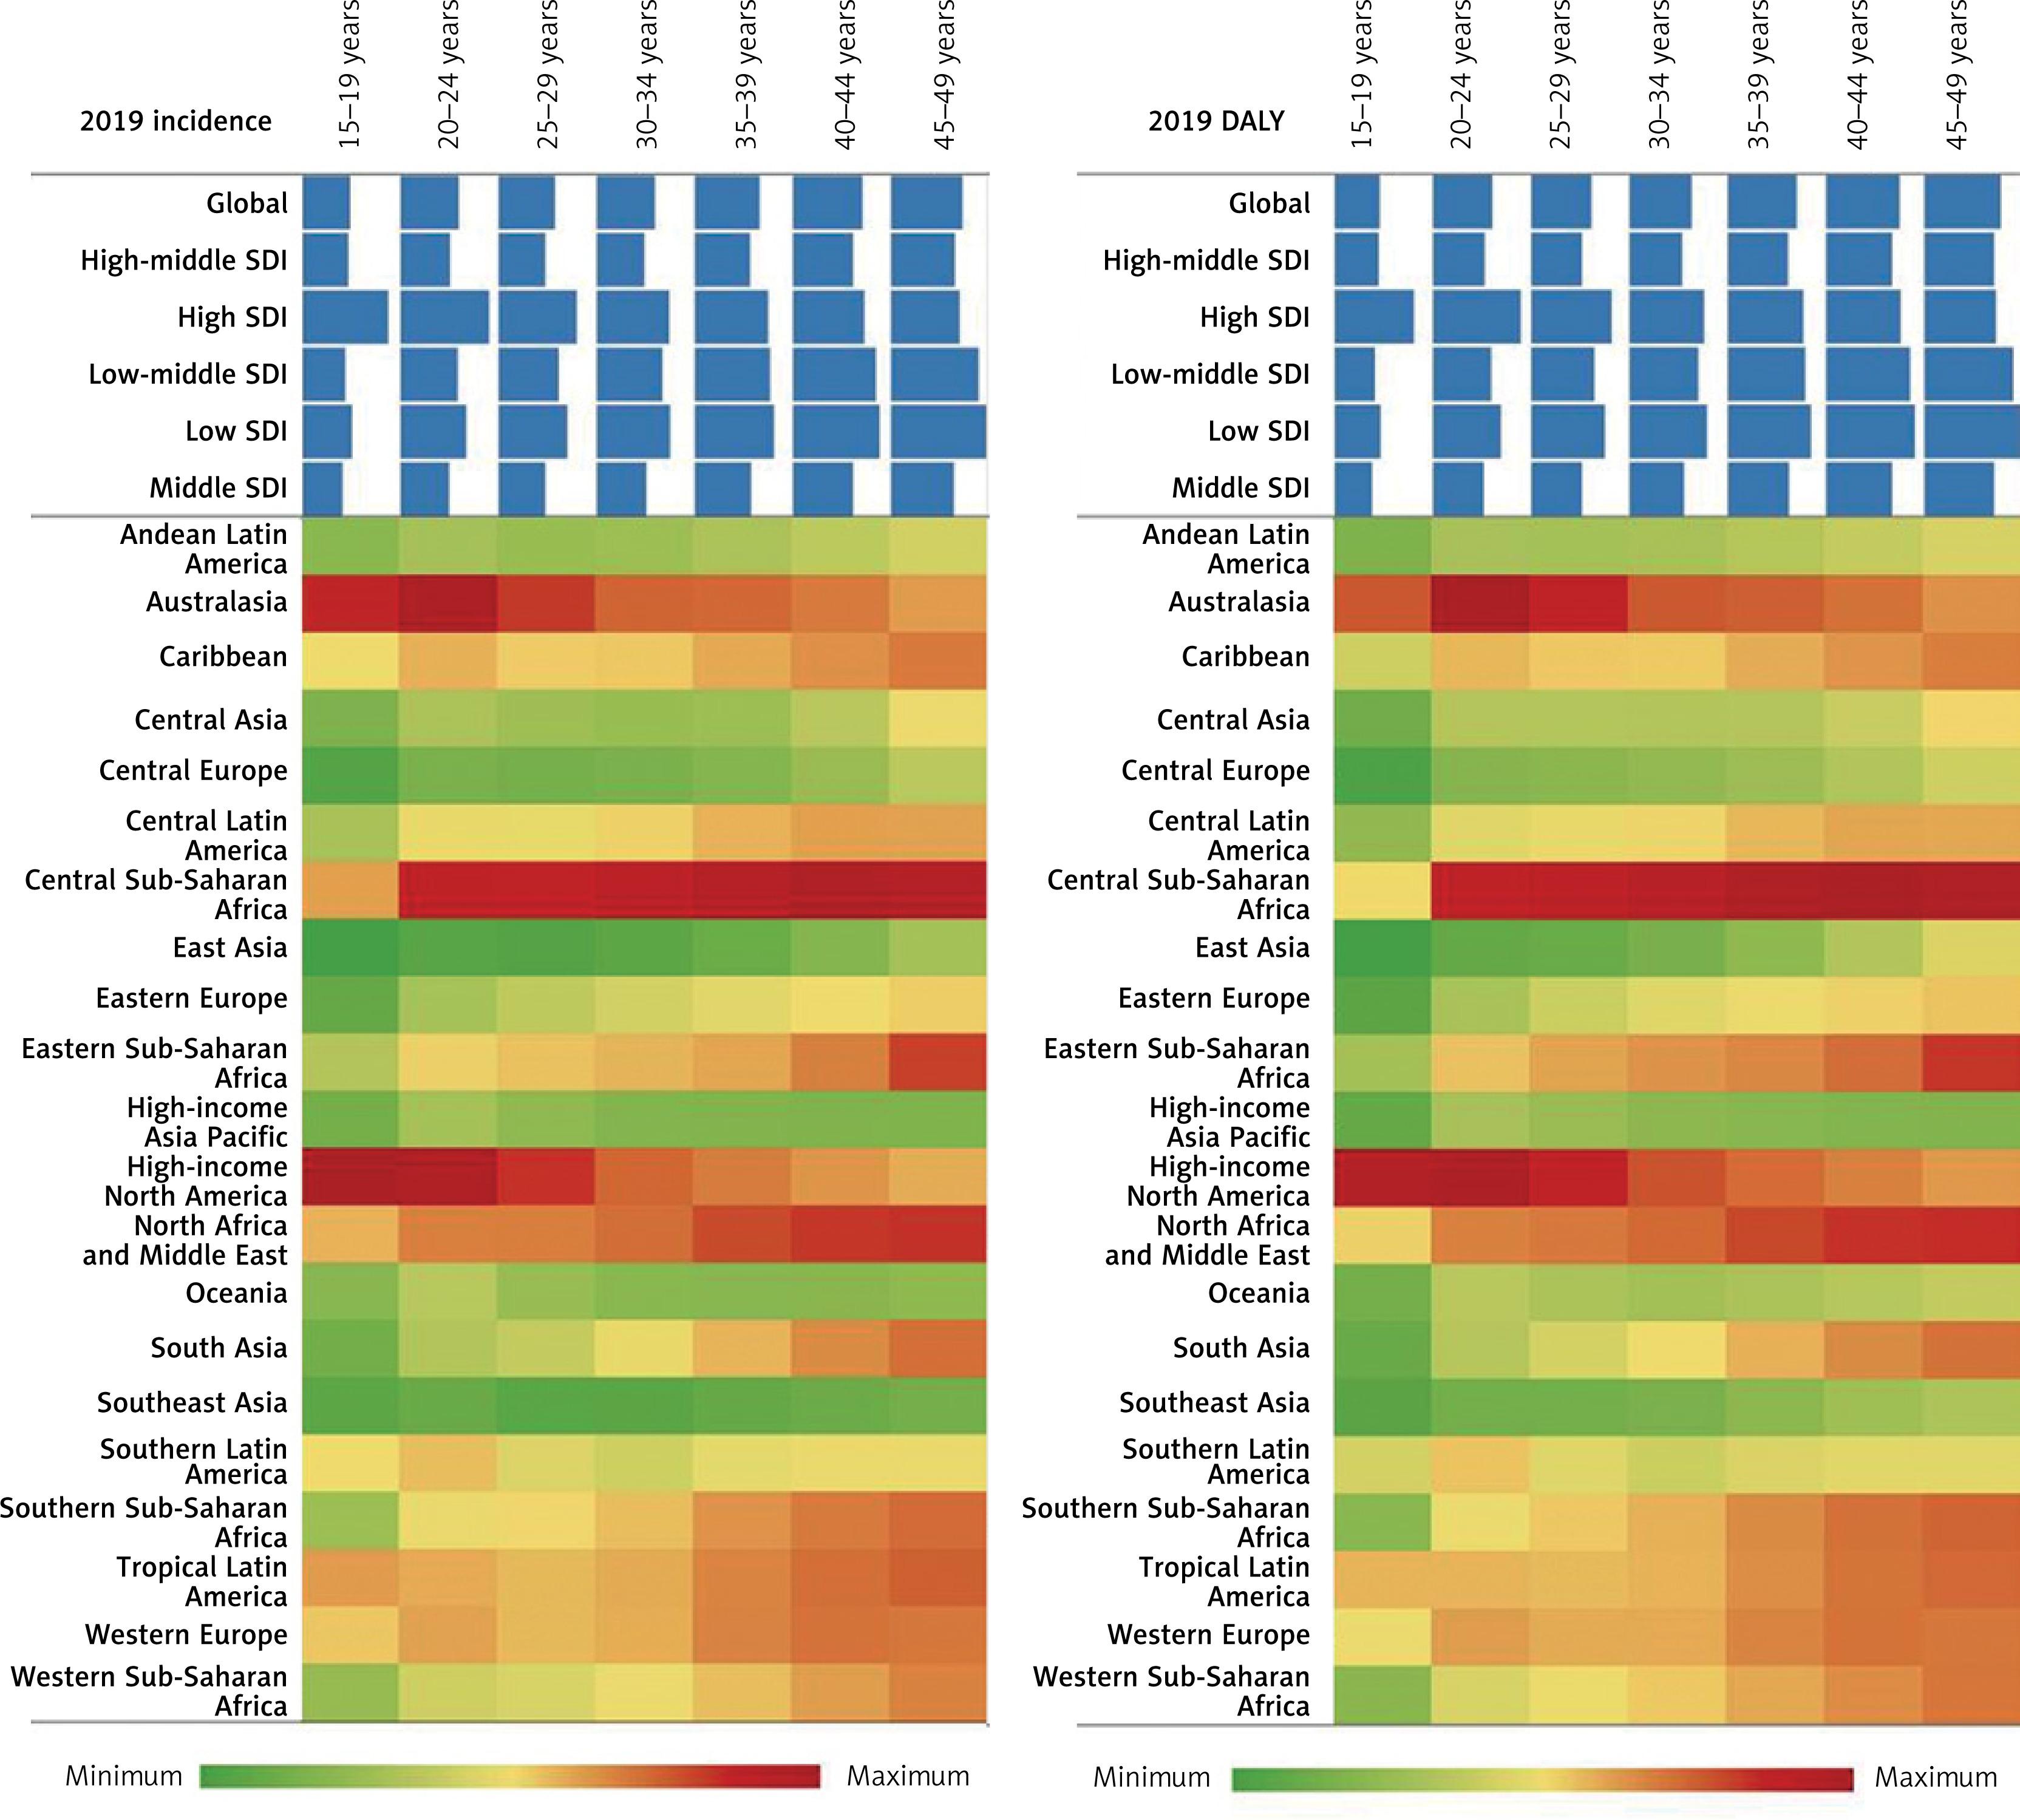
Figure 3
Inter-regional DALY rate and incidence of depression among women of childbearing age in 2019. A – Prevalence of depression among women of childbearing age in 2019 in different regions. B – Proportion of depression DALY rate among women of childbearing age in different regions in 2019
In 2019, among 21 geographical regions worldwide, the highest age-standardized DALY rate (per 100,000) among women of childbearing age was observed in Central Sub-Saharan Africa (1520.03), while the lowest was in East Asia (560.34) (Table I, Supplementary Table SIII, Figure 4 B). According to data from the World Health Organization (WHO) covering 204 countries, Greenland had the highest age-standardized DALY rate (per 100,000) for depression among women of childbearing age in 2019 (2177.29), whereas Myanmar had the lowest rate (401.33) (Supplementary Table SIII, Figure 4 B).
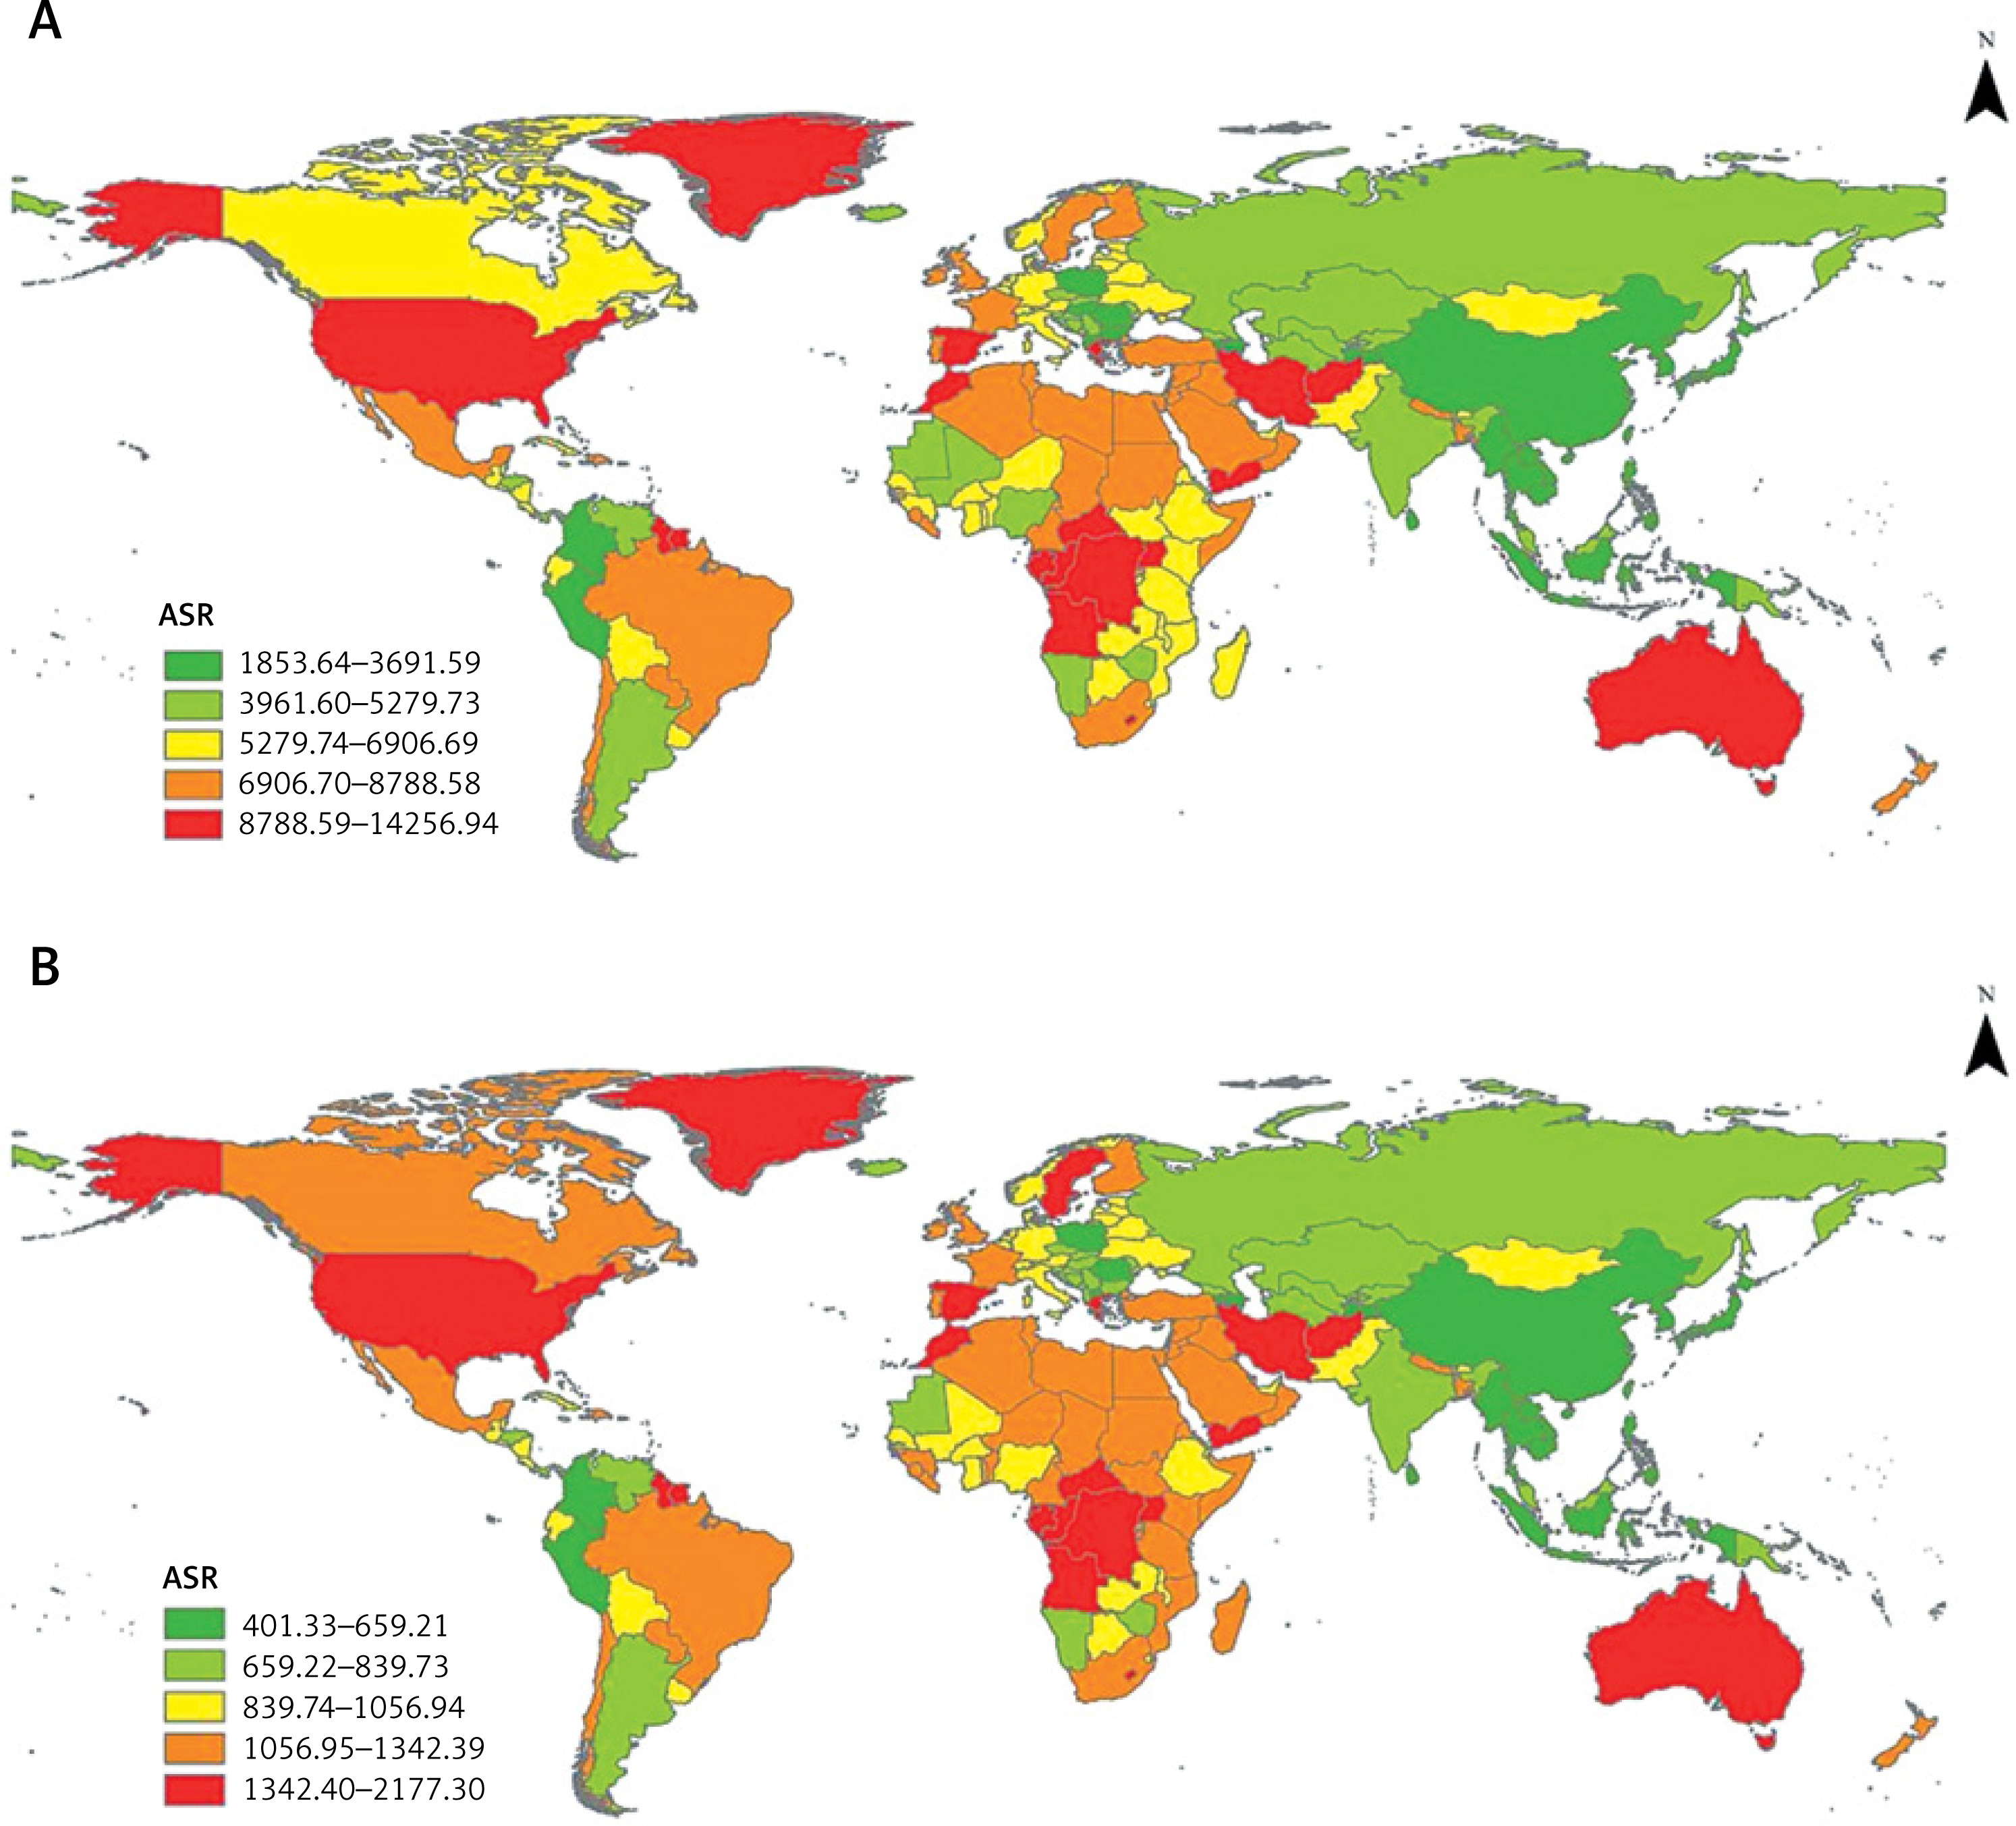
Figure 4
Regional differences in the incidence of depression among women of childbearing age worldwide in 2019. A – Global ASR for depression in women of reproductive age, 2019. B – Global depression DALY among women of reproductive age in 2019
In 2019, the global incidence rate of depression among women of childbearing age increased steadily with age. The incidence rate and DALY rate were highest in regions with high SDI for women aged 15 to 34, while regions with low SDI had the highest rates for women aged 35 to 49 (Figure 3).
Discussion
Depression is a prevalent mental illness that significantly contributes to disability, with a higher incidence rate among women compared to men [16]. This study examined the global burden of depression in women of childbearing age from 1990 to 2019, highlighting variations and trends in depression rates across different regions and countries. While there has been a global increase in the incidence of depression among women of childbearing age, the rates of ASIR and age-standardized DALY) are on a downward trajectory. This decline could be attributed to heightened global awareness of mental health issues, enhanced implementation of health policies [17, 18], advancements in research and treatment, and increased healthcare resources. Nonetheless, the rise in absolute case numbers indicates that depression remains prevalent among women of childbearing age. The EAPC in regions with Low SDI, Low-Middle SDI, and High-Middle SDI all exhibited a decrease, albeit varying in magnitude, reflecting the influence of socio-economic development on the burden of depression in this demographic. However, the SDI alone does not fully capture the cross-national differences in the burden of depression. For instance, in low-SDI regions, underreporting may occur due to mental health stigma, limited access to diagnostic services, and weak health systems [19, 20]. In contrast, high-SDI regions, such as high-income North America, may report higher incidence rates due to well-established screening mechanisms and greater mental health awareness [21, 22]. Factors such as allocation of health resources – including the availability of mental health professionals – and the utilization of mental health services also play critical roles. For example, countries with higher mental health service coverage, such as Singapore, may demonstrate lower DALYs due to the implementation of effective interventions [23]. In addition, cultural attitudes, such as the stigma surrounding mental health in certain regions, may discourage women from seeking treatment, further complicating accurate burden estimation. Future studies should incorporate these indicators to provide a more comprehensive analysis.
The incidence rate of depression and DALY rate in East Asia showed the most significant decrease, with Singapore and Cuba also experiencing a slight decrease in the burden of depression. This trend could be attributed to the high level of economic development, good medical conditions, and residents’ focus on health in these countries [24]. Conversely, the Central Sub-Saharan Africa region and Greenland exhibited high ASIR and age-standardized DALY rates, indicating a substantial disease burden. Research has shown that the total fertility rate and maternal mortality rate in Central Sub-Saharan Africa are notably higher than the global average [25], potentially contributing to the higher burden of depression among women of reproductive age in the region. Various factors such as malnutrition, limited healthcare services, and economic development constraints play a role in the high disease burden [26, 27]. Additionally, cultural and social barriers may hinder women of childbearing age from accessing timely and effective support and treatment for psychological issues. Notably, the ASIR and DALY rates of depression in women of childbearing age tend to increase with age [28], possibly due to the multiple roles women take on as they age, leading to conflicts between these roles that can contribute to the rising burden of depression and disease in this demographic. Previous studies have suggested a link between high work-family conflict and the development of depression symptoms in women [29].
Central Latin America, Mexico, and other high SDI regions have experienced a notable increase in EAPC. The rise in disease burden among women of childbearing age in these areas may be attributed to factors such as work pressure, socio-economic conditions, and shifts in cultural beliefs. A survey in Europe revealed that women living alone, particularly those who are employed, tend to have higher depression scores [30]. While traditional gender roles promote collaboration and interdependence, contemporary society emphasizes women’s personal accomplishments, self-reliance, and independence, particularly in more developed regions. Consequently, seeking help for depression may come with greater psychological costs, as it may conflict with modern female roles. Despite advancements in medical resources, there is still a need for enhanced social awareness and improved treatment of mental health issues [31]. The increase in EAPC suggests that current prevention and treatment strategies may not fully address the requirements of individual countries and regions, especially in settings with limited resources. Moreover, disparities in disease management and public health approaches could result in a greater disease burden among certain populations [32].
As noted by Rajkumar (2022) [33], GBD data in low-income countries are adjusted using Bayesian meta-regression methods. Our study also employed the DisMod-MR 2.1 model to partially correct for these biases. Nevertheless, we call for enhanced surveillance systems in low-SDI regions to improve data accuracy. Compared to existing studies, our research is the first to systematically reveal the ‘double-edged sword effect’ of depression burden among women of reproductive age: while the global trend is decreasing, high-SDI regions (e.g., Mexico) are experiencing a rebound due to socio-cultural transitions, whereas low-SDI areas (e.g., Sub-Saharan Africa) remain constrained by structural resource limitations. For example, the increased burden observed in Mexico coincides with broader societal transitions, such as rising female labor force participation and shifting family dynamics, although these associations require further empirical validation [34]. Conversely, the decline observed in Singapore may reflect more effective mental health system coverage; however, specific causal relationships were not examined in our study and should be explored in future research [24]. This study goes beyond the macro-level descriptions in Gao et al. (2024) and Zhang et al. (2024) [34–36], offering region-specific evidence to inform targeted resource allocation. Future research may incorporate individual-level data (e.g., WHO SAGE) to further explore the biopsychosocial mechanisms involved. Through these extended analyses, our study demonstrates methodological comprehensiveness and significantly enhances policy relevance by contextualizing findings within specific national and demographic settings.
Although the SDI provides a valuable macro-level perspective, micro-level socioeconomic status (SES) factors – such as educational attainment, income, and occupational status – are key determinants of depression risk among women of reproductive age [8, 9]. For example, lower levels of education and income are associated with higher levels of depressive symptoms, potentially due to increased economic stress and limited access to mental health resources. In high-SDI regions such as parts of Latin America, the observed increase in EAPC may reflect the interaction between these SES factors and macro-level stressors, including work–family conflict and shifting gender roles, which may further exacerbate the risk of depression [37]. Unfortunately, the GBD 2019 dataset does not include individual-level SES data, which limits our ability to directly explore these associations. Future research should integrate both micro- and macro-level perspectives to better elucidate how social structures influence depression through multiple pathways.
However, the study also has limitations. Firstly, due to limited data availability, particularly from economically underdeveloped areas, there may be an underestimation of the burden on women of childbearing age. Secondly, while the study accounts for factors such as age, gender, country, and SDI, it does not address the impact of genetics, living environment, or individual psychological characteristics on depression in women of child-bearing age. Thirdly, relying on the SDI as a macro-level indicator may obscure critical factors such as health resource allocation, utilization of mental health services, and cultural-psychological determinants, all of which significantly influence estimates of the depression burden. In addition, the GBD 2019 dataset does not include micro-level SES variables such as educational attainment, income, and occupational status. Incorporating these factors into future research would offer a more comprehensive understanding of the determinants of depression.
In conclusion, from 1990 to 2019, there was a consistent downward trend in the burden of depression in women of childbearing age globally. However, certain countries and regions such as Central Latin America and Mexico experienced an upward trend in ASIR and age-standardized DALY rates. The findings of this study hold significant importance in guiding the development of public health policies.