Introduction
The severity of COVID-19, a major challenge for worldwide nations, may vary from mild pneumonia to acute respiratory distress syndrome (ARDS) complicated by respiratory failure, septic shock, or multiple organ dysfunction [1], with mortality rates of 23.9% in critically ill patients [2], despite new treatment protocols [3]. Also, cardiovascular impairments such as fulminant myocarditis or major vascular events may appear [4]. These potentially fatal complications require an immediate therapeutic strategy, with extracorporeal life support such as extracorporeal membrane oxygenation (ECMO) to stabilize these patients’ critical condition.
ECMO is a mechanical support device similar to cardiopulmonary bypass, and it has two main types, i.e. veno-arterial ECMO (V-A ECMO) and veno-venous ECMO (V-V ECMO), with sometimes the combination venous-arterial-venous ECMO (V-A-V ECMO).
The Extracorporeal Life Support Organization (ELSO) mentions a couple of criteria for considering V-V ECMO in hypoxic respiratory failure: PaO2/FiO2 ratio lower than 150, on FiO2 over 90% and a Murray score of 2–3, or PaO2/FiO2 under 100 on FiO2 over 90% and a Murray score 3–4 despite optimal care for more than 6 h [5].
The main advantages of V-V ECMO therapy are better oxygenation, lung protection during ventilation without severe hypercapnia and respiratory acidosis providing safer transportation [6]; V-A ECMO is useful in cases of cardiac involvement as it has been described in a recent systematic review which included 9 studies with a total of 1,998 adult patients receiving V-A ECMO for acute myocardial infarction-induced cardiogenic shock. The survival rate varied from 30.0% to 79.2% at discharge and from 23.2% to 36.1% at 12 months. ECMO therapy represents a temporary support that provides benefits compared to standards of care, being an upgradable device for advanced life support that could assure a higher survival rate [7]. ELSO published the most recent COVID-19 consensus which provides substantial contraindications by adding specific technical measures for the patient and the medical team [8]. The most frequent complication of ECMO is bleeding, with a frequency of 29.3% reported in a systematic review, followed by local infections (9.9%), pulmonary bleeding, and intracerebral haemorrhage [9].
The CESAR trial showed a 6-month survival rate of 63%, demonstrating the reliability of ECMO for treating ARDS in (H1N1) influenza epidemics when lung ventilation protocols failed [10]. Similarly, other studies showed survival rates of 76.3% [11], 78% [12], 71% [13], or even a survival to discharge rate of 100% [14] when compared to standard care therapy. Recent recommendations of ELSO [15] indicate ECMO usage in patients with high mortality risk, with the indications of the EOLIA trial [16] to define severe ARDS that may require mechanical support. Some recent studies recommended use of ECMO as salvage therapy in patients with severe COVID-19 infections.
Hospitalised patients with coronavirus disease 2019 (COVID-19) have a high mortality rate. There are many published randomised controlled trials for COVID-19 treatments [17]. The use of antivirals or other repositioning drugs is essential for clinical improvement and survival. In the absence of a specific treatment, in vitro and in vivo studies have been proposed to use existing drugs such as tocilizumab (monoclonal antibodies), remdesivir (antiviral), chloroquine and hydroxychloroquine (antimalarial), lopinavir and ritonavir (antiretrovirals), dexamethasone (glucocorticoid), and convalescent plasma (neutralizing antibody) [18]. Several studies have stated that antivirals drugs such as remdesivir, favipiravir, and lopinavir/ritonavir may potentially inhibit the virus from spreading to the host. In a systematic review which pooled data from 15 studies, involving a total of 5310 patients, the results showed that remdesivir has some potential benefits for hospitalized COVID-19 patients, as seen from clinical improvements such as faster recovery time, shorter duration of hospitalization, and fewer respiratory side effects among COVID-19 patients. However, the impact of remdesivir in reducing mortality remains uncertain. Treatment with favipiravir has shown promising improvement in the clinical status of COVID-19 patients, although the results suggested no significant differences in some clinical parameters such as length of hospitalizations and clinical recovery. Furthermore, the use of lopinavir/ritonavir in COVID-19 patients showed no significant clinical improvement compared to standard care with notable adverse effect reactions [19].
The survival of critical ill patients with COVID-19 has been reported variously. The application of scoring systems can facilitate the effective evaluation by physicians to screen severe patients. At present, there are no specific scoring systems for the evaluation of COVID-19 patients. However, scoring systems such as the Sequential Organ Failure Assessment (SOFA) score can help emergency or critical care physicians for prognosis and predicting mortality [20]. Besides the SOFA score, the Acute Physiology and Chronic Health Evaluation (Apache II) score was designed to measure the severity of disease of patients admitted to the ICU and to predict mortality [21]. The Murray Score is used to grade the severity of lung injury in acute respiratory distress syndrome (ARDS) [22].
With this background in mind, this systematic review aimed to evaluate the effects of ECMO in patients with severe COVID-19 infection and respiratory support.
Material and methods
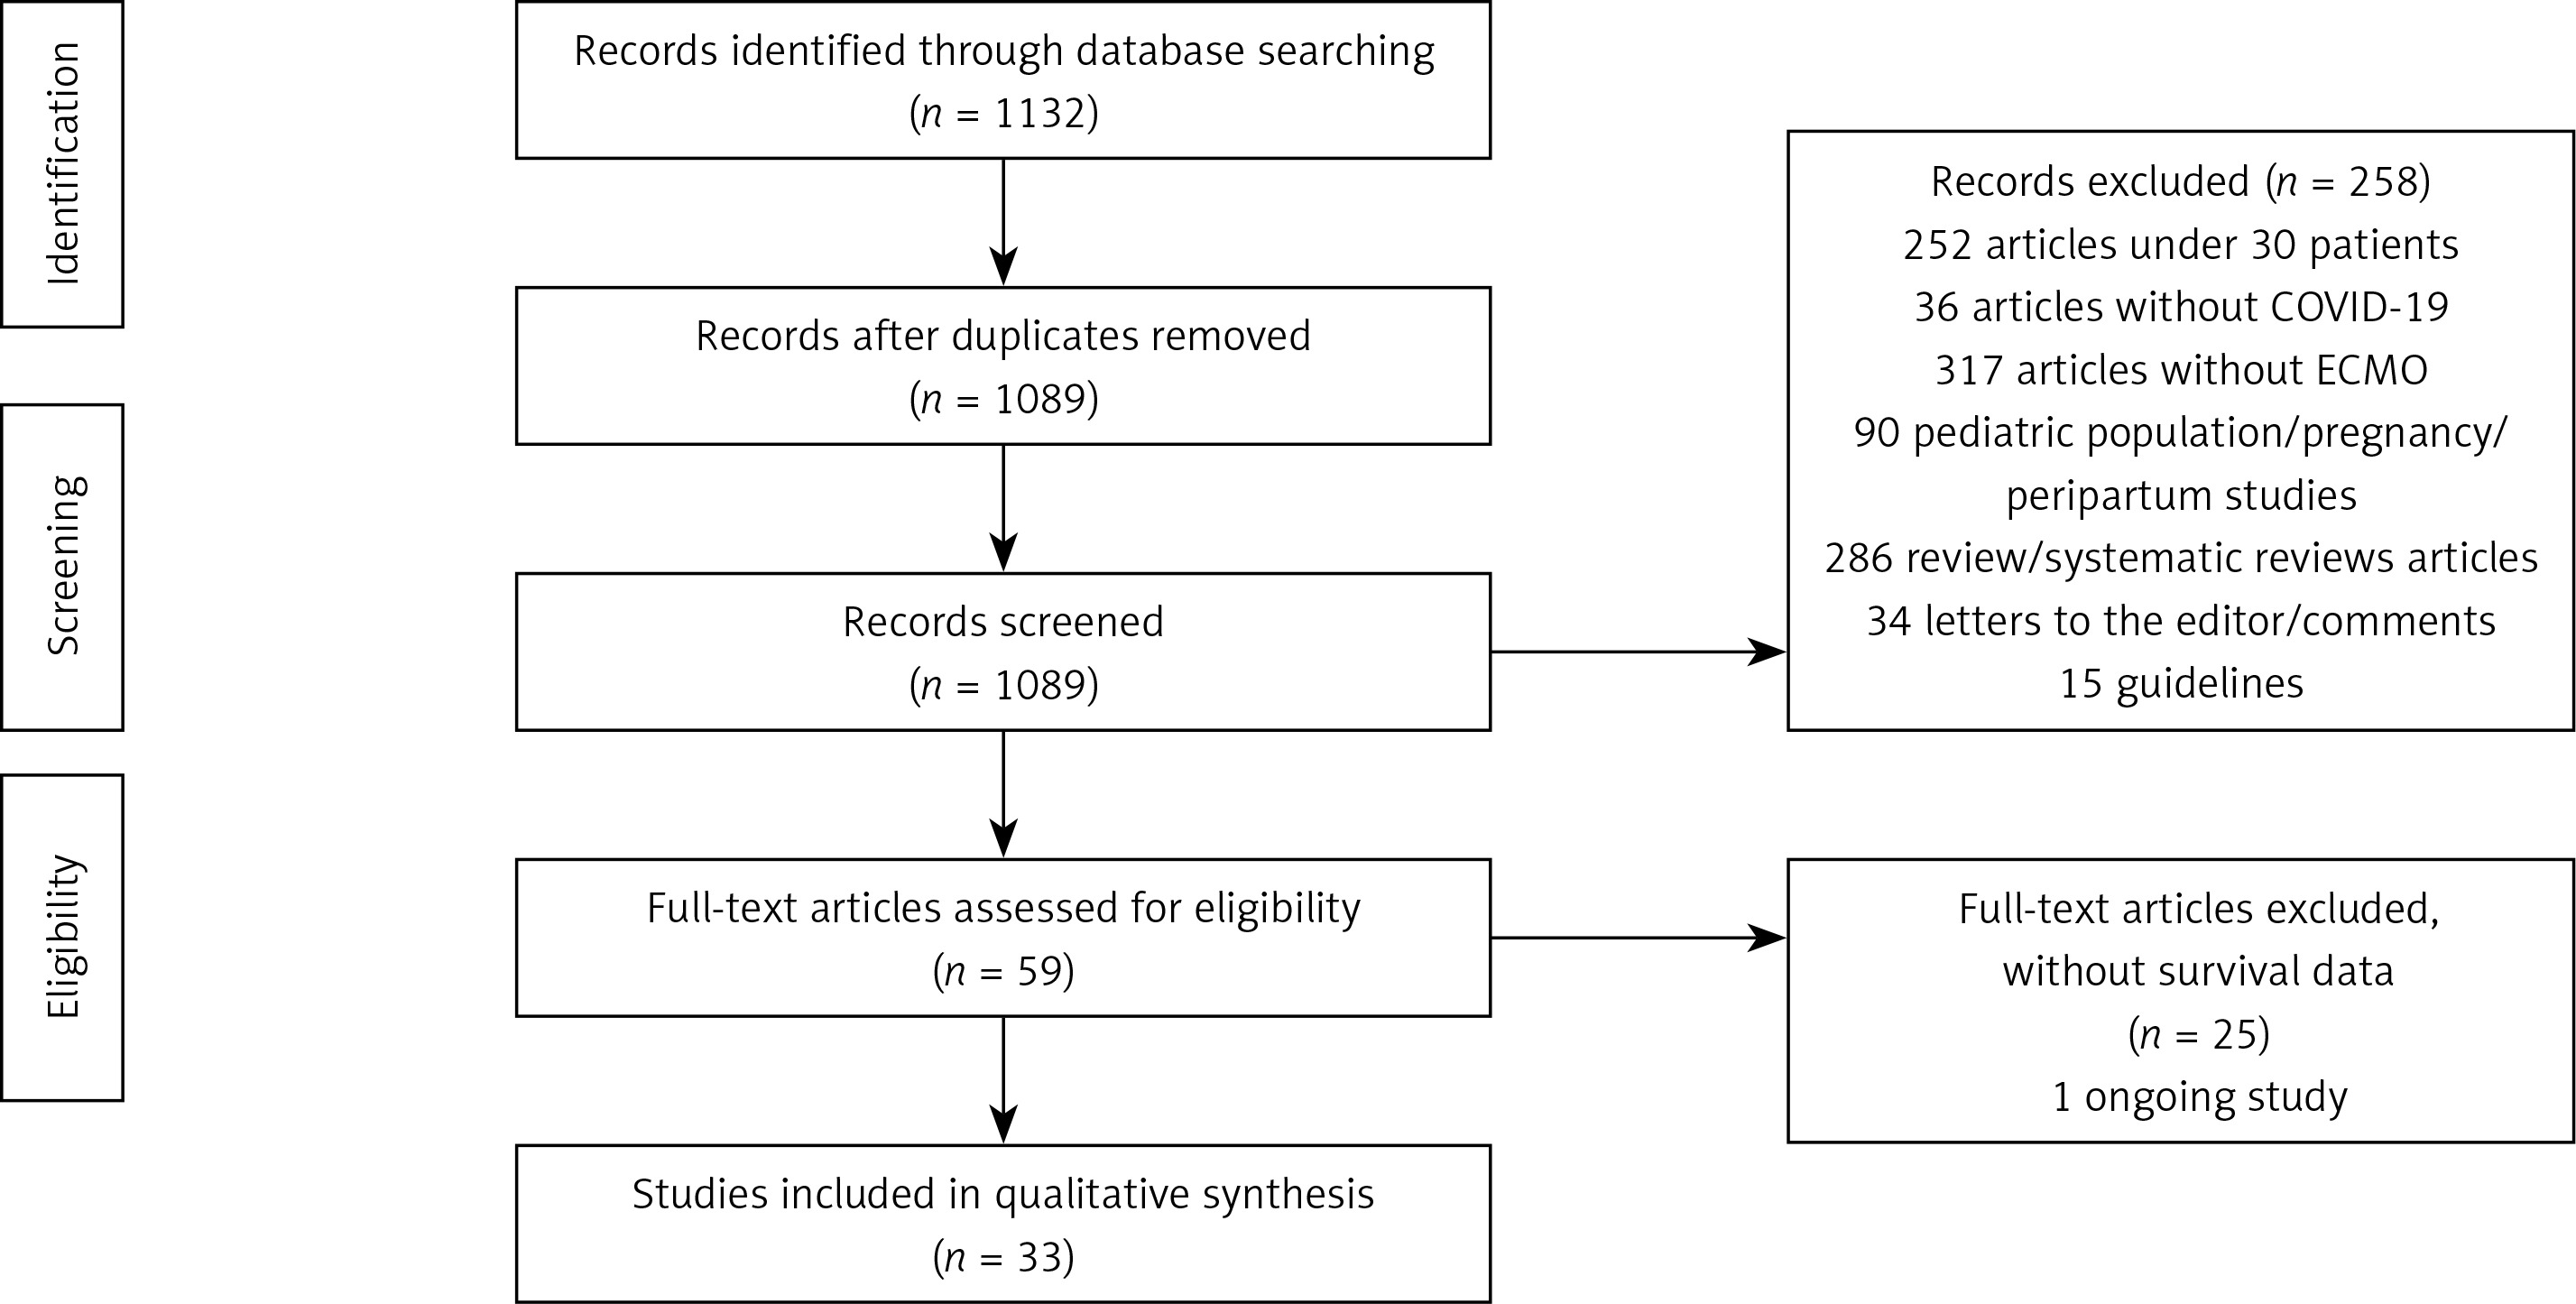
We used Preferred Reporting Items for Systematic Reviews and Meta-Analyses (PRISMA) to guide reporting of this study [23]. The detailed search strategy is shown in Figure 1.
Protocol and registration
This protocol has not been registered in the PROSPERO database of systematic review protocols.
Data sources/search strategy
We have searched PubMed/MEDLINE, Web of Science, Embase (Elsevier), the Cochrane Central Register of Controlled Trials (Wiley) and clinicaltrials.gov databases (inception (December 2019) to October 16, 2021) without language restrictions. Hand searching for relevant articles was done.
Key words for the search
During our search, we used keywords for the population of interest and intervention of interest which are shown in Table I. Articles that were considered suitable by title and a thorough abstract reading were included for full-text evaluation. Referenced articles in the selected studies were also read thoroughly for any significance.
Table I
Key words used for search strategy
Study selection. Inclusion and exclusion criteria
All observational studies and randomized clinical trials for COVID-19 adults treated with ECMO were searched. We reported data on the impact of ECMO on survival, mortality, adverse events related to ECMO usage, and associated comorbidities of patients with COVID-19 on ECMO.
No data about prior vaccination were registered in the included studies.
We only included studies with more than 30 patients. We excluded any animal, paediatric (< 18 years)/pregnancy/peripartum population studies, any studies under 30 patients or without COVID 19, studies without ECMO, systematic reviews articles, letters to the editor/comments or guidelines.
Data extraction and synthesis
Data extraction was done independently by two authors (M.A.Z. and G.I.), using standardized data extraction forms. Extracted data included study outcomes, study protocol, and demographic data.
Quality assessment
Risk of bias. Quality of the selected studies was independently evaluated by 2 reviewers (M.A.Z and G.I.), using the Newcastle-Ottawa scale (NOS); according to the NOS, 3 methodological categories were used for assessment: selection (score 0–4), comparability (score 0–2), and outcome (score 0–3). Quality was considered high if the score was 7–9, intermediate if the score was 4–6, and low if the score was 0–3. Disagreements were resolved by consensus [24].
Results
1132 records initially resulted as potentially relevant articles. After removing duplicates and performing an analysis, a total of 59 full-text articles were thoroughly analysed and 33 articles were included.
We included three studies from France, three studies from the People’s Republic of China, 12 studies from the United States of America, 6 studies from United Kingdom, 3 studies from Germany, 2 studies from Italy, 1 study from Finland, 1 study from the Netherlands, 1 study from Poland, and 1 study from Japan.
V-V ECMO was used in 20 studies, while V-A ECMO was performed in 13 studies, in cases of cardiac involvement or pulmonary embolism.
The main characteristics of the included studies are presented in Table II.
Table II
The main characteristics of the included studies
| Study | Country | Year | Patients on ECMO | ECMO type | Survival rate |
|---|---|---|---|---|---|
| Tabatabai et al. [25] | United States of America | 2020 | 40 | V-V | 82,5% completed ECMO therapy and 54.5% survived 17.5% remained on ECMO at data collection |
| Yang et al. [26] | China | 2020 | 73 | V-V | 13.7% survivors 5.5% still in ICU including 2.7% on ECMO at data collection |
| Raasveld et al. [27] | Netherlands | 2020 | 71 | 66 V-V 3 V-A 1 V-V-A | 52% weaned off, 28 days mortality rate was 37%/28 days survival rate was 63% |
| Nguyen et al. [28] | United States of America | 2020 | 1182 | NA | 54.1% survivors In-hospital survival 54.1% |
| Shih et al. [29] | United States of America | 2020 | 53 | 49 V-V 4 V-A | 62.3% survivors 30 days survival rate 100% 60-days survival rate 100% |
| Fang et al. [30] | China | 2020 | 88 | V-V (V-A or V-A-V excluded) | 30.7% of patients weaned off ECMO 17% were discharged, 9.1% remained in hospital at data collection 120-day in hospital mortality rate-74.3% |
| Garfield et al. [31] | United Kingdom | 2020 | 53 | VV V-A was excluded | 90.6% survived from decannulation 6 months survival rate 84.9% |
| Weir-McCall et al. [32] | United Kingdom | 2019–2020 | 64 | V-V | 9% discharged, 20% remained on ECMO at data collection, 14% off ECMO but remained on ventilator support, 13% remained on noninvasive ventilation, 11% remained in hospital on oxygen therapy, 5% remained in hospital without oxygen therapy |
| Bissell et al. [33] | United States of America | 2020 | 33 | V-V | 51.5% survivors 48.5% ICU mortality rate |
| Supady et al. [34] | Germany | 2020 | 127 | V-V | After 30 days 54.3% survived After 60 days 45.7% survived deaths by day-30 was 45.6% |
| Doyle et al. [35] | United Kingdom | 2020 | 51 | V-V | 74% survivors 1 patient still on ECMO at data collection |
| Schmidt et al. [36] | France | 2020-2021 | 159 | 154 V-V 3 V-A 1 V-AV | 53.5%, survivors 90 days survival rate was 58% |
| Arachchillage et al. [37] | United Kingdom | 2020 | 152 | V-V | 70.4% survived at 180 days |
| Saeed et al. [38] | United States of America | 2020 | 292 | 280 V-V 10 V-A 2 VA-V | 46% discharged/transferred alive 9% weaned off ECMO, but remained in hospital 6% still on ECMO at data collection 90 days in-hospital mortality was 42% |
| Onorati et al. [39] | Italy | 2020 | 228 | 203 V-V 25 V-A | Successful ECMO weaning with subsequent survival less than 50% in most of the implanting centers |
| Loforte et al. [40] | Italy | 2020 | 71 | Primary configuration 67 V-V 4 V-A-V Second configuration 5 V-A | 36.6% survived 54.9% died on ECMO including the secondary V-A ECMO cases 8.5% died after ECMO removal |
| Bergman et al. [41] | United States of America | 2020 | 46 | V-V V-A-V | 60 days survival rate was 65.2% |
| Li et al. [42] | China | 2019–2020 | 31 | V-V | 26% weaned off ECMO 60 days mortality rate was 71% |
| Biancari et al. [43] | Finland | 2020 | 132 | 122 V-V 10 V-A Changed configuration 8 V-V, 3 V-A, 5 V-A-V | At 6 months 46.9%survival rate |
| Mustafa et al. [44] | United States of America | 2020–2021 | 80 | V-V | 71% weaned off, 67.5% discharged 1 received a double lung transplant before discharged |
| Ogura et al. [45] | Japan | 2020 | 187 | V-V (V-A or V-A-V were excluded) | 66.8% weaned off ECMO |
| Cho et al. [46] | United States of America | 2020 | 283 | 94% V-V | ECMO use (HR = 1.78) increased the instantaneous and cumulative hazard of death |
| Zaaqoq et al. [47] | United Kingdom | 2020 | 232 | V-V | 25% discharged from hospital 4% remain in the hospital on data collection |
| Suwalski et al. [48] | Poland | 2020 | 75 | 74 V-V 1 V-A | 38.6% survivors 8 listed for lung transplantation; of those, 4 underwent successful |
| Jacobs et al. [49] | United States of America | 2020 | 200 | 188 V-V 12 V-A | 45% survivors 55% died |
| Kunavarapu et al. [50] | United States of America | 2020 | 52 | V-V | 56% survivors |
| Shaefi et al. [51] | United States of America | 2020 | 190 | V-V | 60% survivors, discharged 4.7% hospitalized at data collection |
| Bermea et al. [52] | United States of America | 2021 | 33 | V-V | 48.5% discharged, 12.1% had ongoing care |
| Fröhlich et al. [53] | Germany | 2020 | 53 | NA | 64.2% survivors |
| Luyt et al. [54] | France | 2020 | 50 | V-V | 66% survivors |
| Zhang et al. [55] | United Kingdom | 2020 | 43 | V-V | 67.4% survived, discharged 14 died – 12 on ECMO, 2 after decannulation |
| Supady et al. [56] | Germany | 2020 | 34 | V-V | Survival at 30-days –18% with cytokine adsorption and 76% without |
| Lebreton et al. [57] | France | 2020 | 302 | 288 V-V 11 V-A 3 V-A-V | 46% – 90 days after ECMO |
Baseline characteristics of included studies
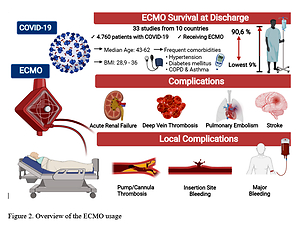
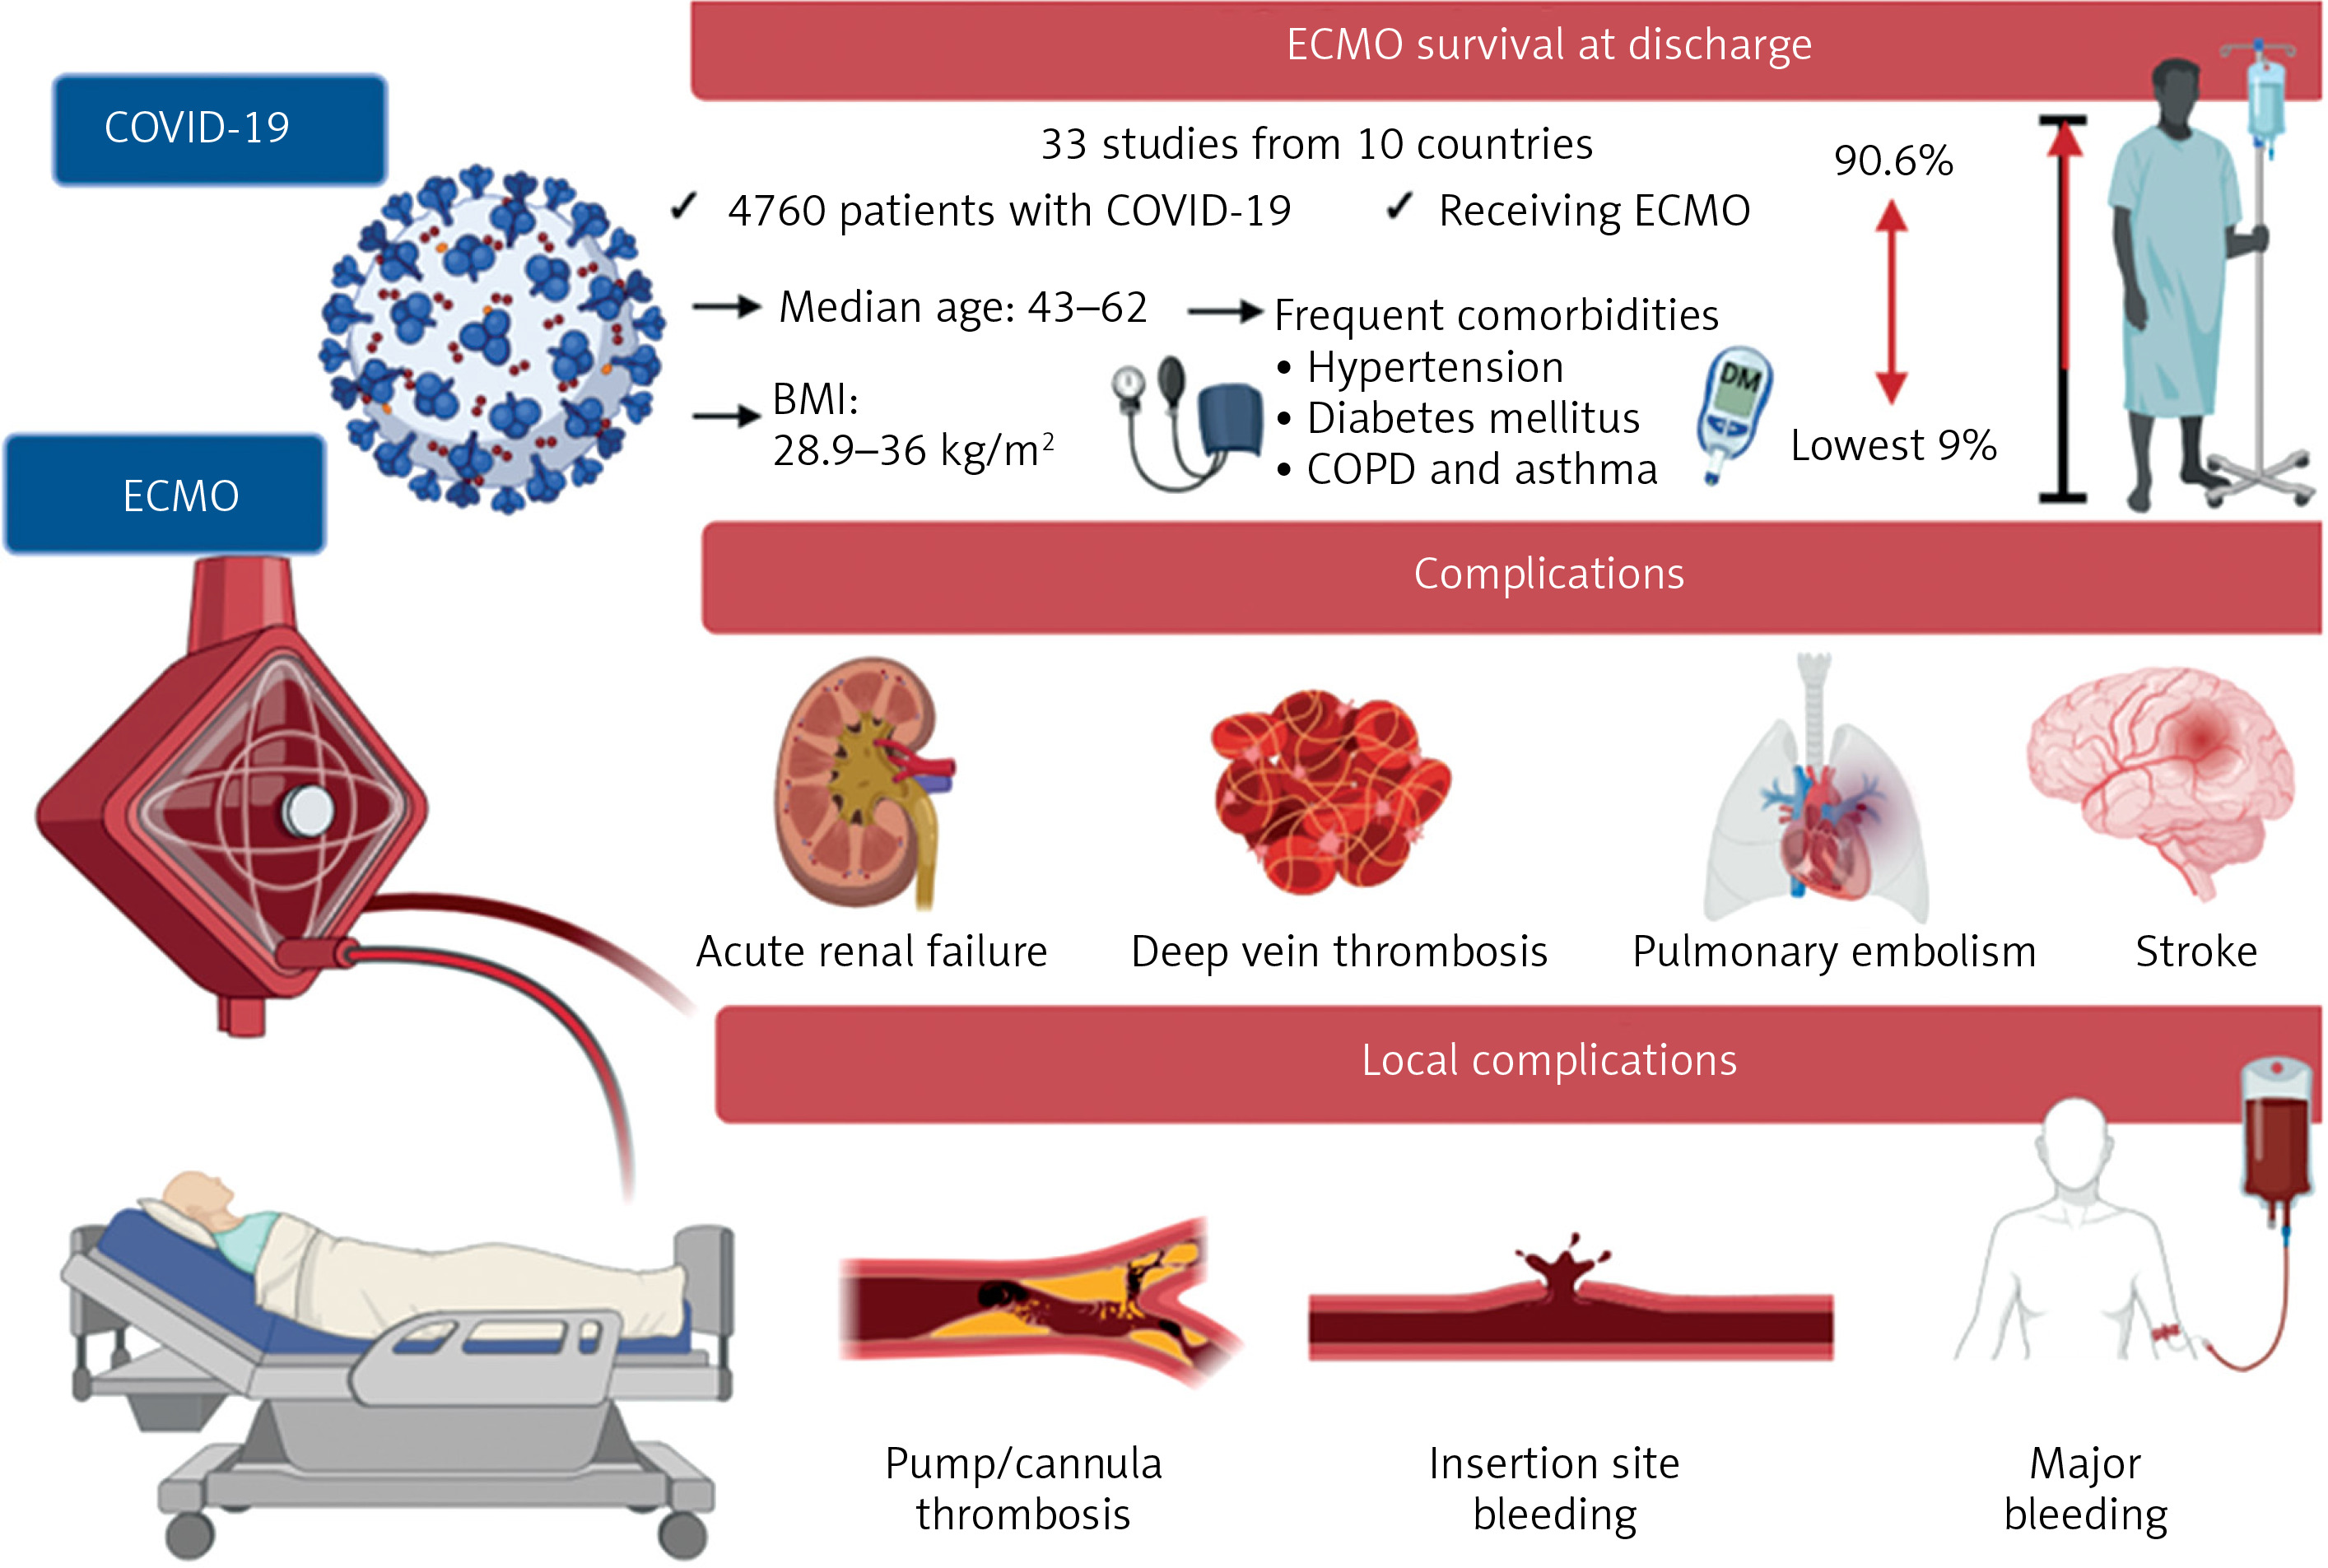
The median age was between 43.2 [25] and 62 [26].
The most frequent comorbidities in COVID-19 patients treated with ECMO were hypertension, which varied from 21% [27] to 53.5% [28], and diabetes mellitus, which varied from 8% [27] to 39.6% [29]. Also, chronic obstructive pulmonary disease or asthma varied between 1.1% [30] and 18.9% [31].
Body mass index was between 28.9 kg/m2 [32] and 36 kg/m2 [33]. The baseline characteristics of the studies are presented in Table III [25–57].
Table III
Baseline characteristics of included studies
| Study | Male | BMI | Arterial hypertension | Diabetes mellitus | Chronic respiratory disease, COPD, or asthma |
|---|---|---|---|---|---|
| Tabatabai et al. [25] | 80% | 34 (7.1) | 22.5% | 30% | 10% |
| Yang et al. [26] | 63% | NA | 37% | 17.8% | 6.8% COPD |
| Raasveld et al. [27] | 80% | 29.2 (26.1–32.1) | 21% | 8% | 10% asthma/6% COPD |
| Nguyen et al. [28] | 71.4% | NA 58.3% obesity | 53.5% | 36% | 17.9% chronic pulmonary disease |
| Shih et al. [29] | 67.9% | 33.6 (30.6–37.9) | 52.8% | 39.6% | 7.5% COPD |
| Fang et al. [30] | 63.6% | NA | 39.8% | 20.5% | 1.1% chronic lung disease |
| Garfield et al. [31] | 73.6% | 29.4 (25.6–34.2) | 24.5% | 17% | 18.9% asthma. 0 COPD |
| Weir-McCall et al. [32] | 77% | 28.9 ±7.0 | 23% | 25% | 14% – 8 asthma, 1 other |
| Bissell et al. [33] | 60.6% | 36 (10) | NA | NA | NA |
| Supady et al. [34] | 78.7% | 29 (26–35) | NA | NA | 10% chronic lung disease |
| Doyle et al. [35] | 74.5% | NA | NA | NA | NA |
| Schmidt et al. [36] | 72% | 30.8 (27.7–35.1) | 40% | 34% | 15% |
| Arachchillage et al. [37] | 75% | NA | 28.9% | 24.3% | 15.8% |
| Saeed et al. [38] | 72.2% | 32 (29–37) | 41% | 31% | 3% chronic respiratory disease |
| Onorati et al. [39] | NA | NA | NA | NA | NA |
| Loforte et al. [40] | 85.9% | 30.2 (24.1–36.3) | 43.7% | 16.9% | 7% |
| Bergman et al. [41] | 82.6% | 31.7 (6.6) | 45.7% | 39.1% | 8.7% |
| Li et al. [42] | 61% | NA | 23% | 16% | NA |
| Biancari et al. [43] | 82.5% | 30.9 (6.6); 56 – BMI > 30 kg/m2 | 28.8% | 22% | 9.2% |
| Mustafa et al. [44] | 76.3% | 34.1 (0.8) | NA | NA | NA |
| Ogura et al. [45] | 83.4% | NA | NA | NA | NA |
| Cho et al. [46] | 70% | NA | NA | NA | NA |
| Zaaqoq et al. [47] | 69% | 30 (27–36) | 41% | 25% | NA |
| Suwalski et al. [48] | 77.3% | NA | NA | NA | NA |
| Jacobs et al. [49] | 69% | NA 64% obesity | 47% | 38% | 16.5% asthma |
| Kunavarapu et al. [50] | 67.3% | 32 (6.0) | 46.2% | 30.8% | 13.5% asthma |
| Shaefi et al. [51] | 72.1% | 32.7 (29.1–38) | NA | NA | 6.8% chronic lung disease |
| Bermea et al. [52] | NA | NA | NA | NA | NA |
| Fröhlich et al. [53] | 67.9% | NA | NA | NA | NA |
| Luyt et al. [54] | 72% | NA | NA | NA | NA |
| Zhang et al. [55] | 76.7% | 29 (27–34) | 23.3% | 18.6% | 11.6% asthma |
| Supady et al. [56] | 73.5% | 29.5 | 47% | 23.5% | 11.76% |
| Lebreton et al. [57] | 78% | 29.7 (26.8–33.5) | 34% | 29% | 11% |
ECMO survival rate
Survival at discharge was reported in all studies, with the lowest rate encountered in Weir-McCall et al. [32] (9%) and the highest in Garfield et al. [31], where 90.6% of the patients survived from decannulation and 84.9% at 6 months.
Tabatabai et al. reported that 82.5% completed ECMO therapy and 17.5% remained on ECMO at data collection; only 54.5% survived, and 45.5% died [25], while Yang et al. reported 13.7% survivors: 9.6% of patients were discharged home, 4.1% were transferred to general wards; 5.5% of patients were still in ICUs on invasive ventilator including 2.7% on ECMO at data collection; 63% died by 30 days and 80.8% died by 60 days [26].
In Raasveld et al. 52% of the patients were weaned off ECMO, and after 28 days the survival rate was 63% [27]. Shih et al. reported 33 survivors (62.3%) with a survival rate at 30 days of 100%, and a survival rate at 60 days of 100% [29], while Supady et al. reported a survival rate at 30 days of 54.3%, and at 60 days of 45.7% [34]. Fang et al. reported that 30.7% patients were weaned off ECMO, of whom 17% were discharged and 9.1% remained in hospital at data collection with a 120-day in-hospital survival of 25.7% and mortality rate of 74.3% [30]. A high percentage of survivors was seen in Doyle et al. [35], where 74%, 37.7 out of 51 patients, were successfully weaned off and discharged after ECMO, with 1 patient still on ECMO at data collection. Schmidt et al. reported 53.5% survivors, 2% in ICU weaned off and 2% still on ECMO, with a survival rate after 90 days of 58% [36], while Arachchillage et al. reported a 70.4% survival rate after 180 days [37].
Saeed et al. reported 160 of 292 patients who were weaned off ECMO of whom 135 (46%) were discharged and 25 (9%) remained in hospital; 19 (6%) were still on ECMO at data collection and the cumulative incidence on in-hospital survival rate was 58% [38], with a similar survival rate in Nguyen et al., 54.1% [28].
Successful V-V and V-A ECMO weaning with subsequent survival was reported to be less than 50% in most of the implanting centres in Onorati et al. [39].
Loforte et al. [40] reported a primary configuration with 67 patients on V-V ECMO, 4 patients with multiorgan failure who were upgraded to V-A-V ECMO and 5 patients with a second configuration of V-A ECMO. 36.6% of patients survived, 54.9% died on ECMO including the second configuration cases, and 8.5% died after ECMO removal.
Bergman et al. reported a survival rate at 60 days of 65.2% [41], while Li et al. reported a 29% survival rate after 60 days [42]. Biancari et al. reported that after 6 months the survival rate was 46.9% [43].
Also, Mustafa et al. reported that 71% were decannulated from ECMO of whom 67.5% were discharged, 8% remained hospitalized at data collection and 1 received a double lung transplant before discharge [44]. Ogura et al. reported a survival rate of 66.8% [45]. On the other hand, Cho et al. reported that ECMO therapy increased both the instantaneous and cumulative hazard of death (HR = 1.78) [46]. The remaining studies reported a survival rate between 25% in Zaaqoq et al. [47], and 67.4% in Zhang et al. [55]. Lebreton et al. reported a 46% survival rate at 90 days after completion of ECMO [57].
Severity of illness parameters, treatments, ECMO duration, hospitalization time
In Table IV we described the parameters of the severity illness of patients with COVID-19. We reported that the severity scores correlated with mortality. SOFA, APACHE II and Murray risk scores have been reported at ICU admission in 17 studies. Doyle et al. [35] reported SOFA score 6, which means a risk of mortality < 10%, with a survival rate of 74%. Raasveld et al. [27], Fang et al. [30], Bergman et al. [41], Li et al. [42], Zaaqoq et al. [47], Kunavarapu et al. [50], Zhang et al. [55] and Supady et al. [34, 56] have reported a similar SOFA score between 7 and 9, associated with a 15–20% mortality risk, with a survival rate more than 60%. Tabatabai et al. [25], Schmidt et al. [36], Biancari et al. [43], Luyt et al. [54] and Lebreton et al. [57] have reported a SOFA score between 10 and 12, associated with a mortality risk of 40–50%; the survival rate of these studies was almost 50%. The APACHE II score was reported in Yang et al. [26] as 19, Weir-McCall et al. [32] as 13.9, Supady et al. [34] as 17, Doyle et al. [35] as 14, Li et al. [42] as 12.4, and these studies reported survival rates between 9% in Weir-McCall et al. [32] and 74% in Doyle et al. [35]. The Murray score > 3 was reported in Fang et al. [30] and Zhang et al. [55], with survival rates of 30.7% and 67.4%, respectively.
Table IV
Severity of illness, treatment/intervention, ECMO duration and hospital time course
| Study | Severity of illness parameters, mean | Treatments received (n %) | Days from symptom to mechanical ventilation | Days from intubation to cannulation | ECMO duration [days] | Days on ICU/Hospital length of stay |
|---|---|---|---|---|---|---|
| Tabatabai et al. [25] | SOFA 9.6 (3.0) pH 7.3 (0.1) PaCO2 (mm Hg) 63.9 (18.0) PaO2/FIO2 ratio, (mm Hg) 71.1 (18.7) PIP (cm H2O) 38 (7.5) PEEP (cm H2O) 15.6 (3.5) MAP (cm H2O) 25.1 (4.8) | Remdesivir 27.5% Tocilizumab 30% Methylprednisolone (Meduri Protocol) 67.5% Steroids for inflammation 20% Convalescent Plasma 55% Stem cells 12.5% | NA | 3.4 (2.7) | 29.1 (15.9) | NA/55.6 (22.5) |
| Yang et al. [26] | APACHE II 19 (16–21) pH 7.31 (7.24–7.41) PaCO2 (mm Hg) 63.9 (50–85) PaO2, mm Hg 70 (54–72) PaO2/FIO2 ratio, (mm Hg) 72 (60–85.8) PEEP, cm H2O 10 (8–12) | Steroid therapy 78.6% Convalescent plasma 14.3% | 20 (17–29) | 1.5 (0–6) | 18.5 (12–30) | NA |
| Raasveld et al. [27] | SOFA 9 (7–12) pH 7.35 (7.22–7.42) PCO2, kPa 8 (6.6–10.1) PO2, kPa 8 (6.8–9.3) PaO2/FIO2-ratio, mm Hg 58 (46–76) | Lopinavir/ritonavir 20% Remdesivir 7% Tocilizumab 13% Anti-IL 1 4% Hydroxychloroquine 66% IV Ig 3% Convalescent plasma 0% Plasmapheresis 1% Cytokine absorber 18% | 14 (10–18) | 5 (3–10) | 13 (7–20) | NA |
| Nguyen et al. [28] | NA | NA | NA | NA | NA | 29.1 ±17.3/37.1 ±24.9 |
| Shih et al. [29] | Critically ill, intubated 100% | NA | 3.5 (1–6.8) | NA | 14 (9–30) | 27 (23–58)/37 (27–62) |
| Fang et al. [30] | SOFA score 8 (6–10) Murray score 3 (2.70–3.3) pH < 7.35 38.5% PaCO2 mm Hg 58.65 (42.85–71.83) PaO2/FIO2, mm Hg < 80 41.7% PEEP cm 10 (8–11) PaO2/FIO2, mm Hg 88.75 (65.79–128.27) | Anti-viral treatment 59.1% Anti-microbial treatment 98.9% Anti-fungi treatment 65.9% Corticosteroids 64.8% IV Ig 56.8% Convalescent plasma 21.6% | 20 (15–26) | 3 (1–7) | 13 (5.75–24.25) | 25 (10.75–40)/ 30.5 (13.75–50) |
| Garfield et al. [31] | pH 7.28 (7.18–7.38) PaCO2 (kPa) 8.4 (6.8–10.3) PaO2/FIO2 ratio (kPa) 9.3 (8.1–10.7) PEEP cm H2O 12.5 (10–15) | NA | NA | 3.5 (2.0–6) | 18 (12–30) | NA |
| Weir-McCall et al. [32] | APACHE score 13.9 ±6.1 PaO2, kPa 12.8 ±8.9 | NA | NA | NA | NA | NA |
| Bissell et al. [33] | NA | NA | NA | NA | 16 (25) | 25 (32)/33 (35) |
| Supady et al. [34] | SOFA 9 (7–10) APACHE II 17 (12–21) pH 7.3 (7.2–7.5) pCO2 [mm Hg] 57 (45–67) pO2 [mm Hg] 64 (52–76) PaO2/FIO2 [mm Hg] 70.2 (57.1–97.1) PEEP [mbar] 14 (10–16) | NA | NA | 5 (2–9) | NA | NA |
| Doyle et al. [35] | SOFA 6 (3–16) APACHE II 14 (5–22) | NA | NA | NA | 13 (8–21) | NA |
| Schmidt et al. [36] | SOFA 11 (9–13) pH 7.32 (7.25–7.39) PaCO2, mm Hg 56 (49–65) PaO2, mm Hg 63 (54–70) PaO2/FIO2 60 (54–69) | Lopinavir/ritonavir 13% Remdesivir 11% Tocilizumab 6% High-dose corticosteroids 6% Dexamethasone, ≤ 6 mg/day 46% | 10 (7–13) | 4 (1–7) | 18 (5–35) | 50 (32–75)/74 (49–154) |
| Arachchillage et al. [37] | PaCO2 (kPa) 7.8 (6.4–9.2) PaO2/FIO2 ratio (kPa) 9.4 (8.3–10.7) | Tocilizumab 5.3% Steroids 59.9% IV Ig 3.3% Plasmapheresis 9.2% | NA | 1–6 days 71.1% ≥ 7 days 28.9 % | 17.5 (11–30) | NA |
| Saeed et al. [38] | pH 7.31 (7.21–7.38) PaCO2, mm Hg 56 (45-71) PaO2/FIO2 77 (63–101) | NA | 2 (1–7) | 3 (1–6) | 15 (9–25) | NA |
| Onorati et al. [39] | NA | NA | NA | NA | NA | NA |
| Loforte et al. [40] | PaCO2 mm Hg 63 ±20 PaO2 mm Hg 68 ±39 PaO2/FIO2 78.7 ±39.3 PEEP (cm H2O) 13.3 ±4.1 | Lopinavir 53.5% Ritonavir 50.7% Remdesivir 22.5% Tocilizumab 29.6% Chloroquine 83.1% | NA | 5.5 (1.6–7.1) | 15 (8–23) | 24 (14–37)/30 (18–45) |
| Bergman et al. [41] | SOFA 7.10(02.1) pH 7.3 (00.12) PCO2 56.5 (14.7) PaO2 62.2 (15.9) P/F ratio 72.3 (22.7) PEEP cm H2O 13.70 | Remdesivir 67.4% IL-6 inhibitor 56.5% Steroids 45.7% Hydroxychloroquine – azithromycin 19.6% Convalescent plasma 47.8% | 10 (8–13.75) | NA | 22 (13–36) | 33.(22–51)/39.5 (29–56) |
| Li et al. [42] | SOFA 9.0 ±3.1 APACHE II 12.4 ±3.8 pH 7.39 ±0.11 PaCO2, mm Hg 56 ±20 PaO2, mm Hg 66 ±19 PaO2/FIO2 ratio < 80 mm Hg for 6 h 74% PaO2/FIO2 ratio 76 ±29 | Lopinavir/ritonavir 55% Arbidol 23% Oseltamivir 19% Ganciclovir 13% Ribavirin 7% Remdesivir/placebo 3% | 19 (12–23.5) | 2 (1–4) | 14 (4.5–35) | NA |
| Biancari et al. [43] | SOFA score 10.1 (4.4) pH 7.23 (0.09) PaCO2, mm Hg 61 (17) PaO2/FIO2 ratio, mm Hg 71 (23) PEEP, cm H2O 12.4 (3.7) | Lopinavir/ritonavir 20.5% Oseltamivir 3.8% Ganciclovir 3.8% Acyclovir 3.8% Emtricitabine/tenofovir 0.8% Tocilizumab 6.8% Corticosteroids 35.6% Hydroxychloroquine/chloroquine 25% Convalescent plasma 4.5% Cytokine absorber 6.8% | 30.5 (21.4) | 5.8 (5.3) | 14.6 (11.0) | NA/36.6 (28.1) |
| Mustafa et al. [44] | pH 7.25 (0.01) PaCO2, mm Hg 68.2 (2.3) PaO2, mm Hg 62.3 (1.9) PaO2/FIO2, mm Hg 65.0 (2.2) PEEP, cm H2O 15.6 (0.4) | NA | 4.9 ±0.5 | 3.9 (0.4) | 38.5 (4.2) | NA/56.6 (4.2) |
| Ogura et al. [45] | PaO2/FIO2 86 (71–102) PEEP cm H2O 12 (10–15) | NA | NA | 3 (1–5) | NA | NA |
| Cho et al. [46] | NA | NA | 2 (0–3) | NA | 16 (8–25) | NA/30 (19–46) |
| Zaaqoq et al. [47] | SOFA 8 (5–10) PaCO2 49 (37–59) PaO2/FIO2 84 (61–126) PEEP cm H2O 12 (10–16) | NA | NA | 4 (2–6) | NA | NA/32 (20–47) |
| Suwalski et al. [48] | NA | NA | NA | 7 (3–9) | 18 (7.3) | NA |
| Jacobs et al. [49] | P/F Ratio (SD) 69.5 (27.0) | Interleukin-6, Blocker 61.6% Steroids 28% Hydroxychloroquine 77% Convalescent plasma 47.6% | 7.45 (6.82) | 4.81 (4.72) | 20.3 (16.1) | NA/20.3 (16.1) |
| Kunavarapu et al. [50] | SOFA 7.6 (2.8) SpO2 (%) 87.9 (11.8) | Convalescent plasma 76.9% | NA | 2.42 (2.6) | 20.9 (21.7) | NA |
| Shaefi et al. [51] | pH – 7.30 (7.23–7.36) PaO2/FIO2 ratio, mm Hg – 85 (66–120) PEEP, cm H2O – 15 (12–18) IMV – 78.4% | NA | NA | 2 (0–5) | 16 (10–23) | 31 (20–43)/39 (28–53) |
| Bermea et al. [52] | NA | NA | NA | NA | NA | NA |
| Fröhlich et al. [53] | NA | NA | NA | NA | Time on ECMO was < 48 h28.3% 2–12 days 47.2% 12–32 days 15.1% | NA |
| Luyt et al. [54] | SOFA 12 (10–14) | Lopinavir/ritonavir 18% Remdesivir 12% Hydroxychloroquine 40% | 11 (7–14) | NA | 21 (10–34) | 48 (34–68)/NA |
| Zhang et al. [55] | SOFA score 7 (4–10) Murray ≥ 3 pH 7.30 (7.19–7.36) PaCO2 mm Hg 67.5 (53.1–75.8) PaO2/FIO2 67.5 (58.9–77.8) | Remdesivir 13.8% Anakinra 24.1% Methylprednisolone 82.8% Hydrocortisone 3.4% Hydroxychloroquine 6.9% | NA | 5 (2–6) | 13 (8–20) | NA |
| Supady et al. [56] | SOFA 9.0 (8.0–10.0) pH 7.34 (7.17–7.39) PaCO2, mm Hg 65.5 (42.5–80.1) PaO2, mm Hg 57.3 (48.5–70.7) PaO2/FIO2, mm Hg 62.7 (48.5–72.7) | Remdesivir 29% Lopinavir–ritonavir 18% Tocilizumab 12% Methylprednisolone 53% Hydroxychloroquine 24% | 5 (0.5–11) | NA | NA | NA |
| Lebreton et al. [57] | SOFA 12 (9–14) pH 7.31 (7.23–7.37) PaCO2, mm Hg 57 (48–67) PaO2/FIO2, mm Hg 61 (54–70) SaO2 88% (83–92) | Steroids 20% | NA | 5 (3–7) | 14 (8–26) | 30 (17–47)/NA |
[i] SOFA – Sequential Organ Failure Assessment, APACHE II – Acute Physiology and Chronic Health Evaluation, IMV – invasive mechanical ventilation, FiO 2 – fractional inspired oxygen, PaCO 2 – arterial partial pressure of carbon dioxide, PaO 2 – arterial partial pressure of oxygen, PaO 2 /FiO 2 – ratio of arterial oxygen partial pressure to fractional inspired oxygen, MAP – mean airway pressure, P IP – peak inspiratory pressure, IV Ig – intravenous immunoglobulin, anti-IL – anti-interleukin.
In these studies, we observed a tendency to acidosis (Table IV).
21 studies reported mechanical ventilation parameters before ECMO initiation: Tabatabai et al. [25], Yang et al. [26], Raasveld et al. [27], Fang et al. [30], Garfield et al. [31], Supady et al. [34, 56], Schmidt et al. [36], Arachchillage et al. [37], Saeed et al. [38], Loforte et al. [40], Bergman et al. [41], Li et al. [42], Biancari et al. [43], Mustafa et al. [44], Ogura et al. [45], Zaaqoq et al. [47], Jacobs et al. [49], Shaefi et al. [51], Zhang et al. [55] and Lebreton et al. [57]. Of all these studies, 2 patients had ECMO initiated while receiving non-invasive mechanical ventilation (Yang et al.) [26], (Fang et al.) [30]. In Yang et al. [26] the patient was intubated 2 days later and ventilated invasively. In Fang et al. [30] the patient received ECMO therapy while awake and without mechanical ventilation. The ventilation parameters are summarized in Table IV.
Table V
Adverse events related to ECMO usage
| Study | Median age | Acute renal failure | Deep vein thrombosis/Pulmonary embolism | Myocardial infarction | Pneumothorax | Sepsis | Stroke/Intracranial haemorrhage |
|---|---|---|---|---|---|---|---|
| Tabatabai et al. [25] | 43.2 (8.9) | NA | NA | NA | 47.5% | 17.5% Urinary tract infection 72.5% Bacteraemia 55% Pneumonia | 6.7% intracranial haemorrhage-cause of death |
| Yang et al. [26] | 62 (33–78) | 71.2% | NA | NA | 13.7% | 57.5% | 4.1% intracranial haemorrhage associated with gastro-intestinal haemorrhage 2.7% only cerebral haemorrhage |
| Raasveld et al. [27] | 52 (47–57) | 55% | 11% venous thrombotic event/3% PE | NA | NA | 56% infections: 23 ventilator-associated pneumonia, 9 catheter-related bloodstream infection, 6 superinfection | 1.5% ischaemic strokes/10% haemorrhagic stroke |
| Nguyen et al. [28] | NA | NA | NA | NA | NA | NA | NA |
| Shih et al. [29] | 50 (41–56) | NA | NA | NA | NA | 20% bacterial pneumonia infection | 0% strokes, 9.4% haemorrhagic brain injury |
| Fang et al. [30] | 58.5 (47–66.5) | 67.4% | NA | NA | 10.2% | 79.6% nosocomial infection | 4.5% cerebral haemorrhage |
| Garfield et al. [31] | 46 (7.8) | 45.3% | 69.8% PE | NA | 16.9% | NA | 11.3% ischaemic strokes, 20.8% intracranial haemorrhage |
| Weir-McCall et al. [32] | 45.0 ±9.4 | 0 | 52%-pulmonary artery thrombus, 8% venous thrombus | NA | NA | NA | 5% brain ischaemia, 14% intracranial haemorrhage |
| Bissell et al. [33] | 51 (14) | NA | 3.1% DVT, 3.1% PE | NA | NA | NA | NA |
| Supady et al. [34] | 59 (53–66) | NA | NA | NA | NA | NA | NA |
| Doyle et al. [35] | 46.1 (35.6–53.2) | NA | 53% DVT/37% – all pulmonary artery filling defects, 33.3% PE, 5% pulmonary immunothrombosis | NA | NA | NA | 3.9% ischaemic strokes, 16% intracranial haemorrhage-7 subarachnoid, 1 subdural |
| Schmidt et al. [36] | 51 (43–58) | (40%) | 14% PE | NA | (11%) | NA | 6.2% – 2 ischaemic, 8 haemorrhagic |
| Arachchillage et al. [37] | 47 (23–65) | NA | 19.1% DVT/66.2% PE, 14.7% DVT + PE | NA | NA | NA | 3.9% ischaemic strokes/34% ICH |
| Saeed et al. [38] | 49 (39–57) | 46% | 15% DVT | NA | NA | 153 (55%): 91 bacterial pneumonia, 92 bacteraemia, 8 central line infection, 31 urinary infection | 1% ischaemic strokes, 6% haemorrhagic strokes |
| Onorati et al. [39] | NA | NA | NA | NA | NA | NA | NA |
| Loforte et al. [40] | 55.4 (46.1–64.7) | 4.2% | 2.8% DVT, 5.6% PE | NA | NA | 19.7% | 8.5% ischaemic strokes |
| Bergman et al. [41] | 51.3 (10) | 45.7% | NA | NA | NA | 1.3% | NA |
| Li et al. [42] | 58 (46–64.5) | 87% | NA | NA | NA | 45% septic shock, 97% nosocomial infection | 3% intracerebral haemorrhage |
| Biancari et al. [43] | 51.1 (41.4–60.8) | 64.1% | 11.4% DVT, 13.6% PE | NA | NA | 31.8% bloodstream infection | 14.4% ischemic strokes |
| Mustafa et al. [44] | 49 (22–67) | 22.5% | NA | NA | NA | 17.5% septic shock, 23.8% VAP | 8.8% strokes |
| Ogura et al. [45] | 60 (53–68) | NA | NA | NA | NA | NA | NA |
| Cho et al. [46] | 52 (12.0) | NA | NA | NA | NA | NA | 7.8% – 5.3% haemorrhagic stroke, 1.1% ischaemic stroke, 1.4% unsuspected type |
| Zaaqoq et al. [47] | 53 (43–60) | NA | NA | NA | NA | NA | NA |
| Suwalski et al. [48] | 50.2 (8.9) | NA | NA | NA | NA | NA | NA |
| Jacobs et al. [49] | 51 (40–59) | 12/110 who died | NA | NA | 1/110 who died | 7/110 who died | 5/110 who died had cerebral bleeding |
| Kunavarapu et al. [50] | 47.8 (12.1) | NA | 15.4% DVT | NA | 1.9% –hemoptx | NA | 3.9% strokes |
| Shaefi et al. [51] | 49 (41–58) | 21.8% | 18.4% DVT/1.6% PE | NA | 12.6% | 34.7% Bacterial pneumonia, 18.4% Other culture documented infections | 1.6% ischaemic stroke, 4.2% Intracranial haemorrhage |
| Bermea et al. [52] | NA | NA | NA | NA | NA | NA | 33.3% intracranial haemorrhage |
| Fröhlich et al. [53] | 57 (50–67) | NA | NA | NA | NA | NA | NA |
| Luyt et al. [54] | 48 (42–56) | NA | NA | NA | NA | 86% VAP | NA |
| Zhang et al. [55] | 46 (35.5–52.5) | 44.2% | 39.5% DVT, 27.9% PE | NA | 11.6% | 34.9% infection | 7% ischaemic stroke, 16.3% Intracranial haemorrhage |
| Supady et al. [56] | 60.5 (43.5–71.5) | NA | NA | NA | NA | 29% died of septic shock in cytosorb group and 12% in the group without | 12% intracranial haemorrhage |
| Lebreton et al. [57] | 52 (45–58) | 43% | 17.5% | NA | 7.6% | 16% | 11% |
Intervention/treatment
Regarding the pharmacological intervention, the antiviral remdesivir was used in 10 studies and varied between 3% (Li et al.) [42] and 67.4% (Bergman et al.) [41]. The monoclonal antibody (MAB) tocilizumab, has been used in 10 studies, ranging from 5.3% (Arachchillange et al.) [37] to 61.6% (Jacobs et al.) [49]. Steroid treatment was used in 11 studies from 20% (Lebreton et al.) [57] to 82.8% (Zhang et al.) [55]. The use of hydroxychloroquine/chloroquine was registered in 8 studies and ranged from 6.9% (Zhang et al.) [55] to 83.1% (Loforte et al.) [40]. The use of intravenous immunoglobulin has been reported in three studies, from 3% (Raasveld et al.) [27] to 56.8% (Fang et al.) [30]. Convalescent plasma/plasmapheresis was used in nine studies. The use of convalescent plasma ranges from 4.5% (Biancari et al.) [43] to 76.9% (Kunavarapu et al.) [50], while the use of plasmapheresis varies from 1% (Raasveld et al.) [27] to 9.2% (Arachchillage et al.) [37]. The use of a cytokine absorber has been reported in two studies, 6.8% in Biancari et al. [43], and 18% in Raasveld et al. [27], while stem cell treatment was used in only one study by 12.5% of patients [25] (Table IV).
Hospitalization time
The shortest length from symptom onset to invasive mechanical ventilation initiation was 2 days reported by Saeed et al. [38] and Cho et al. [46], while the longest duration was 30.5 days registered by Biancari et al. [43]. Between the onset of invasive mechanical ventilation and ECMO initiation, the shortest period was 1.5 days reported by Yang et al. [26], while the longest was 7 days reported by Suwalski et al. [48].
ECMO duration varied; the shortest time is described by Raasveld et al. [27], Fang et al. [30], Doyle et al. [35] and Zang et al. [55] with 13 days, and the longest period was reported by Mustafa et al. [44] with 38.5 days.
The shortest period of ICU and hospital lengths of stay was 24 days reported by Loforte et al. [40], and 20.3 days registered by Schmidt et al. [36], respectively, while the longest time spent was reported by Schmidt et al. [36] for both places, 50 days in the ICU and 74 days in hospital.
Adverse events related to ECMO usage
Acute kidney injury
Acute kidney injury requiring renal replacement therapy varied between 0% in Weir-McCall et al. [32] and 87% in Li et al. [42], as shown in Table V.
Acute pulmonary embolism and deep vein thrombosis
Fourteen studies reported venous and pulmonary thromboembolic events.
Schmidt et al. presented a 14% rate of pulmonary embolism [36] with a similar rate in Biancari et al., of 13.6% [43]. Garfield et al. reported 69.8% rate of pulmonary embolism [31], Arachchillage et al. 66.2%, with 19.1% deep vein thrombosis [37]. Kunavarapu et al. observed that 15.4% of patients had deep vein thrombosis [50], with a similar rate in Saeed et al. [38] (15%). Also, similar rates of deep vein thrombosis were observed in Biancari et al. [43] (11.4%), and Raasveld et al. [27] with a 11% venous thrombotic event rate. Weir-McCall et al. reported 52% pulmonary artery thrombus with 8% venous thrombus [32], while Doyle et al. reported that 37% of all pulmonary arteries had filling defects, 53% of patients had deep vein thrombosis and 33.3% pulmonary embolism [35].
Lebreton et al. reported 17.5% thromboembolic complications [57], having similar rates with Shaefi et al., 20% (18.4% with deep vein thrombosis, and 1.6% with pulmonary embolism) [51]. Bisell et al. reported a 3.1% rate of deep vein thrombosis and 3.1% rate of pulmonary embolism [33]. Shaefi et al. [51], Loforte et al. [40], and Zhang et al. [55] reported pulmonary embolism rates ranging from 1.6% to 27.9% while Loforte et al. [40] and Zhang et al. [55] revealed deep vein thrombosis rates between 2.8% and 39.5%.
Pneumothorax
Pneumothorax was diagnosed in 8 studies and varied between 7.6% (Lebreton et al.) [57] and 47.5% (Tabatai et al.) [25]. Kunavarapu et al. reported 1 case of hemopneumothorax [50].
Infectious complications
18 studies described infectious complication rates ranging from 1.3 % in Bergman et al. [41] to 97% in Li et al. [42]. The most common infectious complications are nosocomial infections reported in Li et al. (97%) [42], and Fang et al. (79.6%) [30], followed by bacterial pneumonia reported by Tabatai et al. (55%) [25], Shaefi et al. (34.7%) [51], Shih et al. (20%) [29], and Saeed et al. [38], who reported 91/153 patients with bacterial pneumonia. Also, ventilator-associated pneumonia (VAP) was seen in 3 studies, Mustafa et al. [44] reporting 23.8%, Luyt et al. [54] 86% and Raasveld et al. [27] 23 of 40 patients with infectious complications. Sepsis was found in 1.3% of patients by Bergman et al. [41], 16% of patients by Lebreton et al. [57], 19.7% by Loforte et al. [40].
Yang et al. [26] found sepsis in 57.5% of patients, while septic shock was found in 17.5% of patients by Mustafa et al. [44], 45% of patients by Li et al. [42], and in 41% of cases in Supady et al. [56].
Other encountered complications were urinary infection [25, 38], bacteraemia [25, 38], and central line infections [27, 38].
Neurological impairments
Cerebral complications were mentioned in 25 studies, from no cerebrovascular accidents in Shih et al. [29] to 34% intracranial haemorrhage in Arachchillage et al. [37]. Cho et al. reported that cumulative probabilities for haemorrhagic and ischaemic stroke were higher at 90 days of ECMO support comparing to non-ECMO-supported cases [46]. The main complications of ECMO usage are presented in Table V.
Thrombosis and bleeding
Eight studies encountered acute ECMO circuit thrombosis with the highest rate in Zhang et al. [55] (39.5%). 3.8% of patients in Shih et al. [29], 6.1% in Bisell et al. [33], 9.9% in Arachchillage et al. [37], 10% in Lebreton et al. [57], 11% in Schmidt et al. [36], and 13% in Li et al. [42] had the same complication, with the lowest rate in Raasveld et al. [27] (1.5% cannula thrombosis and no pump thrombosis).
Mustafa et al. [44] reported the smallest rate of bleeding at insertion site, 1.3% of patients, with the highest rate reported by Yang et al. (32.9%) [26], with intermediate values in Shih et al. [29], Kunavarapu et al. [50], Fang et al. [30], Schmidt et al. [36], and Raasveld et al. [27]. Arachchillage et al. [37] and Tabatabai et al. [25] had the same rate of bleeding at insertion site, 15%.
Twenty-five studies [25–27, 29–38, 40–44, 46, 49–52, 55, 57] reported major bleeding with the necessity of blood transfusions in some cases and they varied from 4.2% in Loforte et al. [40] to 92.1% in Arachchillage et al. [37]. The complications are presented in detail in Table VI.
Table VI
Thrombosis and bleeding complications on ECMO usage
| Study | Pump/cannula thrombosis | Bleeding at site of insertion | Major bleeding |
|---|---|---|---|
| Tabatabai et al. [25] | NA | 15% | 67.5% |
| Yang et al. [26] | NA | 32.9% | 42.5% – 25 gastrointestinal haemorrhage, 6 respiratory tract haemorrhages |
| Raasveld et al. [27] | 0%/1.5% | 14% | 54% |
| Nguyen et al. [28] | NA | NA | NA |
| Shih et al. [29] | 3.8% complications of ECMO circuit | 1.9% | 37.7% |
| Fang et al. [30] | NA | 4.5% | 28.4% – –2 pulmonary haemorrhage, 19 gastrointestinal haemorrhage, 4 intracranial haemorrhage 9.2% died of lethal haemorrhage |
| Garfield et al. [31] | NA | NA | NA 20.8% intracranial haemorrhage |
| Weir-McCall et al. [32] | NA | NA | 16% – 9 brain, 1 abdomen |
| Bissell et al. [33] | 6.1% | NA | 12.1% |
| Supady et al. [34] | NA | NA | NA |
| Doyle et al. [35] | NA | NA | 11.7% major bleeding – 3 intracerebral, 2 retroperitoneal, 1 pleural |
| Schmidt et al. [36] | 11% | 10% | 44% |
| Arachchillage et al. [37] | 9.9% | 15% | 30.9%: intracranial haemorrhage – 34%, pulmonary haemorrhage – 26%, gastrointestinal haemorrhage – 11%, other sites – 23% A total of 92.1% received one or more red cell unit |
| Saeed et al. [38] | NA | NA | 74% bleeding requiring transfusion 3% died of haemorrhagic shock |
| Onorati et al. [39] | NA | NA | NA |
| Loforte et al. [40] | NA | NA | 4.2% |
| Bergman et al. [41] | NA | NA | 23.9 number of transfusions |
| Li et al. [42] | 13% oxygenator thrombosis | NA | 35.4% |
| Biancari et al. [43] | NA | NA | 79.5% RBC transfusion |
| Mustafa et al. [44] | NA | 1.3% | 12.5% |
| Ogura et al. [45] | NA | NA | NA |
| Cho et al. [46] | NA | NA | 5.3% haemorrhagic stroke |
| Zaaqoq et al. [47] | NA | NA | NA |
| Suwalski et al. [48] | NA | NA | NA |
| Jacobs et al. [49] | NA | NA | NA 5/110 who died had cerebral bleeding |
| Kunavarapu et al. [50] | NA | 3.8% | 32.7% |
| Shaefi et al. [51] | NA | NA | 27.9% systemic bleeding events |
| Bermea et al. [52] | NA | NA | 33.3% intracranial haemorrhage |
| Fröhlich et al. [53] | NA | NA | NA |
| Luyt et al. [54] | NA | NA | NA |
| Zhang et al. [55] | 39.5% | NA | 18.6% |
| Supady et al. [56] | NA | NA | 12% intracranial haemorrhage in both groups 18% died of pulmonary haemorrhage |
| Lebreton et al. [57] | 10% | NA | 38% – major bleeding 9% – intracranial haemorrhage |
Study quality
Quality score of the included studies ranged from 6 to 9, with a mean quality score of 7.42. This corresponds to a medium-to-high quality of the included studies. The detailed scores are provided in Table VII.
Table VII
Newcastle-Ottawa scale for assessment of quality of included studies (each asterisk represents that individual criterion within the subsection was fulfilled)
| Quality assessment Criteria | (1) Representativeness of the exposed cohort | (2) Selection of the nonexposed cohort | (3) Ascertainment of exposure | (4) Demonstration that outcome of interest was not present at the start of the study | (5) Adequate control for the most important confounder? | (6) Adequate control for any additional factor? | (7) Assessment of outcome | (8) Was follow-up long enough for outcomes to occur? | (9) Adequacy of follow-up of cohorts | Overall quality score (maximum = 9) |
|---|---|---|---|---|---|---|---|---|---|---|
| Acceptable (*) | Representative of average adult in community (age/sex/being at risk of disease) | Drawn from the same community as the exposed cohort | Secure record, structured interview | Independent or blind assessment | Complete follow-up, or subjects lost to follow-up unlikely to introduce bias | |||||
| Tabatabai et al. [25] | * | – | * | * | * | – | * | * | – | 6 |
| Yang et al. [26] | * | – | * | * | * | * | * | * | – | 7 |
| Raasveld et al. [27] | * | – | * | * | * | * | * | * | * | 8 |
| Nguyen et al. [28] | * | * | * | * | * | * | * | – | * | 8 |
| Shih et al. [29] | * | – | * | * | * | * | * | * | * | 8 |
| Fang et al. [30] | * | * | * | * | * | * | * | * | * | 9 |
| Garfield et al. [31] | * | – | * | * | * | – | * | * | * | 7 |
| Weir–McCall et al. [32] | * | – | * | * | * | * | * | – | – | 6 |
| Bissell et al. [33] | * | – | * | * | – | – | * | * | * | 6 |
| Supady et al. [34] | * | – | * | * | * | * | * | * | * | 8 |
| Doyle et al. [35] | * | – | * | * | * | * | * | * | * | 8 |
| Schmidt et al. [36] | * | – | * | * | * | * | * | * | * | 8 |
| Arachchillage et al. [37] | * | – | * | * | * | * | * | * | * | 8 |
| Saeed et al. [38] | * | – | * | * | * | – | * | * | – | 6 |
| Onorati et al. [39] | * | – | * | * | * | * | * | – | – | 6 |
| Loforte et al. [40] | * | – | * | * | * | * | * | * | * | 8 |
| Bergman et al. [41] | * | – | * | * | * | * | * | * | * | 8 |
| Li et al. [42] | * | – | * | * | * | * | * | * | * | 8 |
| Biancari et al. [43] | * | – | * | * | * | * | * | * | * | 8 |
| Mustafa et al. [44] | * | * | * | * | * | * | * | * | * | 9 |
| Ogura et al. [45] | * | – | * | * | * | – | * | – | * | 6 |
| Cho et al. [46] | * | * | * | * | * | * | * | * | * | 9 |
| Zaaqoq et al. [47] | * | – | * | * | * | – | * | – | * | 6 |
| Suwalski et al. [48] | * | – | * | * | – | – | * | * | * | 6 |
| Jacobs et al. [49] | * | – | * | * | * | – | * | * | * | 7 |
| Kunavarapu et al. [50] | * | – | * | * | * | – | * | * | * | 7 |
| Shaefi et al. [51] | * | * | * | * | * | * | * | * | * | 9 |
| Bermea et al. [52] | * | – | * | * | * | * | * | – | * | 7 |
| Fröhlich et al. [53] | * | – | * | * | * | – | * | * | – | 6 |
| Luyt et al. [54] | * | – | * | * | * | * | * | * | * | 8 |
| Zhang et al. [55] | * | – | * | * | * | * | * | * | * | 8 |
| Supady et al. [56] | * | – | * | * | * | * | * | * | * | 8 |
| Lebreton et al. [57] | * | – | * | * | * | * | * | * | * | 8 |
Discussion
Our systematic review included 33 articles from 10 countries with a total of 4 760 patients receiving ECMO for COVID-19 and we identified the benefits and the side effects of using ECMO in the COVID-19 patients with acute respiratory distress syndrome (ARDS) refractory to conventional management (Figure 2).
Reported mortality in our analysis is similar to the ECMO usage in non-COVID-19 ARDS, but with higher rates of bleeding and thrombotic complications. The need for anticoagulation on ECMO creates a higher bleeding risk profile that can be fatal in some cases, adding major bleeding that may require blood transfusions. Also, the high thrombotic status of SARS-CoV-2 infection sometimes creates the urgency of changing the entire ECMO circuit. In our opinion, acute kidney failure, major bleeding, and strokes are not only related to the usage of ECMO but also to the COVID-19 infection.
It is well known that the thrombogenic status in COVID-19 creates the premises of developing pulmonary thromboembolism, acute myocardial infarction, or strokes. In a systematic review that included patients with COVID-19, 39% had limb thrombosis, while 24% had cerebral and 9% had coronary events [58].
Other studies have reported a relation between acute coronary syndromes and COVID-19 caused by coronary artery thrombosis, even without a pre-existing atherosclerotic lesion [59, 60]. None of the studies included in our analysis reported acute coronary syndromes, but several reported pulmonary embolisms.
There are still gaps in establishing the key role that mechanical circulatory support may have in cardiogenic shock due to myocardial infarction in patients with COVID-19, but the high mortality rates in these patients may justify the usage of any circulatory support to improve patient’s survival [61]. In a systematic review that analysed the impact of ECMO in COVID-19 patients the authors proposed a decision-making algorithm, by choosing the V-A ECMO in case of cardiogenic shock and V-V ECMO for patients without it [62].
Also, COVID-19 patient evolution may be influenced by the occurrence of the cytokine storm, which may require the addition of cytokine filters [63] to mechanical circulatory support, beside standard care therapy with cytokine receptor antagonists [64]. However, the results of a recently published randomised controlled study comparing ECMO with or without cytokine adsorption during the first 72 h of V-V ECMO for severe COVID-19 showed no benefits in terms of IL-6 reduction levels or survival of the patients but was associated with higher mortality in the cytokine adsorption group [56].
The use of ECMO appears to be an effective intervention and to bring improvements in selected patients with COVID-19-related ARDS as stipulated in the latest systematic reviews [65, 66]. These studies focused more on the efficacy of the V-V ECMO type and suggested clinical advice in the current era and ongoing pandemic.
In another systematic review [67] which included 18 studies that also analysed the effect of ECMO on improving COVID-19 patients’ outcomes, the authors concluded with the need for future research.
The recently published ELSO guideline on ECMO in COVID-19 emphasizes the need of careful selection of the COVID-19 patients who might benefit from ECMO treatment, according to the patient’s clinical profile but also to the medical system capacity, the recommendation for initiating ECMO being different if the capacity is conventional, expanded, near saturation or overwhelmed. The guideline clearly states that the mortality of the patients with severe COVID-19 treated by ECMO is similar to historical ECMO treated patients with ARDS of other causes [68].
In conclusion, our study has its limitations and strengths. There is a lack of ECMO standardization in COVID-19. We referred to ECMO in COVID, in general, because we did not have enough evidence to suggest what type of ECMO (V-V or V-A) has a more beneficial use.
We believe that ECMO may be a useful support device and rescue therapy in sustaining pulmonary function by using veno-venous type and for cardiac involvement, veno-arterial type ECMO usage may provide substantial benefits, but further studies need to be done.
The unknown mechanisms and effects of SARS-CoV-2 infection are still creating great pressure on medical systems worldwide. As studies described, the most severe cases require aggressive therapy, but sometimes standard care measures reach their limits.
The use of ECMO therapy in treating severe COVID-19 patients can be performed in a more standardised manner than at the beginning of the pandemic period, due to the recently published study results. However, patients’ clinical status and prognosis and the medical system capacity must be taken into account when deciding to start ECMO on a COVID-19 patient, since this treatment does not always save lives.