Introduction
In recent years it has been proposed that the intrarenal renin–angiotensin system (RAS) plays an important role in maintaining sodium balance and blood pressure (BP) [1, 2]. Intrarenal RAS exerts pleiotropic regulatory actions on renal haemodynamic and transport processes [3, 4]. Kidney is unique because it has all the necessary components of the RAS in different compartments of renal structures combined with their intracellular accumulation. It was found that angiotensinogen (AGT) and angiotensin II (Ang II) levels in proximal tubules were greater than could be explained from the plasma concentrations [5–7].
Lately, significant attention has been paid to the possible markers of intrarenal RAS activity, which could be measured in the urine. Navar et al. showed that the increased Ang II concentration led to stimulation of AGT expression in proximal tubule cells [8]. What is interesting, in experimental studies a positive relationship between intrarenal Ang II levels and urine AGT excretion rates was shown, indicating that urine AGT might serve as an index of intrarenal RAS activity [9, 10]. Higher urine AGT concentration was also found in patients with hypertension (HT), which allowed urine AGT to be considered as a potential marker of intrarenal RAS activation [11, 12]. However, another study in diabetic and non-diabetic patients with HT revealed that urine renin (REN), and not urine AGT or aldosterone, was an important marker of renal RAS activity [13].
Because there is no consensus in the literature about which of the components of RAS better correlates with BP and available data focus on adult hypertensive patients, this study has been designed to assess urine concentration of AGT as well as REN in hypertensive children and adolescents. There is a paucity of similar investigations in the paediatric population with primary HT. We suspect that the activation of the intrarenal RAS occurs in hypertensive children, and we have tried to verify what better reflects this activity: urine AGT or REN. We also assume that some relation between intrarenal RAS activity markers and other biochemical parameters might be possible.
Material and methods
This was a study of 58 (19 girls) hypertensive children and adolescents. The participants were referred to the Department of Paediatrics and Nephrology, Medical University of Bialystok within 24 months. The subjects were sent to our unit by general practitioners after observation of elevated BP measurements in ambulatory conditions or to carry out follow-up visits. None of them was on antihypertensive therapy.
Inclusion criteria: children and adolescents aged 4–18 years, arterial HT (confirmed by ambulatory blood pressure monitoring (ABPM) and/or three separate casual BP measurements > 95th centile), normal concentration of thyroid-stimulating hormone (TSH) and creatinine in serum, no abnormalities in urinalysis or ultrasound examination of the abdomen, and normal electrocardiogram.
Exclusion criteria: heart failure, renal dysfunction, confirmed secondary forms of HT, diseases of thyroid or adrenal glands, diabetes mellitus, systemic inflammatory conditions, autoimmune and haematological disorders, and use of contraceptives in females.
The reference group consisted of 29 children and adolescents (19 girls), diagnosed in our Department because of nocturnal enuresis, without any pharmacological treatment, and with normal BP. Their blood and urine tests were within the normal range. Also, their family history did not reveal HT, cardiovascular or renal disease, or diabetes. Physical examination was also normal.
Written, informed consent was obtained from parents and all participants over 16 years old. The study protocol was approved by the Local Bioethics Committee, Medical University of Bialystok.
In all subjects the medical past and present history was taken from the parents. Also, careful physical examination was performed in all participants. Body weight and height were measured using a balance beam scale and a paediatric wall-mounted stadiometer. Body mass index (BMI) was calculated as weight (kilograms) divided by the square of height (metres squared). Age- and height-specific reference values for BMI were generated by the Lambda-Mu-Sigma (LMS) method [14]. The LMS values were taken from the OLAF study, published by Kułaga et al. [15]. Blood pressure was measured using an automatic manometer Mindray VS 800, validated for paediatric use in a sitting position. The cuff was selected according to the Fourth Report on the Diagnosis, Evaluation, and Treatment of High Blood Pressure in Children and Adolescents [16]. Subjects had three measurements taken in 3-minute intervals, and the average of the second and third measurement were calculated. Then estimated standard deviation score (SDS) of systolic and diastolic BP was used for further analysis. We used reference data based on the OLAF study [15].
In the hypertensive and reference group, after 12-hour overnight fasting, blood and urine samples were taken for the measurement of serum concentrations of creatinine, glucose, lipid profile, and urine creatinine as well as REN and AGT. Also, a 24-hour urine collection was carried out to assess the excretion of sodium (Na) and albumin. The estimated glomerular filtration rate (eGFR) was calculated by the Schwartz formula: eGFR = x × G (cm)/Lcr (mg/dl), where x is a constant depending on age and sex (0.33 – in low birth weight infants, 0.45 – in term infants, 0.55 – in children and adolescent girls and 0.7 – in adolescent boys), G is height, and Lcr is the level of creatinine in the serum.
The urine concentration of REN was measured, according to the manufacturer’s instructions, using a commercially available enzyme-linked immunosorbent assay (ELISA) kit (Human Renin Quantikine ELISA Kit, R&D Systems, Minneapolis, MN). In short, a monoclonal antibody specific for renin, which had been pre-coated onto a micro plate, was used to detect renin in the urine samples. After washing away any unbound substances, the antibody detecting renin, which had been conjugated to horseradish peroxidase, was added. Then (after the next use of wash buffer) the colour-forming peroxidase substrate containing tetramethylbenzidine was added. The colour was measured at 450 nm by a microtiter plate reader and compared with a standard curve. Urinary renin levels were expressed in picograms per millilitre (pg/ml). The minimum detectable concentration of REN of this assay ranged from 0.769 to 14.8 pg/ml (mean: 4.43 pg/ml).
The urine AGT concentration was also measured using a commercially available ELISA kit (ELISA Kit for Angiotensinogen (AGT), Cloud-Clone Corp., Houston, TX). In brief, a biotin-conjugated antibody specific for AGT, which had been pre-coated onto a micro plate, was used to detect AGT in the samples of urine. Next, the biotin-binding protein conjugated to horseradish peroxidase and the colour-forming peroxidase substrate containing tetramethylbenzidine were added. The colour was measured at 450 nm by a microtiter plate reader and was likened with a standard curve. Urinary AGT levels were expressed in nanogram per millilitre (ng/ml). The minimum detectable concentration of AGT is typically less than 0.62 ng/ml.
The REN and AGT measurements were normalised by urine concentration of creatinine to account for the influence of urinary dilution on their concentration [17]. Therefore, the concentration of REN was expressed as the urine-REN-to-creatinine ratio (renin/cr.) in picograms per milligram of creatinine (pg/mg), and the AGT concentration as the urine-AGT-to-creatinine ratio (AGT/cr.) in nanograms per milligram of creatinine (ng/mg). Serum and urine creatinine were determined by updated Jaffe reaction. Urine excretion of Na was assessed with a Cobas-Integra 800 analyser and Roche reagents (Roche, Indianapolis, IN). The 24-h urinary albumin excretion rate (UAER) was analysed by radioimmunoassay method. Albuminuria was considered as a 24-h UAER of > 30 mg/day.
ABPM was performed in hypertensive children and adolescents using an oscillometric blood pressure monitor (SpaceLab, Redwood, WA). The monitors were programmed to measure BP every 15 min during the daytime (8:00–22:00) and every 30 min during the night-time (22:00–8.00), with the correction of these periods according to the individual diaries of each subject. The recording began between 8 and 9 a.m. and lasted for 24 h. Recordings with a minimum 80% of measurement and without breaks longer than 2 h were accepted. The mean systolic BP (SBP) and diastolic BP (DBP) were calculated for the 24-h and for the awake and asleep periods. Also, the load systolic (LSBP) and diastolic (LDBP) blood pressure during the day and night were analysed. HT on the basis of ABPM was defined as mean systolic or diastolic daytime or night-time BP levels ≥ 95th percentile and LSBP or LDBP daytime or night-time levels > 25% [18]. The values were adjusted by gender and body height according to the reference values provided by Wühl et al. [19]. Each subject or his/her parent was asked to record the bedtime and time of awakening. After 24 h, the cuff and monitor were removed, and the data were downloaded using the manufacturer’s software.
Statistical analysis
Sample-size calculation was done using e-picos software (AEK Contracted R&D and Education Company, Mersin Technoscope, Turkey). Data analysis was performed using a computer program Statistica (data analysis software system, StatSoft Inc., 2012), version 10. Categorical variables are expressed as counts (percentage) and continuous variables as median and interquartile range (Q1–Q3) unless stated otherwise. The Shapiro-Wilk test was used for normality of distribution. The comparison between the two groups was done with the χ2 test and Fisher exact test for categorical variables and Mann-Whitney test if variables were not normally distributed. Correlations between REN/cr., AGT/cr., and other variables (values and clinical and laboratory parameters) were evaluated by Spearman’s test. The value of p < 0.05 was considered statistically significant.
Results
The demographic, clinical, and laboratory data of the study and reference group are summarised in Table I. In the hypertensive group male subjects were predominant, which is consistent with other reports. The body weight and height of HT subjects was higher than the healthy children and adolescents. Nevertheless, there was no statistically significant difference between the median percentile of body weight or height between those two groups (p > 0.05). Similarly, BMI SDS values did not differ significantly between hypertensive and reference participants. Ten subjects from the HT group and five from reference were classified as obese. Both systolic and diastolic BP (SBP SDS and DBP SDS) were significantly higher in the HT group (p < 0.01). Moreover, the HT subjects had significantly higher serum concentration of creatinine (p < 0.05), although within the normal range for age and sex in both groups. The groups did not differ in the serum albumin, glucose, and lipid concentrations. There was also no difference in urine Na excretion.
Table I
Anthropometric, clinical, and metabolic characteristics of examined (HT) and reference (R) groups (together)
[i] M – male, F – female, cm – centimetres, kg – kilograms, BMI – body mass index, LMS – Lambda-Mu-Sigma, SBP – systolic blood pressure, DBP – diastolic blood pressure, SDS – standard deviation score, eGFR – estimated glomerular filtration rate, Na – sodium, K – potassium, renin/cr. – renin-to-creatinine ratio, AGT – angiotensinogen, AGT/cr. – angiotensinogen-to-creatinine ratio, 24 h ABPM – 24-h ambulatory blood pressure measurement; values are presented as the median with the interquartile range (Q1–Q3).
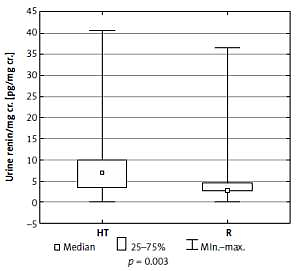
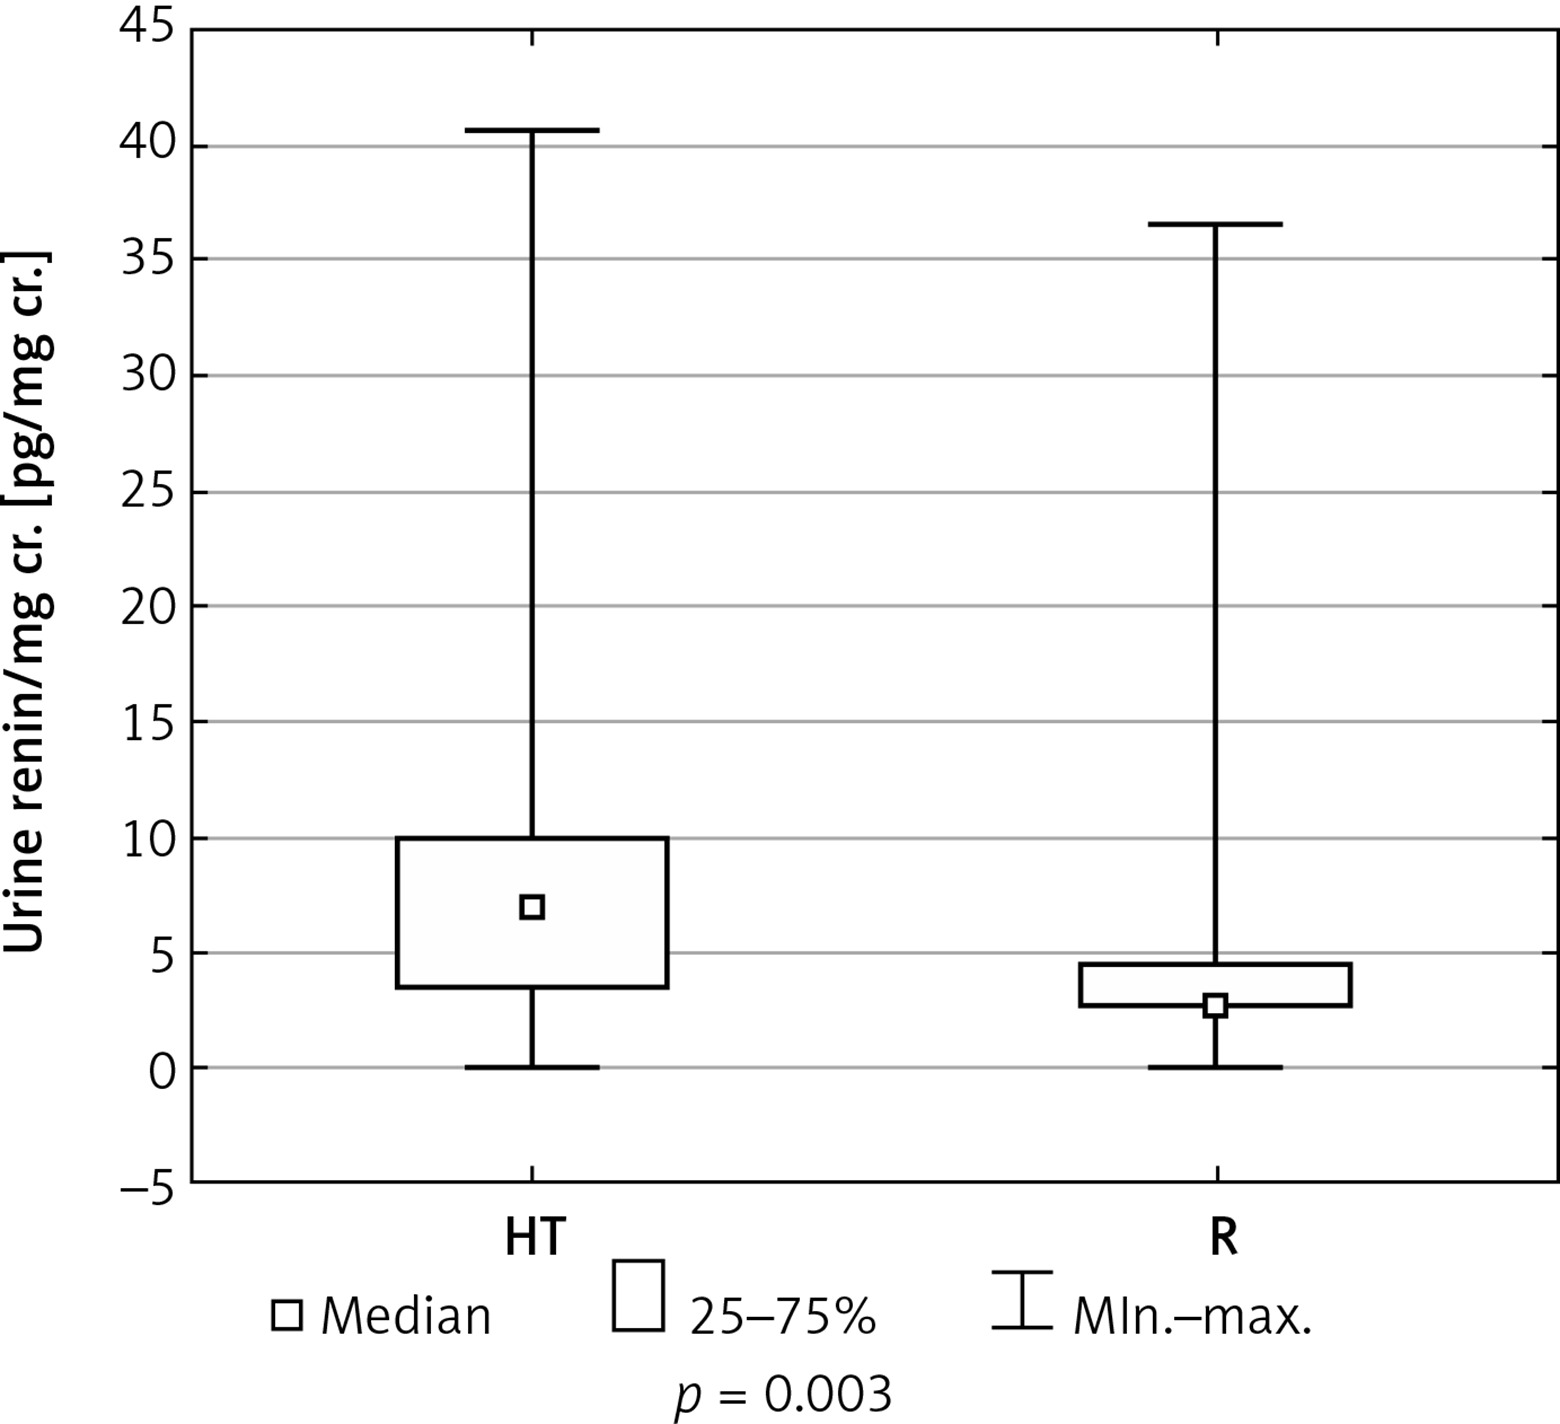
When compared to the reference group, hypertensive patients had higher urine REN/cr. (6.99 vs. 2.93 pg/mg, p = 0.003) (Figure 1) but in terms of urine AGT/cr. there was no difference between these two groups (p = 0.544). We found no differences in the urine excretion of REN and AGT between boys and girls (p > 0.05).
Then we analysed correlations between urine REN/cr., AGT/cr., and parameters of physical development, BP, biochemical parameters, and urine sodium and albumin excretion (Table II) in hypertensive children. Statistically significant positive correlations were found between urine REN/cr. and 24-h ABPM DBP SDS (24-h ABPM was performed only in the HT group) (r = 0.419, p = 0.002). We did not observe a significant correlation between urine REN/cr. and casual BP. What is more, in HT children we found a positive correlation between urine REN/cr. and urine AGT/cr. (r = 0.266, p = 0.044).
Table II
Correlations between urine renin/cr. and other physical parameters and biochemical markers in serum and urine in the HT group
In the reference group we did not find any significant correlations between examined parameters.
Discussion
In our study we found that hypertensive young patients had higher urine REN/cr. when compared to their healthy peers, and this correlated positively with diastolic 24-h ABPM measurements in hypertensive children. However, in hypertensive participants the correlation between urine REN/cr. and casual BP was not observed.
Interestingly, we found positive correlation between urine REN/cr. and AGT/cr. in the HT group.
In our study, neither in the HT group nor in the reference group, did we find any difference in urine REN/cr. or AGT/cr. values between girls and boys, which is consistent with an earlier report in adults [13]. In patients with HT we might expect activation of intrarenal RAS, which in some previous studies seemed to be even more closely related to HT than plasma REN activity (PRA). The increase in REN production in distal tubules seemed to be independent of high BP in 2-kidney 1-clip Goldblatt hypertensive rats [20]. Also, in contrast to the reduction of PRA in response to intravenous infusion of Ang II, the increase of REN in distal nephron was observed in Ang II-dependent hypertensive rats [21]. It looks similar in a transgenic mouse model [22]. Also, in hypertensive patients the activation of the intrarenal RAS was observed [23–26] but without the simultaneous increase in PRA. These observations indicate that the systemic and local RAS may be regulated in different ways and, what is more, local RAS activity may be even more closely related to HT.
The main question is: what reflects tissue RAS activity the best? Based on our observations we suggest that REN is this marker.
To the best of our knowledge, this study is the first that presents a significant positive association between urine REN and BP in hypertensive children and adolescents.
Angiotensin is too unstable to be measured in the urine. Most available literature findings focus on AGT as a good indicator of RAS activation [27, 28]. However, our study reveals that urine REN may be a more important marker of renal RAS activity. We did not find any important difference in urine AGT/cr. between normo- and hypertensive subjects, contrary to urine REN/cr., which was significantly higher in patients with HT. Nevertheless, some correlation between urine REN/cr. and urine AGT/cr. was observed. Urine REN/cr. correlated with diastolic 24-h ABPM measurements in hypertensive participants. 24-h ABPM is a gold standard of diagnosing HT. Elevation of systolic BP may result from many different factors like stress, physical activity, etc. Correlation between urine REN/cr. and diastolic 24-h ABPM might indicate its engagement in HT pathogenesis.
Although many reports suggest that AGT is an important compound of the renal RAS, REN seems to be a better indicator of this activity. This effect may be related to the fact that AGT urine excretion mimics urine albumin and total protein excretion, while REN is not similar to any other substances secreted in urine [13]. All the above findings are consistent with the observations of van den Heuvel et al., who also demonstrated that urine REN is the most important marker of renal RAS activity in diabetic patients [13].
It is known that Ang II stimulates sodium reabsorption in distal nephron activating the Ang II receptors, type 1 (AT1 receptors). We found a negative correlation between urine renin/cr. and urinary excretion of Na, which confirms this dependence. However, this correlation was on the border of statistical significance.
We should mention the limitations of this study. First of all, it was carried out on a relatively small sample of individuals and was limited to a single-centre patient population. Unfortunately, the examined groups were not sex-matched; however, in our opinion it did not influence the results because urine REN/cr. and urine AGT/cr. levels did not differ between males and females. In the HT group we observed higher incidence of obesity; however, SDS BMI did not differ significantly between the two groups, and the possible influence of body weight on the results of this study is probably minimal. We examined only patients with primary HT and did not compare those findings to patients with secondary HT. We also did not assess the influence of antihypertensive therapy (especially with angiotensin-converting-enzyme inhibitors) on the local RAS activity.
The pathogenesis of essential HT in the paediatric population is still not well known. There are broad studies in the field involving not only REN or AGT but also new endothelial proteins like multidrug-resistant protein-1 (MRP1), playing a crucial role in the hypertensive response to Ang II [29, 30].
In conclusion, these findings, although preliminary, suggest that intrarenal RAS may be one of the key players in the pathogenesis of HT in young patients. What is more, we conclude that urine REN better reflects intrarenal RAS activity than urine AGT. Nevertheless, further research on a much larger, sex-matched group of hypertensive subjects should be undertaken. Additionally, the influence of ACE inhibitors on urine REN and AGT would probably deliver some interesting information.