Introduction
Sleep is an important component of children’s physical and intellectual health. Poor sleep in children is a serious health problem that should no longer be ignored. Untreated sleep-disordered breathing (SDB) leads to significant morbidity, which may affect neurocognitive development in children [1]. Sleep-disordered breathing is a group of sleep disorders characterized by recurrent, partial, or complete cessation of breathing that disrupts normal sleep that includes snoring, apneas, hypopneas and respiratory effort-related arousal. The prevalence of SDB in children ranged between 1.2 and 13.9%. Diagnosis of SDB in children is difficult, requiring laboratory-based polysomnography, which is the gold standard for sleep assessment. Despite its advantages, polysomnography is expensive and gives information about sleep for a limited time [2].
Apnea is characterized by recurrent periods of cessation of breathing that could be central, obstructive or mixed according to the presence or absence of effort of breathing; while reduction in the amplitude of airflow is termed hypopnea [3]. Sleep-disordered breathing events are usually associated with sleep fragmentation, reduced oxygen saturation, and sympathetic nervous system activation [4]. The respiratory disturbance index (RDI) is a simple polysomnographic tool to assess SDB. RDI represent an indicator for respiratory event-related arousals that is calculated as the number of apneas, hypopneas, and respiratory effort related arousals per hour of sleep [5]. The underlying mechanism of obesity-related airflow disruption includes anatomic obstruction of the upper airway due to excess soft tissue bulk in the pharynx, changes in muscle tone and nerve activity during sleep [6].
Obesity-related comorbidities are linked to central obesity and are associated with higher fat deposition in the upper segment of the body than the lower segment [7, 8]. Body mass index (BMI) is the most commonly used anthropometric parameter for assessment of childhood obesity; however, it is not an accurate index of central obesity, which is the main risk factor for obesity-related comorbidities [9]. Other indices of central obesity such as waist circumference (WC) and hip circumference (HC) are time-consuming, technically difficult, vary by eating and respiration and are affected by abdominal distention. Neck circumference is a simple, time-saving easy anthropometric parameter that reflects both central and upper body adiposity [10]. Adjustment of waist and neck circumference to height in children has emerged to eliminate the effect of continuous growth on the anthropometric measurements [11].
Brain-derived neurotrophic factor (BDNF) is a widely expressed neurotrophin in the brain that is involved in cognitive function, energy homeostasis, mood, and sleep regulation. BDNF has a critical role in hypothalamic regulation of food intake [12]. There is emerging evidence that sleep deprivation, especially of rapid eye movement sleep, alters the secretion of BDNF [13].
However, the relation between SDB and BDNF levels and central obesity is not completely clarified. We conducted this study to clarify the association between BDNF level and anthropometric indices in relation to SDB in children with obesity.
Material and methods
Study population
This case control prospective study was conducted on 60 children; 30 of them had obesity and 30 were lean according to World Health Organization (WHO) [14]. They were selected from the pediatric and otorhinolaryngology outpatient clinic of Alzahraa University hospital, Al-Azhar University, Cairo, Egypt during the period from April 2015 to September 2016. Informed written consent was obtained from parents of all children involved in the study in accordance to the guidelines of the local ethics committee of Al-Azhar University.
Over a 1-year period we evaluated 90 children with obesity but only 30 of them fulfilled our inclusion and exclusion criteria and agreed to undergo polysomnographic assessment. Inclusion criteria were BMI > 95th percentile for obese children and BMI 5th–85th percentile for healthy controls. Both genders were included. Their age range was 6–14 years. According to their polysomnographic findings, they were categorized into children with or without SDB.
The SDB group included children with partial, or complete cessation of breathing that disrupts normal sleep due to any of the following: snoring, apneas (either central or peripheral), hypopneas and respiratory effort-related arousal. All the previous sleep disorders were confirmed by polysomnography (PSG).
Children suffering from any acute, chronic medical disorder (e.g. metabolic, endocrine, cardiorespiratory, liver, renal diseases), genetic, neuromuscular disorder, skeletal malformation, adenotonsillar hypertrophy, or those who received medication that may affect their sleep habits were excluded from the study.
Control children were selected consecutively from age- and sex-matched healthy lean siblings of children with obesity. Their BMI values were 5th–85th percentile; they fulfilled the same exclusion criteria as children with obesity.
Medical history and examination
All children were subjected to full history taking including age, sex, medical, dietetic history, life style and sleep history and complete general and systemic examination including neurological, respiratory, cardiac, and ENT consultation.
Anthropometric measurements
Anthropometric measures were carefully measured including body weight (kilograms) while the child was in light clothes, height (centimeter) while the child had bare feet with straight knee, hip, waist and neck circumference (centimeters) using a flexible non-stretchable measuring tape. All parameters were recorded to the nearest 0.1 value. Body mass index was calculated as weight in kilograms divided by squared height in meters and was plotted by age and sex on the sex-specific growth chart. BMI was plotted on Egyptian growth charts [15]. Obesity was diagnosed if BMI is ≥ 95th percentile for age and sex. BMI ≥ 5th but < 85th percentile is considered normal [14]. Waist circumference (WC) was measured using a measuring tape over the unclothed abdomen, with measurements made halfway between the lower border of the ribs and the highest point of iliac crest in the standing position at the end of expiration [16]. Hip circumference (HC) was measured using a measuring tape at the maximum extension of the buttocks with the child standing erect [17]. Neck circumference (NC) was measured in horizontal plane at a point just below the thyroid cartilage and perpendicular to the long axis of the neck while the child looking straight ahead with shoulders down [18]. Neck circumference/height (NC/Ht) ratio and waist circumference to height (WC/Ht) ratio were calculated. All clinical observations have been performed once in each patient/control.
Polysomnography
Overnight (at least 8 h) PSG for one night was carried out once among all included children using polysomnography (PSG) apparatus (model BWIII; Product of Neurovirtual USA) at the sleep laboratory of the pediatric neurophysiology unit at Alzahraa hospital, Al-Azhar University.
Assessment of serum BDNF level
Samples were collected on awaking while the patient was fasting after overnight PSG to avoid the effect of exercise and diet on BDNF. Two ml of venous blood was drawn and collected in serum separator tubes and centrifuged for serum separation. Serum was stored at -20°C until the time for assessment. Steps of the assay were done according to the recommendations of the manufacturers. BDNF was measured in serum rather than plasma as serum measurements showed lower variability than EDTA-plasma measurements and was stable after 2 h storage at room temperature and after 6 months storage [19]. Determination of serum BDNF was performed using enzyme immunoassay for the in vitro quantitative measurement of human from Kamiya biomedical company (Cat. No. KT-8570).The normal range of serum BDNF is 1.5-30.9 ng/ml in healthy subjects [20].
The kit contains a pre-coated microtiter plate with anti-BDNF antibody. Before the assay, the standard was diluted 5 times by pipetting 50 μl of standard dilution in each tube. Samples were also diluted 5 times by pipetting a sample dilution of 40 μl to the testing sample well, then adding a testing sample of 10 μl (sample final dilution is 5-fold) then incubating for 30 min at 37°C. Wash solution was diluted 30-fold with distilled water. All samples were washed 5 times with washing solution then we added 50 μl of HRP enzyme to each well except the blank, then incubated again for 30 min at 37°C. All samples were washed again 5 times with washing solution. Chromogen solution (100 μl) was added to each well then the reaction was stopped by adding stop solution (50 μl) so the blue color changed to yellow. The blank well was considered as zero and the absorbance was read at 450 nm at 15 min from adding the stop solution. The enzyme-substrate reaction was terminated by the addition of a sulfuric acid solution and the color change was measured spectrophotometrically at a wavelength of 450 nm ±2 nm. The concentration of BDNF in the samples was then determined by comparing the O.D. of the samples to the calibration curve. Each patient’s blood test was measured once in a single well.
Statistical analysis
Statistical analysis was performed using SPSS (version 19.0; SPSS Inc., Chicago, IL, USA). Differences between groups were analyzed with the one-way ANOVA test. Further analysis between groups was done by post hoc multiple analysis Tukey test. Correlations between variables were performed using the Pearson correlation test for determination of the correlation coefficient (r). Binary logistic regression analysis was done to determine the predictors of SDB in obese children. Receiver operating characteristic curves (ROC) were used to identify sensitivity and specificity and determine optimal cut-off points of anthropometric indices of central obesity for prediction of SDB in obese children. Sensitivity = true positive/(true positive + false negative). Specificity = true negative / (true negative + false positive). P-value < 0.05 was considered to be significant.
Results
This study included 30 children with obesity (10 males and 20 females); 16 of them (53.3%) had SDB (12 had obstructive apnea, 4 had central apnea, 4 had mixed apnea, 14 had hypopnea, 9 had snoring, 10 had respiratory effort-related arousal). Most of them had more than one pattern of SDB. In addition, 30 healthy children served as a control group (14 male, 16 female).
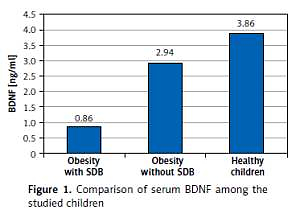
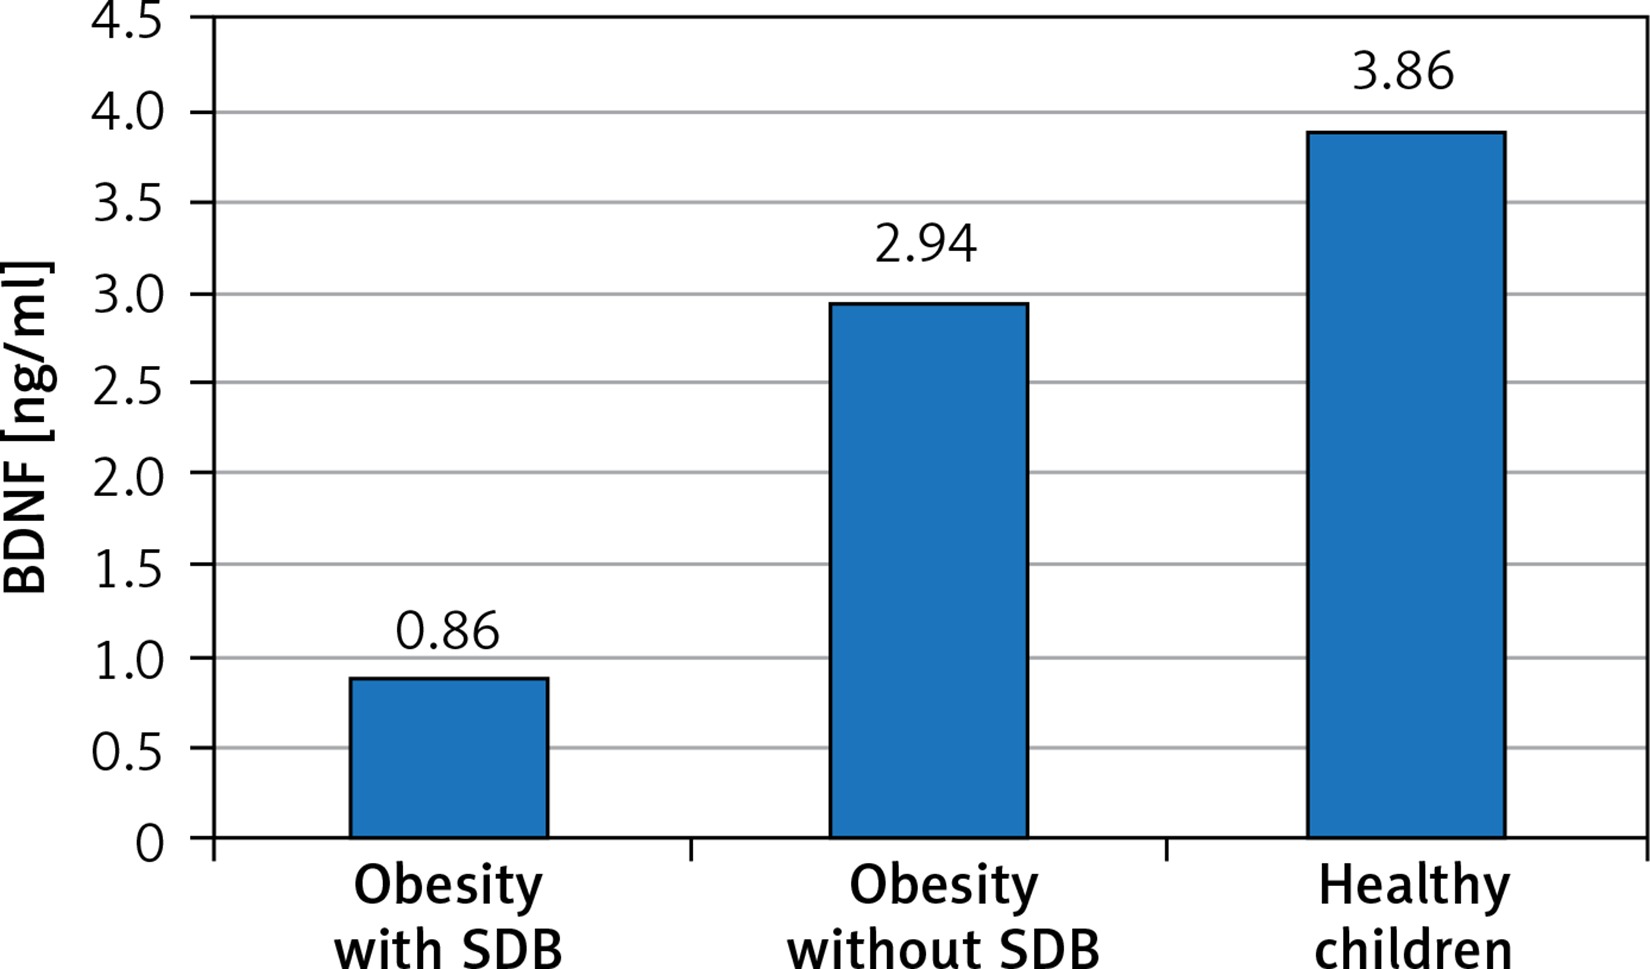
We evaluated serum level of BDNF and anthropometric parameters as independent variables in relation to SDB detected by PSG as a dependent variable in the studied children. Table I and Figure 1 show the comparison of anthropometric parameters, polysomnographic findings, and BDNF serum level of the included children. No substantial age and gender differences were found among children involved in the study. BDNF was significantly lower in obese children especially those with SDB. Further analysis between subgroups revealed that obese children with SDB had statistically significantly higher indices of central obesity (WC, NC, WC/Ht ratio, NC/Ht ratio) and a statistically significantly lower BDNF serum level than those without SDB and healthy controls. WC that represents an index of peripheral obesity did not show a significant difference between those with and without SDB. As regard polysomnographic findings, obese children had statistically significantly more disturbed sleep and lower sleep efficiency especially those with SDB than healthy controls.
Table I
Comparison of anthropometric and polysomnographic data and serum level of brain derived neurotrophic factor among the studied children
| Variables | Obesity with SDB (n = 16) | Obesity without SDB (n = 14) | Healthy children (n = 30) | ANOVA test/ χ2 test | |||
|---|---|---|---|---|---|---|---|
| f/χ2 | P-value | ||||||
| Age [years] | 10.062 ±2.909 | 10.571 ±2.623 | 10.283 ±2.926 | 0.119 | 0.888 | ||
| Gender Male/female, n (%) | 5 (31.2)/11 (68.8) | 5 (35.7)/9 (64.3) | 14 (46.6)/16 (53.4) | 1.173 | 0.556 | ||
| Weight [kg] | 60.26 ±16.08 | 55.89 ±10.95 | 34.97 ±10.43 | 27.033 | < 0.0001* | ||
| Height [cm] | 137.25 ±13.14 | 138.71 ±13.07 | 137.37 ±13.82 | 0.056 | 0.945 | ||
| BMI [kg/m2] | 31.97 ±2.57 | 28.76 ±2.56 | 18.98 ±2.71 | 145.006 | < 0.0001* | ||
| WC [cm] | 94.19 ±4.79 | 86.79 ±5.91 | 65.84 ±12.30 | 51.811 | < 0.0001* | ||
| WC/Ht ratio | 0.65 ±0.14 | 0.61 ±0.09 | 0.48 ±0.06 | 31.227 | < 0.0001* | ||
| HC [cm] | 98.99 ±10.71 | 105.78 ±13.46 | 76.42 ±14.51 | 28.186 | < 0.0001* | ||
| NC [cm] | 35.68 ±1.37 | 33.74 ±1.41 | 29.33 ±3.07 | 39.814 | < 0.0001* | ||
| NC/Ht ratio | 0.26 ±0.02 | 0.24 ±0.02 | 0.21 ±0.02 | 32.126 | < 0.0001* | ||
| O2 minimum | 86.50 ±2.61 | 95.00 ±1.62 | 94.37 ±2.07 | 82.565 | < 0.0001* | ||
| SE % | 86.16 ±4.10 | 90.80 ±2.90 | 93.89 ±2.23 | 34.923 | < 0.0001* | ||
| NREM1% | 9.66 ±2.49 | 7.22 ±2.44 | 4.88 ±0.83 | 36.262 | < 0.0001* | ||
| NREM2% | 50.11 ±1.82 | 47.85 ±2.65 | 49.53 ±2.76 | 3.198 | 0.048* | ||
| NREM3% | 19.06 ±2.05 | 22.65 ±2.19 | 22.51 ±2.01 | 16.602 | < 0.0001* | ||
| REM% | 20.15 ±1.76 | 22.71 ±2.61 | 23.13 ±2.07 | 10.534 | < 0.0001* | ||
| AI | 10.92 ±3.61 | 6.52 ±2.10 | 2.79 ±2.66 | 42.763 | < 0.0001* | ||
| Sleep latency [min] | 10.06 ±3.68 | 8.64 ±3.34 | 11.70 ±2.98 | 4.911 | 0.011* | ||
| REM latency [min] | 109.19 ±8.36 | 106.43 ±6.62 | 100.63 ±10.50 | 4.378 | 0.017* | ||
| BDNF [ng/ml] | 0.86 ±0.47 | 2.94 ±0.67 | 3.86 ±1.25 | 48.054 | < 0.0001* | ||
| Post hoc: multiple analysis | |||||||
| Variables | Obesity with SDB vs. obesity without SDB | Obesity with SDB vs. healthy children | Obesity without SDB vs. healthy children | ||||
| Weight [kg] | 0.261 | < 0.0001* | < 0.0001* | ||||
| BMI [kg/m2] | 0.001* | < 0.0001* | < 0.0001* | ||||
| WC [cm] | 0.023* | < 0.0001* | < 0.0001* | ||||
| WC/Ht ratio | 0.008* | < 0.0001* | < 0.0001* | ||||
| HC [cm] | 0.224 | < 0.0001* | < 0.0001* | ||||
| NC [cm] | 0.026* | < 0.0001* | < 0.0001* | ||||
| NC/Ht ratio | 0.002* | < 0.0001* | < 0.0001* | ||||
| O2minimum | < 0.0001* | < 0.0001* | 0.368 | ||||
| SE % | < 0.0001* | < 0.0001* | 0.001* | ||||
| NREM1% | 0.014* | 0.531 | 0.029* | ||||
| NREM2% | < 0.0001* | < 0.0001* | 0.694 | ||||
| NREM3% | 0.001* | < 0.0001* | 0.761 | ||||
| REM% | 0.509 | 0.022* | 0.122 | ||||
| AI | 0.264 | 0.002* | 0.005* | ||||
| RDI: | |||||||
| Sleep latency [min] | < 0.0001* | < 0.0001* | 0.001* | ||||
| REM latency [min] | < 0.0001* | < 0.0001* | < 0.0001* | ||||
| BDNF [ng/ml] | < 0.0001* | < 0.0001* | 0.018* | ||||
BMI - body mass index, WC - waist circumference, WC/Ht - waist circumference/height, HC - hip circumference, NC - neck circumference, NC/Ht - neck circumference/height, SE - sleep efficiency, AI - arousal index, RDI - respiratory disturbance index, NREM - non-rapid eye movement, REM - rapid eye movement, BDNF - brain-derived neurotrophic factor.
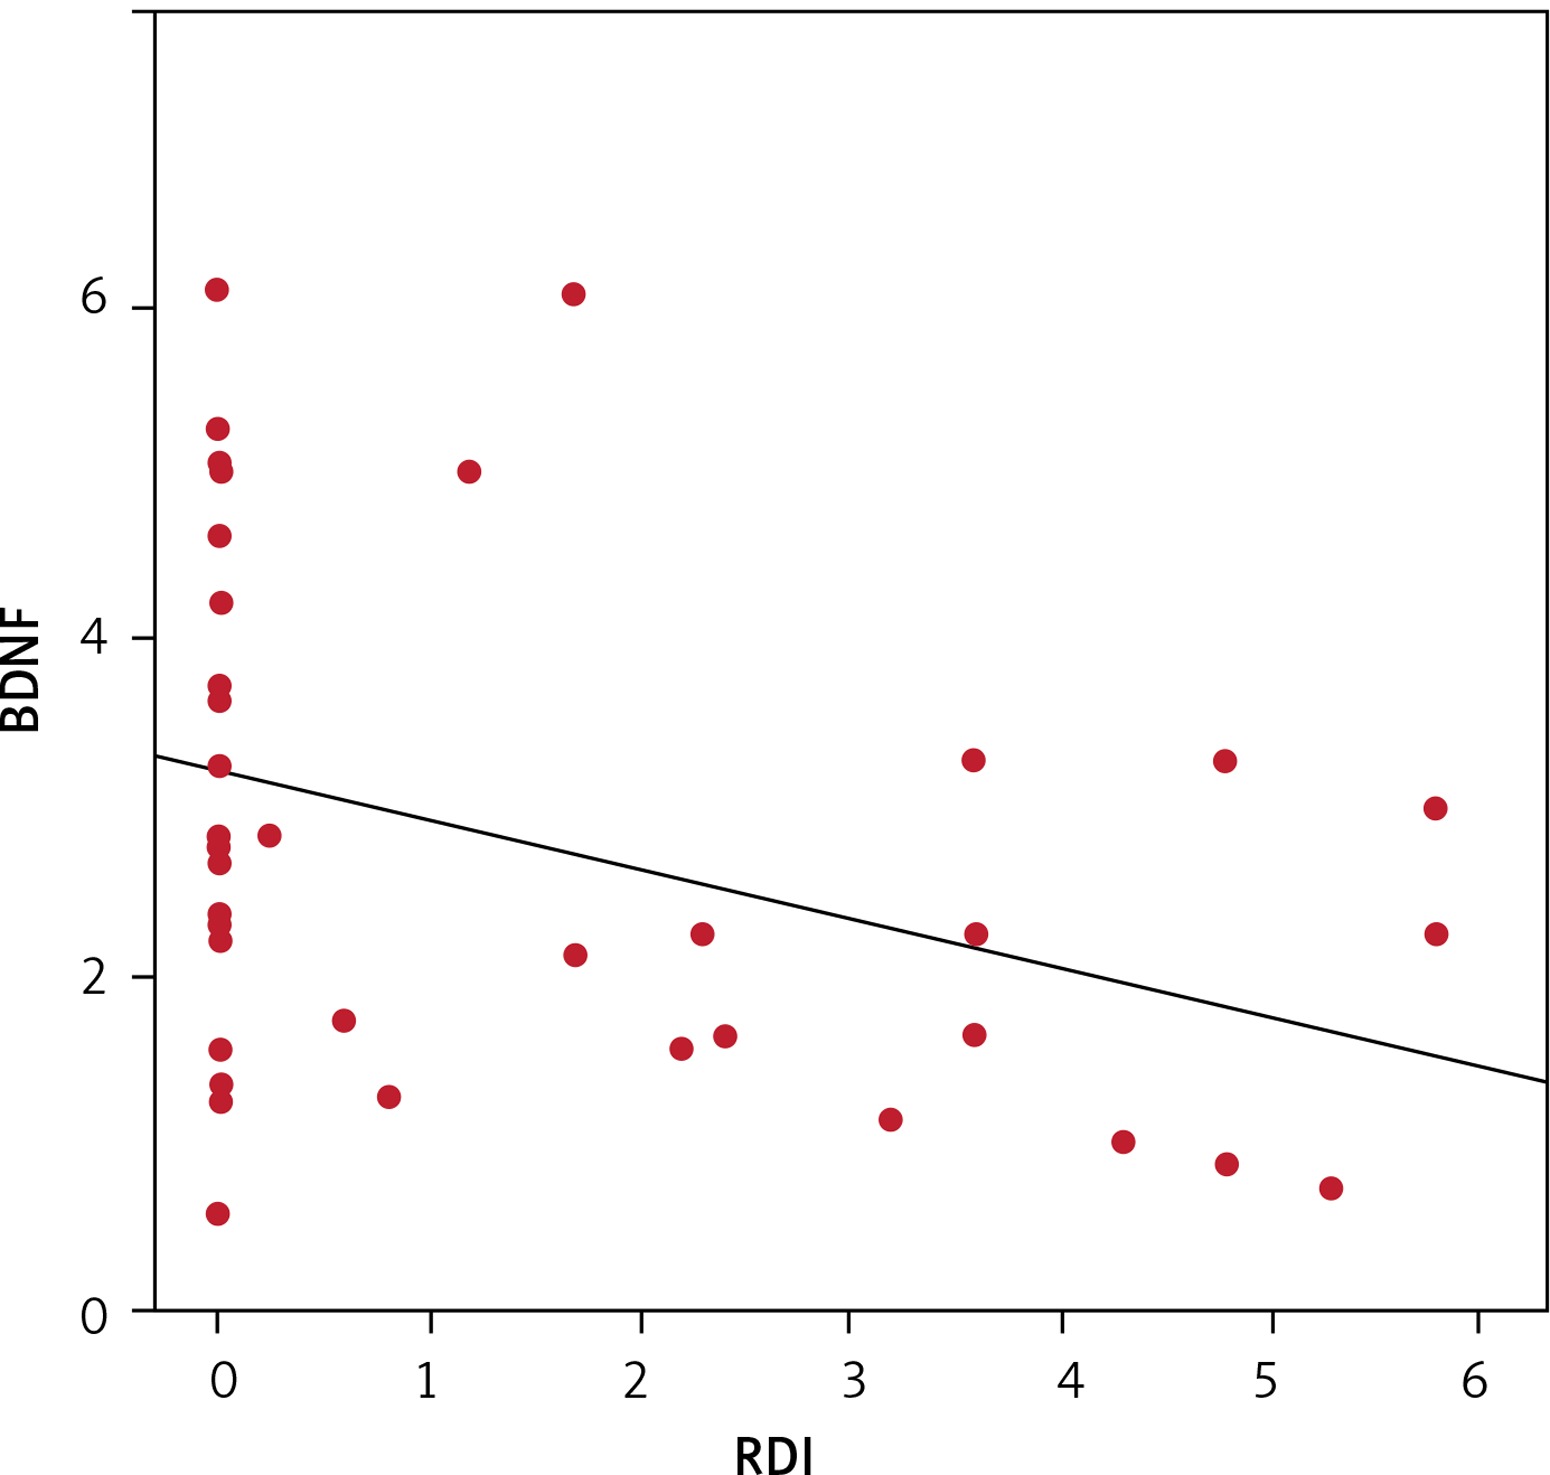
Pearson’s correlation test was used to assess the correlations between RDI as an indicator of SDB and anthropometric parameters. Table II and Figure 2 show a significant negative correlation between RDI and BDNF serum level and a significant positive correlation between RDI and anthropometric indices of obesity (BMI, WC, WC/Ht ratio, HC, NC, NC/Ht ratio).
Table II
Correlation between anthropometric parameters, serum level of brain-derived neurotrophic factor and polysomnographic data in children with obesity
| Variables | RDI | |
|---|---|---|
| r | P-value | |
| Weight [kg] | 0.085 | 0.654 |
| BMI [kg/m2] | 0.613 | < 0.0001* |
| WC [cm] | 0.513 | 0.004* |
| WC/Ht ratio | 0.638 | < 0.0001* |
| HC [cm] | 0.421 | 0.020* |
| NC [cm] | 0.509 | 0.004* |
| NC/Ht ratio | 0.638 | < 0.0001* |
| BDNF [ng/ml] | –0.765 | < 0.0001* |
Logistic regression analysis showed that anthropometric indices of central obesity and low BDNF were risk factors for SDB in obese children as shown in Table III.
Table III
Logistic regression analysis of predictors of sleep disordered breathing in children with obesity
| Variables | OR | 95% CI for OR | P-value | |
|---|---|---|---|---|
| Lower | Upper | |||
| Weight [kg] | 1.003 | 0.991 | 1.015 | 0.579 |
| BMI [kg/m2] | 2.008 | 0.984 | 2.932 | 0.038* |
| WC [cm] | 2.002 | 0.994 | 3.010 | 0.041* |
| WC/Ht ratio | 3.381 | 1.136 | 6.694 | 0.012* |
| HC [cm] | 1.001 | 0.994 | 1.008 | 0.855 |
| NC [cm] | 1.005 | 0.985 | 1.026 | 0.106 |
| NC/Ht ratio | 2.358 | 1.002 | 5.842 | 0.035* |
| BDNF [ng/ml] | 3.115 | 0.838 | 5.944 | 0.017* |
A ROC curve was plotted according to the patient data. Waist circumference/height ratio and neck circumference/height ratio have 89.5%, 75% sensitivity and 81.23%, 84.62% specificity at a cutoff point > 0.62, > 0.24 respectively for prediction of SDB in obese children as shown in Table IV.
Table IV
Sensitivity, specificity, and predictive values for diagnosis of sleep disordered breathing using anthropometric indices of central obesity
Discussion
Obesity is a major risk factor for SDB that adversely affects the sleep efficiency and duration and further increases the risk for more weight gain [21]. BDNF is an important neurotransmitter that regulates both sleep and appetite [22], but its role as a link between obesity and SDB was not well explored in children.
Among our studied children, SDB was detected in 53.3% of children with obesity. This agrees with previous reports that obesity is a major risk factor for sleep apnea in both children [23] and adults [24]. Verhulst et al. [25] reported that 47% of children with obesity had SDB. There is 12% increased risk of obstructive sleep apnea for every one unit increase in BMI [26] and a 6-fold increase in the risk of SDB for every 10% increase in body weight [27].
Polysomnography is the gold standard for diagnosis of SDB in children. However, simple screening tools are needed for high risk populations. Our study demonstrated significant association between SDB, BMI and other anthropometric indices of central obesity including WC/Ht and NC/Ht ratio. WC/Ht ratio has the highest sensitivity (89.5%) while NC/Ht ratio has the highest specificity (84.6%) for prediction of SDB in obese children. The significant correlation between increased WC, NC, BMI and SDB was reported even in general populations [28]. Previous evidence revealed significant association between SDB and central obesity [29]. However there were controversial reports regarding the best anthropometric parameter to predict SDB in obese subjects [30-32].
To overcome the variation in anthropometry in relation to ages of included children we use WC/Ht and NC/Ht ratio as indicators of central obesity. Our study revealed that obese children with SDB have higher WC/Ht and NC/Ht ratio than those without SDB or healthy controls. Additionally, regression analysis of risk factors for SDB in our studied children revealed that WC/Ht and NC/Ht ratio were strong predictors for SDB. Similar findings were reported by Ho et al. [33], who concluded that a cutoff point > 0.25 NC/Ht ratio is a valuable screening tool for obstructive sleep apnea in both children and adults.
Regarding the impact of obesity on polysomnographic findings, our study revealed that obese children with SDB have more disturbed sleep architecture, poor sleep efficiency and lower oxygen saturation than those without SDB and healthy controls. Jarrin et al. [34] reported poorer sleep quality and more sleep disturbances in obese children. Chamorro et al. [35] found that sleep efficiency was inversely associated with BMI. Peppard et al. [36] found that obesity exaggerates the oxygen desaturation during SDB with a 1% increase in oxygen desaturation for each 10 kg/m2 increase of BMI.
Sleep disorders may be related to a combination of biological, psychological, and anatomical factors. Several mechanisms are suggested to explain the associations between obesity and SDB, including low upper airway muscle tone, and airway collapsibility due to increased parapharyngeal tissue fat content leading to activation of different exaggerated forms of trigemino-cardiac reflex. Trigeminal stimulation during sleep leads to arousals in a dose- and time-dependent manner [37]. Other mechanisms include altered chest-wall mechanics, reduced lung volume causing lower oxygen reserves, as well as impairment of ventilatory control induced by leptin and cytokines. Reduction in oxygen saturation due to frequent SDB leads to cortical and brainstem arousals and disturbed sleep. There is evidence that weight loss can reduce SDB in obese patients [38].
Children with obesity are more vulnerable to sleep fragmentation and arousal induced by respiratory events leading to short sleep durations and chronic sleep deprivation [39, 40]. Some evidence showed a strong association between poor sleep and obesogenic eating behavior; however, the underlying mechanism is not well understood [41].
Our results demonstrated a significant decrease of peripheral BDNF in obese children either with or without SDB. BDNF plays an important role in regulation of sleep and appetite. Short sleep deprivations increase cortical expression of BDNF but chronic prolonged sleep deprivations decrease it [42]. A decreased level of BDNF places more burden on children with obesity. A previous report suggested that serum BDNF was inversely related to appetite [43].
In our study, children with obesity had a significant higher arousal index than healthy children reflecting interrupted sleep and poor sleep quality, which could explain the lower serum level of BDNF in children with obesity, particularly those with SDB. These findings are in accordance with accumulated evidence linking sleep deprivation to decreased BDNF [44]. Wang et al. [45] reported a significantly reduced BDNF serum level in patients with obstructive sleep apnea which was related to nocturnal hypoxia as well and deprivation of slow wave sleep and REM sleep in such patients.
One of the major limitations of our study is the small number of included children. The diagnosis of central obesity was done on the basis of anthropometry instead of dual-energy X-ray absorptiometry, which is the gold standard for assessment of visceral obesity. Previous evidence demonstrated the validity of simple anthropometric parameters for assessment of central obesity [46].
Additionally, the central level of BDNF could not be measured; however, a previous report [47] demonstrated that BDNF can readily cross the blood-brain barrier, suggesting that the peripheral level of BDNF could reflect its brain expression.
In conclusion, children with obesity have a decreased BDNF serum level. Central obesity and decreased BDNF represent independent predictors for SDB in children with obesity. Anthropometric indices of central obesity adjusted to height can be used as a simple screening tool for SDB in children. Further studies are required to illustrate the effect of weight reduction on BDNF serum level and to assess the potential therapeutic benefit of BDNF on SDB among children with obesity.