Introduction
The prevalence of obesity has tripled in the past 30 years [1], and it is estimated that the side effects of obesity will affect more than 1 billion people by 2030 [2]. The negative impact of obesity is very large. It increases the risk not only of cardiovascular diseases, metabolic diseases and some cancers [3], but also comorbidities with diseases such as type 2 diabetes, dyslipidemia and hypertension [4–6]. Obesity has become a major public health hazard and risk [7].
Articles and data on obesity management show that different exercise interventions play a role in obesity but show different characteristics [8]. The intensity of aerobic exercise will have different effects on weight loss [9, 10], and the load intensity of resistance training will also have different effects on weight loss [11]. Of concern, good effects have also been reported in studies of the effects of whole body vibration training [12] and hypoxia training on weight loss in young adults. Current health guidelines suggest that weight-loss programs for obese people should prioritize moderate-intensity aerobic exercise [13], but the issue remains controversial in academia and in the practice of weight loss.
In this context, it is difficult to determine the superiority of different types of exercise interventions using only single randomized controlled trials or paired meta-analyses, as these studies often aim to compare one or two types of exercise interventions with those of a control group, and therefore cannot distinguish between the effects of different exercise interventions for the treatment of obesity in young people, which makes it difficult to draw firm conclusions [14].
Network meta-analysis (NMA), also known as mixed treatment comparison or multi-treatment comparison meta-analysis, expands the scope of traditional pairwise analyses by simultaneously analyzing direct and indirect evidence from different studies, allowing the evaluation of relative effectiveness and sequencing of interventions across all interventions [15].
So far, there has been no systematic review of the effects of different exercise methods on weight loss among young obese people. There are only some meta-analyses or network meta-analyses to study and provide the most appropriate exercise prescription for adolescents and children [16], middle-aged and elderly people [17] or adults in the broad sense (only > 18 years old) [18]. For the time being, no studies have focused on obesity and its management. In the case of young people, the general consensus is that they are between the ages of 18 and 50 and have a number of characteristics not shared by other groups: (1) physical and mental development is complete, and different exercise intervention methods have little impact on their potential threats (e.g. resistance training is teenage children use is not recommended, because it might affect their bones [19]); (2) the majority of the working day is spent at work or studying, leaving little opportunity for longer exercise [20], or (3) an unhealthy lifestyle, such as staying up late, drinking and frequent social activities [21]. These characteristics, to some extent, lead to primary obesity in this group of people. It is not targeted and scientific to only evaluate the effect of different exercise interventions on obese adults in a broad sense (young adults and middle-aged and elderly people).
Therefore, the purpose of this study is to: (1) evaluate the effects of different exercise interventions on weight loss in young obese people, and (2) establish the ranking of the effects of these exercise interventions.
Material and methods
Search strategy
Five electronic databases (PubMed, EMBASE, Cochrane Central Register of Controlled Trials, Web of Science, and CNKI) was searched from inception to April 2022. The search strategy is built around the PICOS tool: (P) Population: young people with obesity; (I) Intervention: movement; (C) Comparator: other exercise intervention or control group without intervention; (O) Outcomes: body composition and cardiopulmonary fitness and (S) Study type: RCTs. The detailed search strategy is shown in the following Table I (taking PubMed as an example).
Table I
Search strategy on PubMed
Inclusion criteria
(1) a study on the treatment of obesity with different exercise styles as an intervention in the experimental group; (2) a control group with or without exercise styles as an intervention; (3) a randomized controlled clinical trial.
Exclusion criteria
(1) age > 45 or < 18; (2) non-obese individuals; (3) who took relevant weight-loss medications one month before and during the intervention; (4) significant baseline differences between each independent study.
Outcomes
The main outcome indicators were: Body composition: weight (kg), body mass index (BMI), body fat percentage (fat %), and waist circumference (WC) [22]. The secondary outcome measure was cardiopulmonary function: maximal oxygen uptake (VO2max) [23].
Study selection
Zotero, the literature management software, was used to screen and eliminate the literature. First, two researchers screened the titles of the literature to eliminate duplicate literature, non-randomized controlled trial studies, review papers, conference papers, experimental protocols and correspondence. Later, the two researchers read the abstract of the literature to further determine the inclusion of the literature, excluding from the object non-young and middle-aged population and non-primary obesity literature. Finally, two researchers read the full text of the remaining literature and further determined the literature to be included. In this process, both researchers conducted independent screening, and finally compared the remaining literature. If they were the same, they were finally included; if they were different, the third researcher discussed the difference and resolved it.
Data extraction
A nine-item, standardized and pre-selected data extraction table was used to record the data included in the study under the following headings: (1) author, (2) year of publication, (3) country, (4) study period, (5) sample size, (6) mean age, (7) mean baseline, (8) follow-up weight, BMI, FAT%, WC and VO2max, and (9) detailed information on exercise interventions.
Risk of bias of individual studies
Two authors independently assessed the risk of bias (ROB), in accordance with the Cochrane Handbook version 5.1.0 tool for assessing ROB in RCTs [24–26]. The following seven domains were considered: (1) randomized sequence generation, (2) treatment allocation concealment, blinding of (3) participants and (4) personnel, (5) incomplete outcome data, (6) selective reporting and (7) other sources of bias. Trials were categorized into three levels of ROB by the number of components for which high ROB potentially existed: high risk (five or more), moderate risk (three or four) and low risk (two or less). All studies would, by default, be classified as high ROB with respect to the category ‘blinding of participants’ given that it was impossible to blind participants to group assignment in exercise intervention protocols.
Exercise categories
Exercise interventions included in randomized controlled trials were classified using nine categories [27]:
(1) Aerobic exercise; vigorous intensity (AE-V),
(2) Aerobic exercise; moderate intensity (AE-M),
(3) Resistance training; high load (R-HI),
(4) Resistance training; low-to-moderate load (R-LM),
(5) Combined high; vigorous intensity aerobic/high-load resistance (COM-HI),
(6) Combined low-moderate; moderate intensity aerobic/low-to-moderate load resistance (COM-LM),
(7) Restricting oxygen in AE-M (AE-M-R),
(8) Whole body vibration training (WBV),
(9) No exercise (control group).
The nine categories were based on the frequency, intensity, duration, and type of exercise prescription and ACSM estimates of cardiopulmonary endurance and exercise intensity. The detailed explanation is shown in Table II.
Table II
Detailed classification of different exercise interventions
Data analysis
Since the units of outcome indicators to be extracted were consistent, MD + SD was used to calculate the five outcome indicators. MD + SD at the end of intervention minus MD + SD at baseline was used to calculate the five outcome indicators [28]. The extracted intervention was immediately after the end of exercise intervention to avoid any potential impact of the cleaning period on the results. For weight, BMI, WC and FAT %, the better the intervention effect was, the smaller was the value at the end of the intervention [22], while for VO2max, the higher the value at the end of the intervention was compared to the baseline, the better was the intervention [23]. When baseline was not available, at the end of the intervention, or the difference between the two, the calculation was performed using the formula given in the Cochrane guidelines [26].
We used Stata software (version 15.1) and performed summary analysis in a Bayesian framework according to the PRISMA NMA guidelines.
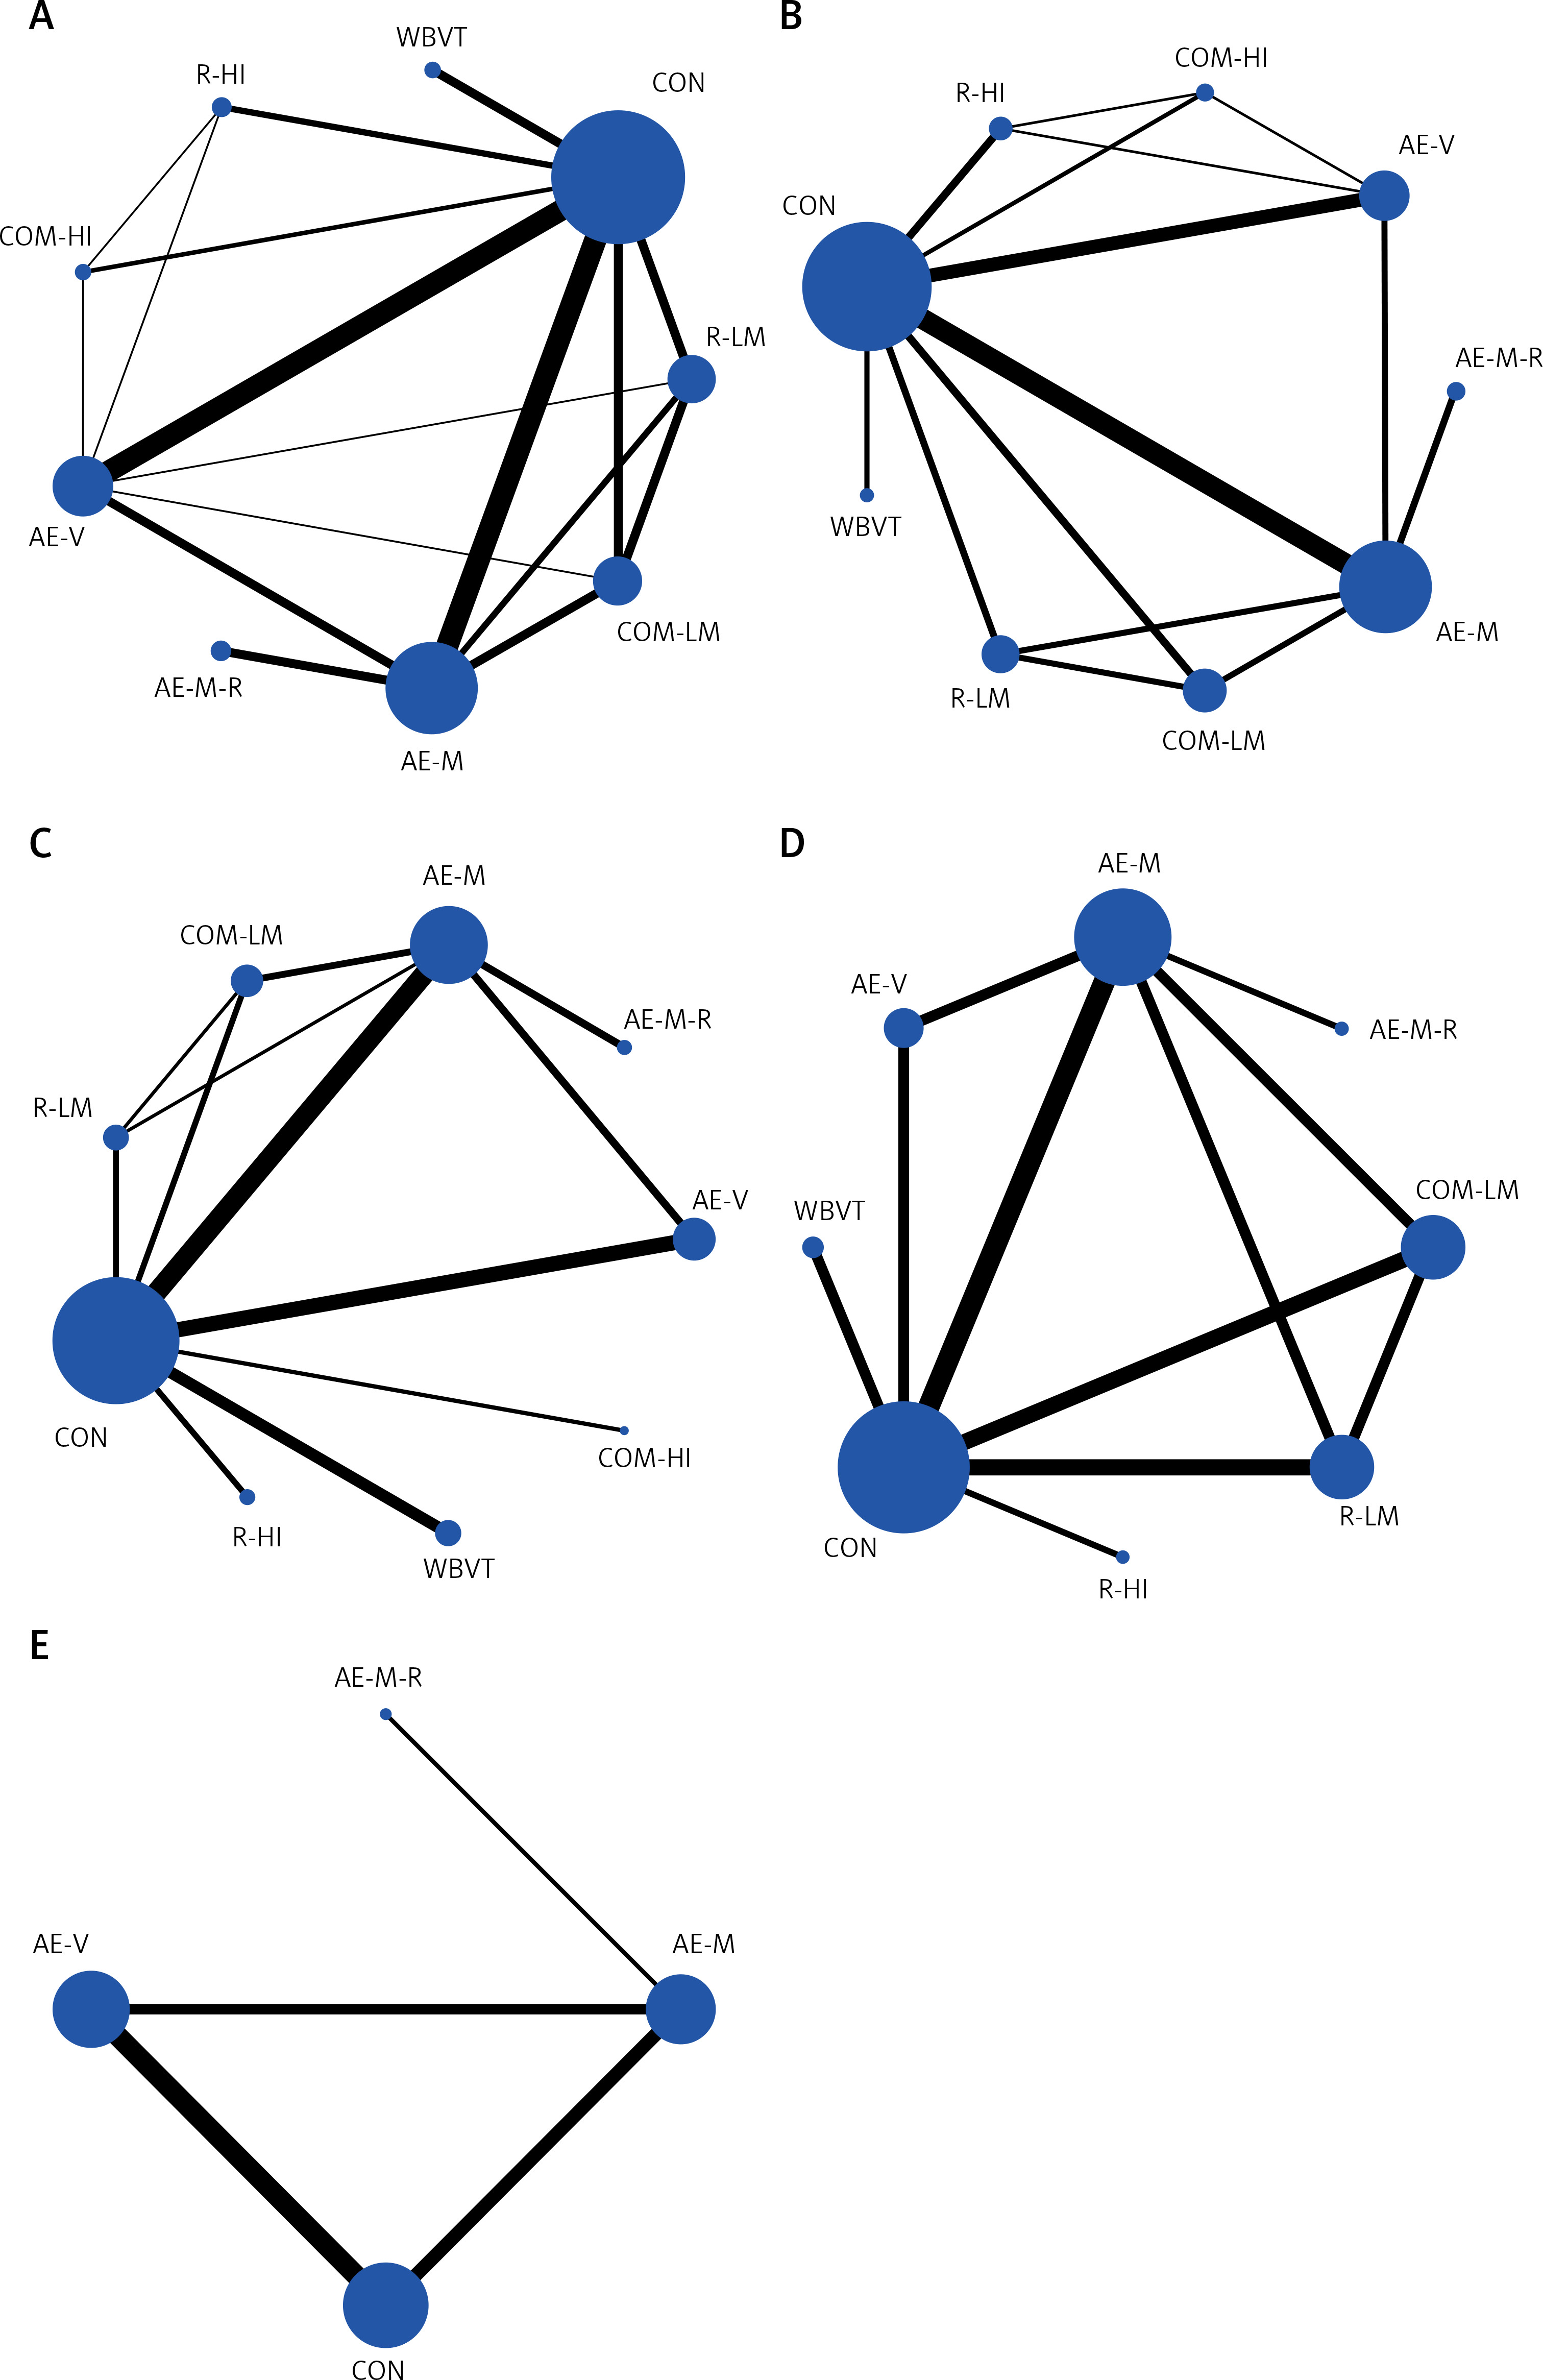
Stata software is used to present and describe network diagrams of different exercise interventions. In the generated network diagram, each node represents different motion interventions and different control conditions, and the lines connecting nodes represent direct head-to-head comparisons between interventions. The size of each node and the width of the lines are proportional to the number of studies [29, 30].
The heterogeneity and consistency test between each independent study will be calculated by the instructions in Stata software. If p > 0.05, the heterogeneity of each NMA is considered low and the consistency test is passed [31].
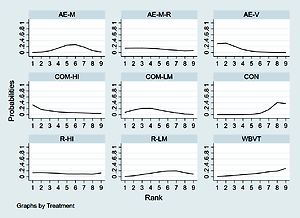
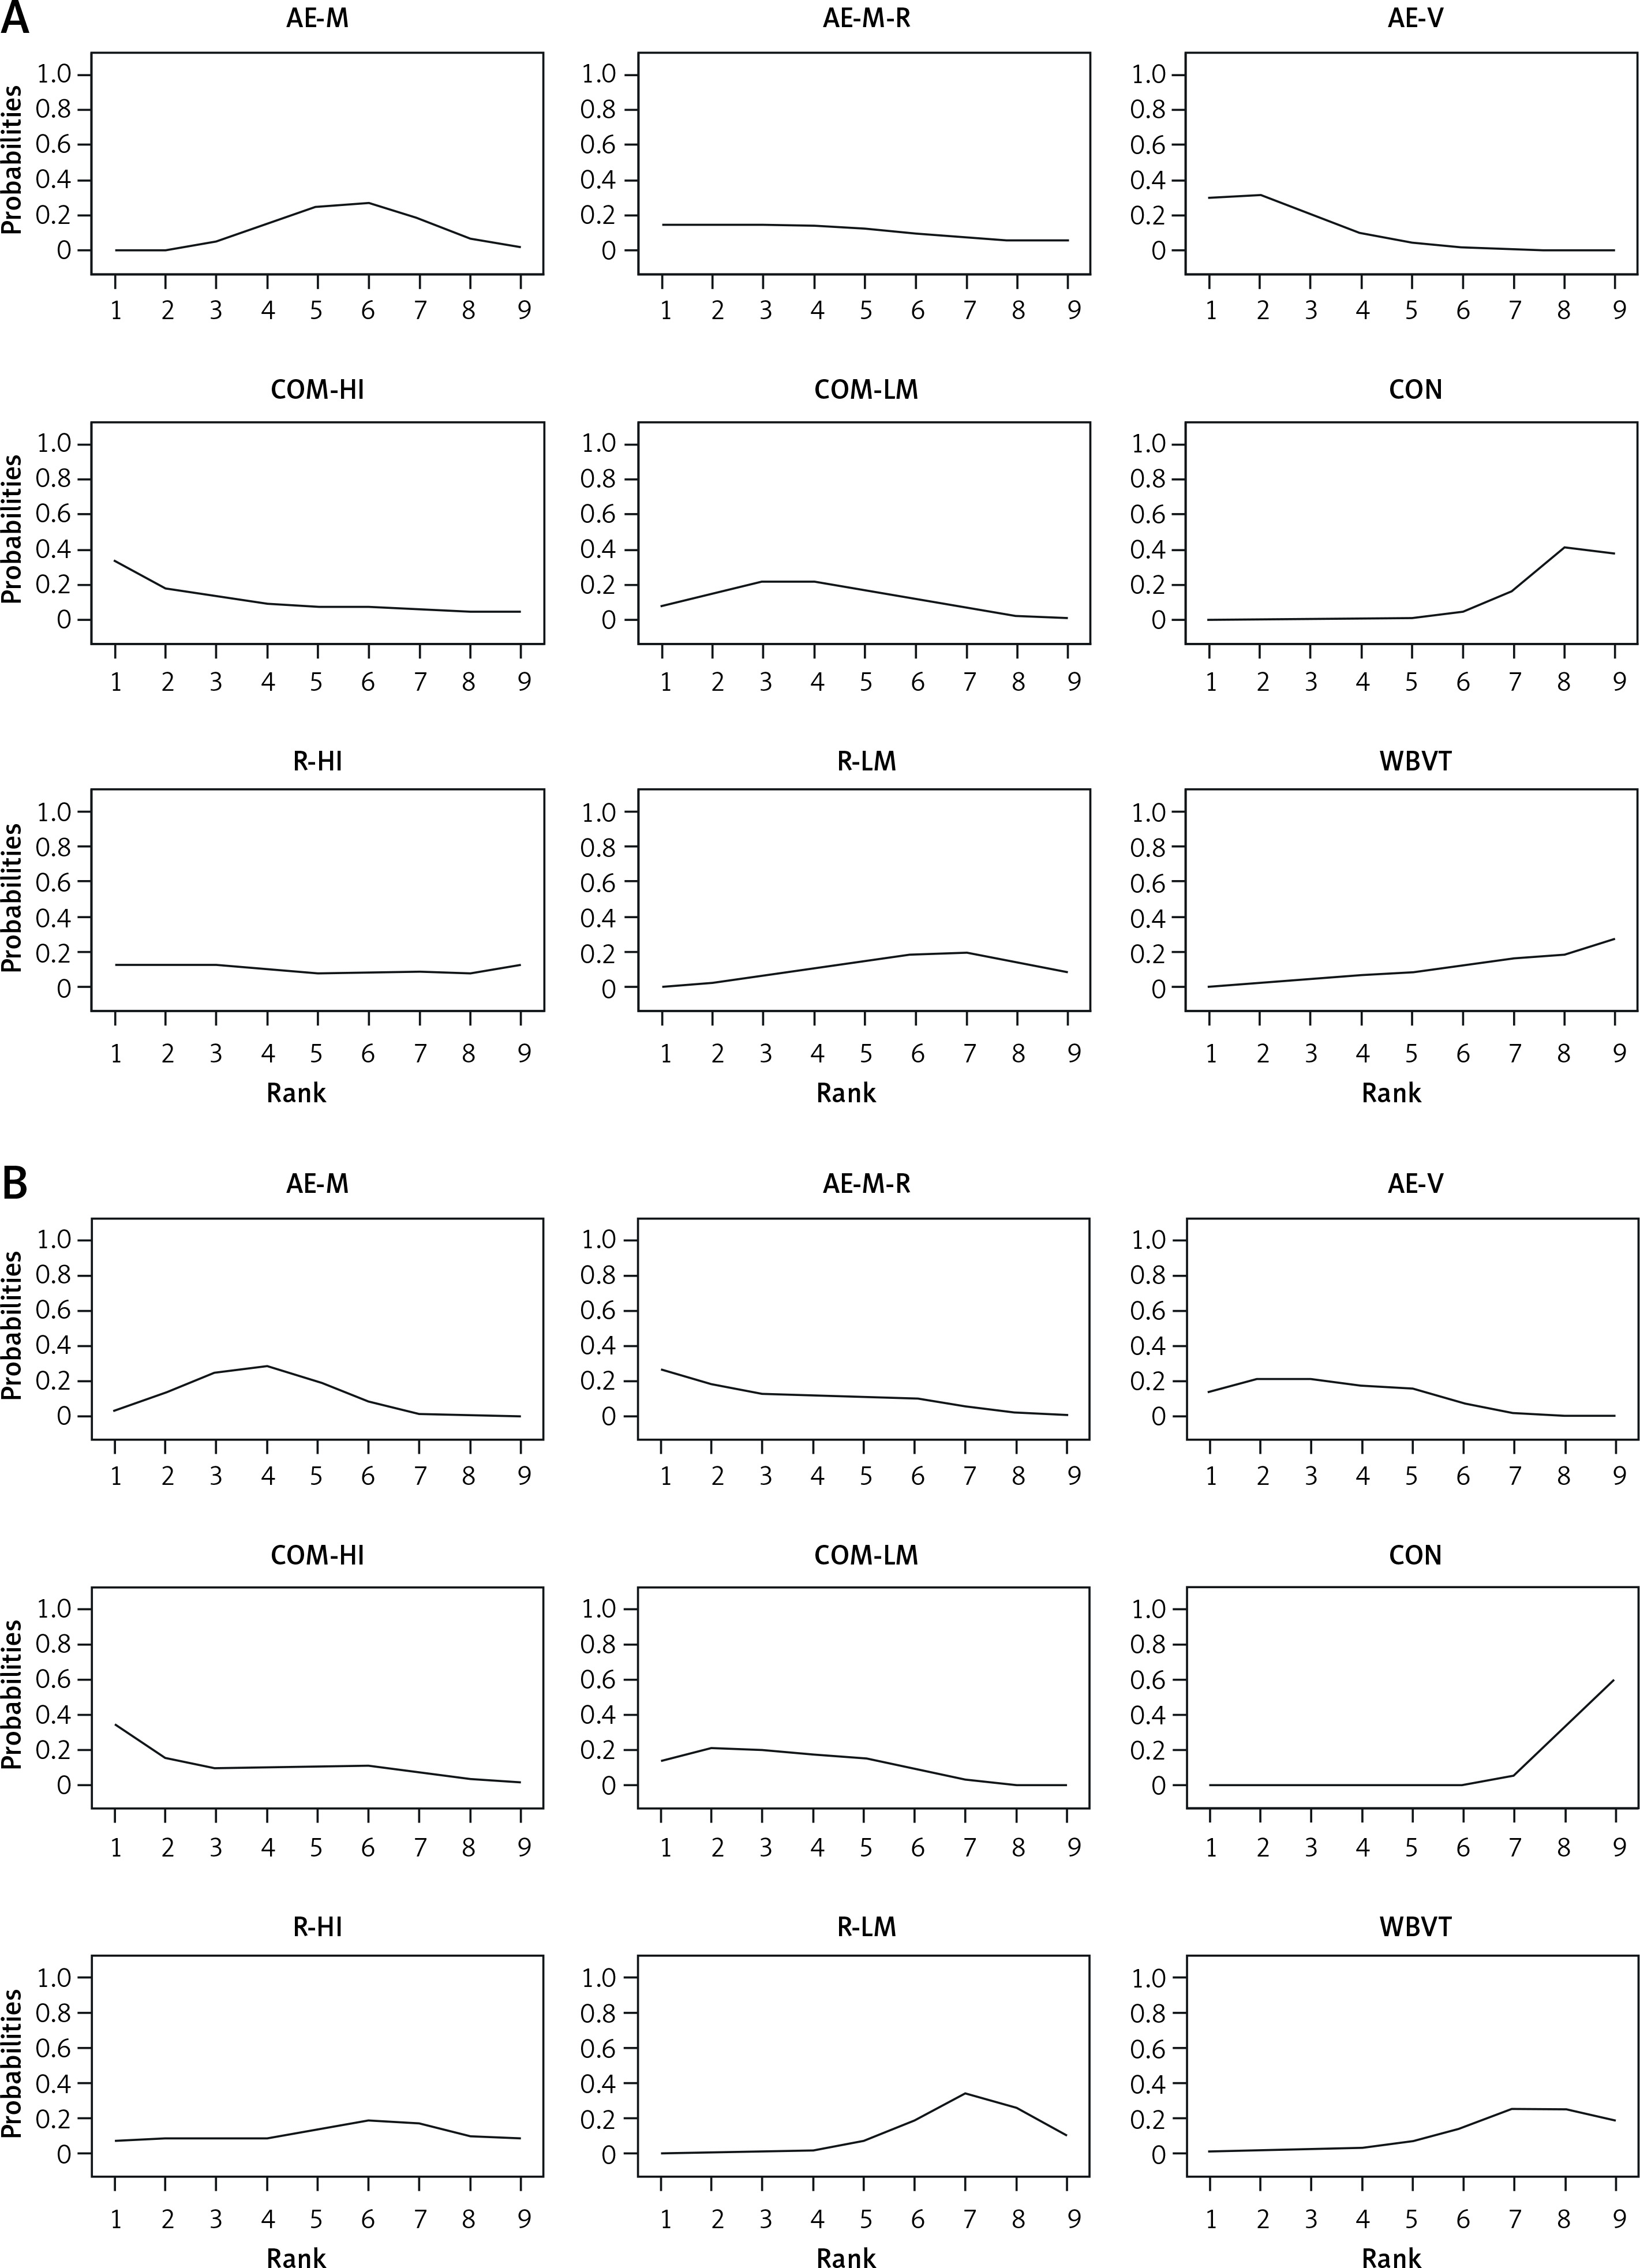
Intervention hierarchy was summarized and reported as a P score. The P score is considered as a frequentist analogue to surface under the cumulative ranking curve (SUCRA) values and measures the extent of certainty that a treatment is better than another treatment, averaged over all competing treatments. The P score ranges from 0 to 1, where 1 indicates the best treatment with no uncertainty and 0 indicates the worst treatment with no uncertainty. While the P score or SUCRA can be usefully re-expressed as the percentage of effectiveness or acceptability of the exercise interventions, such scores should be interpreted cautiously unless there are actual clinically meaningful differences between interventions. To check for the presence of bias due to small-scale studies, which may lead to publication bias in NMA, a network funnel plot was generated and visually inspected using the criterion of symmetry [32].
Results
Literature selection
A total of 6656 studies were initially identified. Following review by title and abstract, 219 studies progressed to full manuscript review. Of these, 187 were excluded as they did not fulfil our inclusion criteria. The remaining 32 studies were included in this review [33–65]. The detailed process is illustrated in Figure 1.

Characteristics of the included studies
The specific characteristics of the included studies are presented in Table III. Of these, 7 studies were from North America, 9 from East Asia, 4 from the Middle East, 7 from Europe, 2 from Oceania, 2 from South America, and 1 from Africa. A total of 1401 patients were enrolled in the study.
Table III
Detailed information on the included literature
In terms of exercise interventions, 308 people were in the AE-M group, 187 in the AE-V group, 75 in the R-LM group, 81 in the R-HI group, 95 in the COM-LM group, 25 in the COM-HI group, 63 in the AE-M-R group, There were 75 participants in the WBV group and 492 participants in the CON group.
Intervention duration was 4 weeks in 7 studies, 6 weeks in 2 studies, 8 weeks in 4 studies, 10 weeks in 1 study, 12 weeks in 13 studies, and > 12 weeks in 5 studies.
Results of ROB assessment
Specific ROB details are presented in Supplementary Table SI. Overall, 4 articles were judged to be of low ROB, 16 of moderate ROB and the remaining 12 rated as at high ROB. Eleven of the studies specify measures regarding distribution concealment, while the rest are largely unclear. In 23 studies, subjects dropped because of the subjects themselves (e.g., loss of interest or withdrawal due to time reasons). No studies have reported safety-related results. Eleven studies reported on other factors of bias.
Network meta-analysis
After the heterogeneity test for each substudy, all p-values were > 0.05 (weight: p = 0.891; BMI: p = 0.327; FAT %: p = 0.537; WC: p = 0.980 and VO2max: p = 0.916), which was considered as low heterogeneity. The consistency test between each study was also considered to be passed, as shown in Supplementary Table SII.
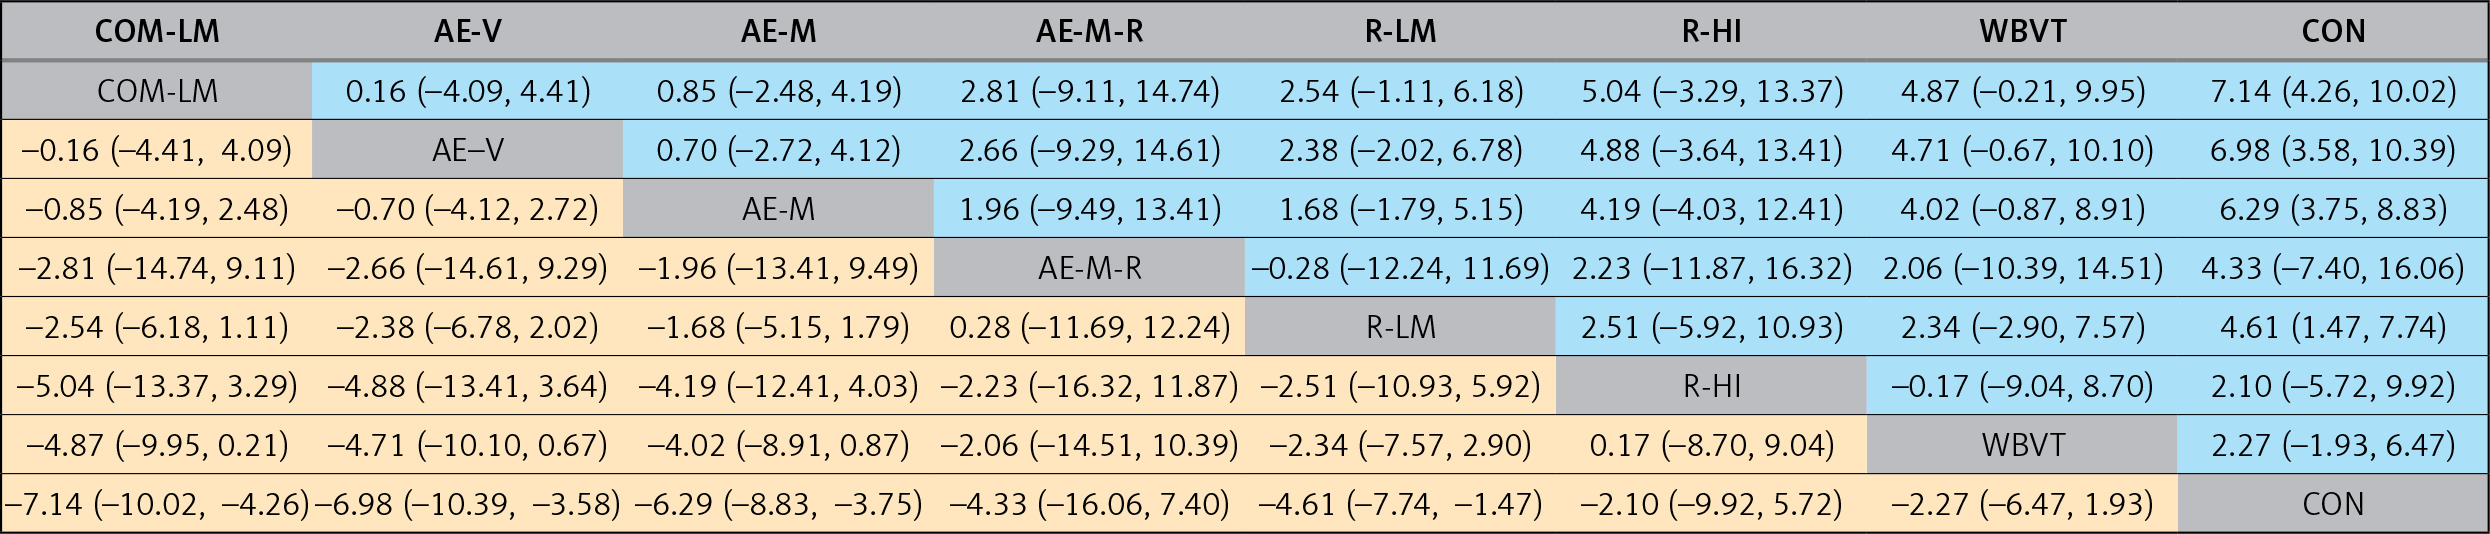
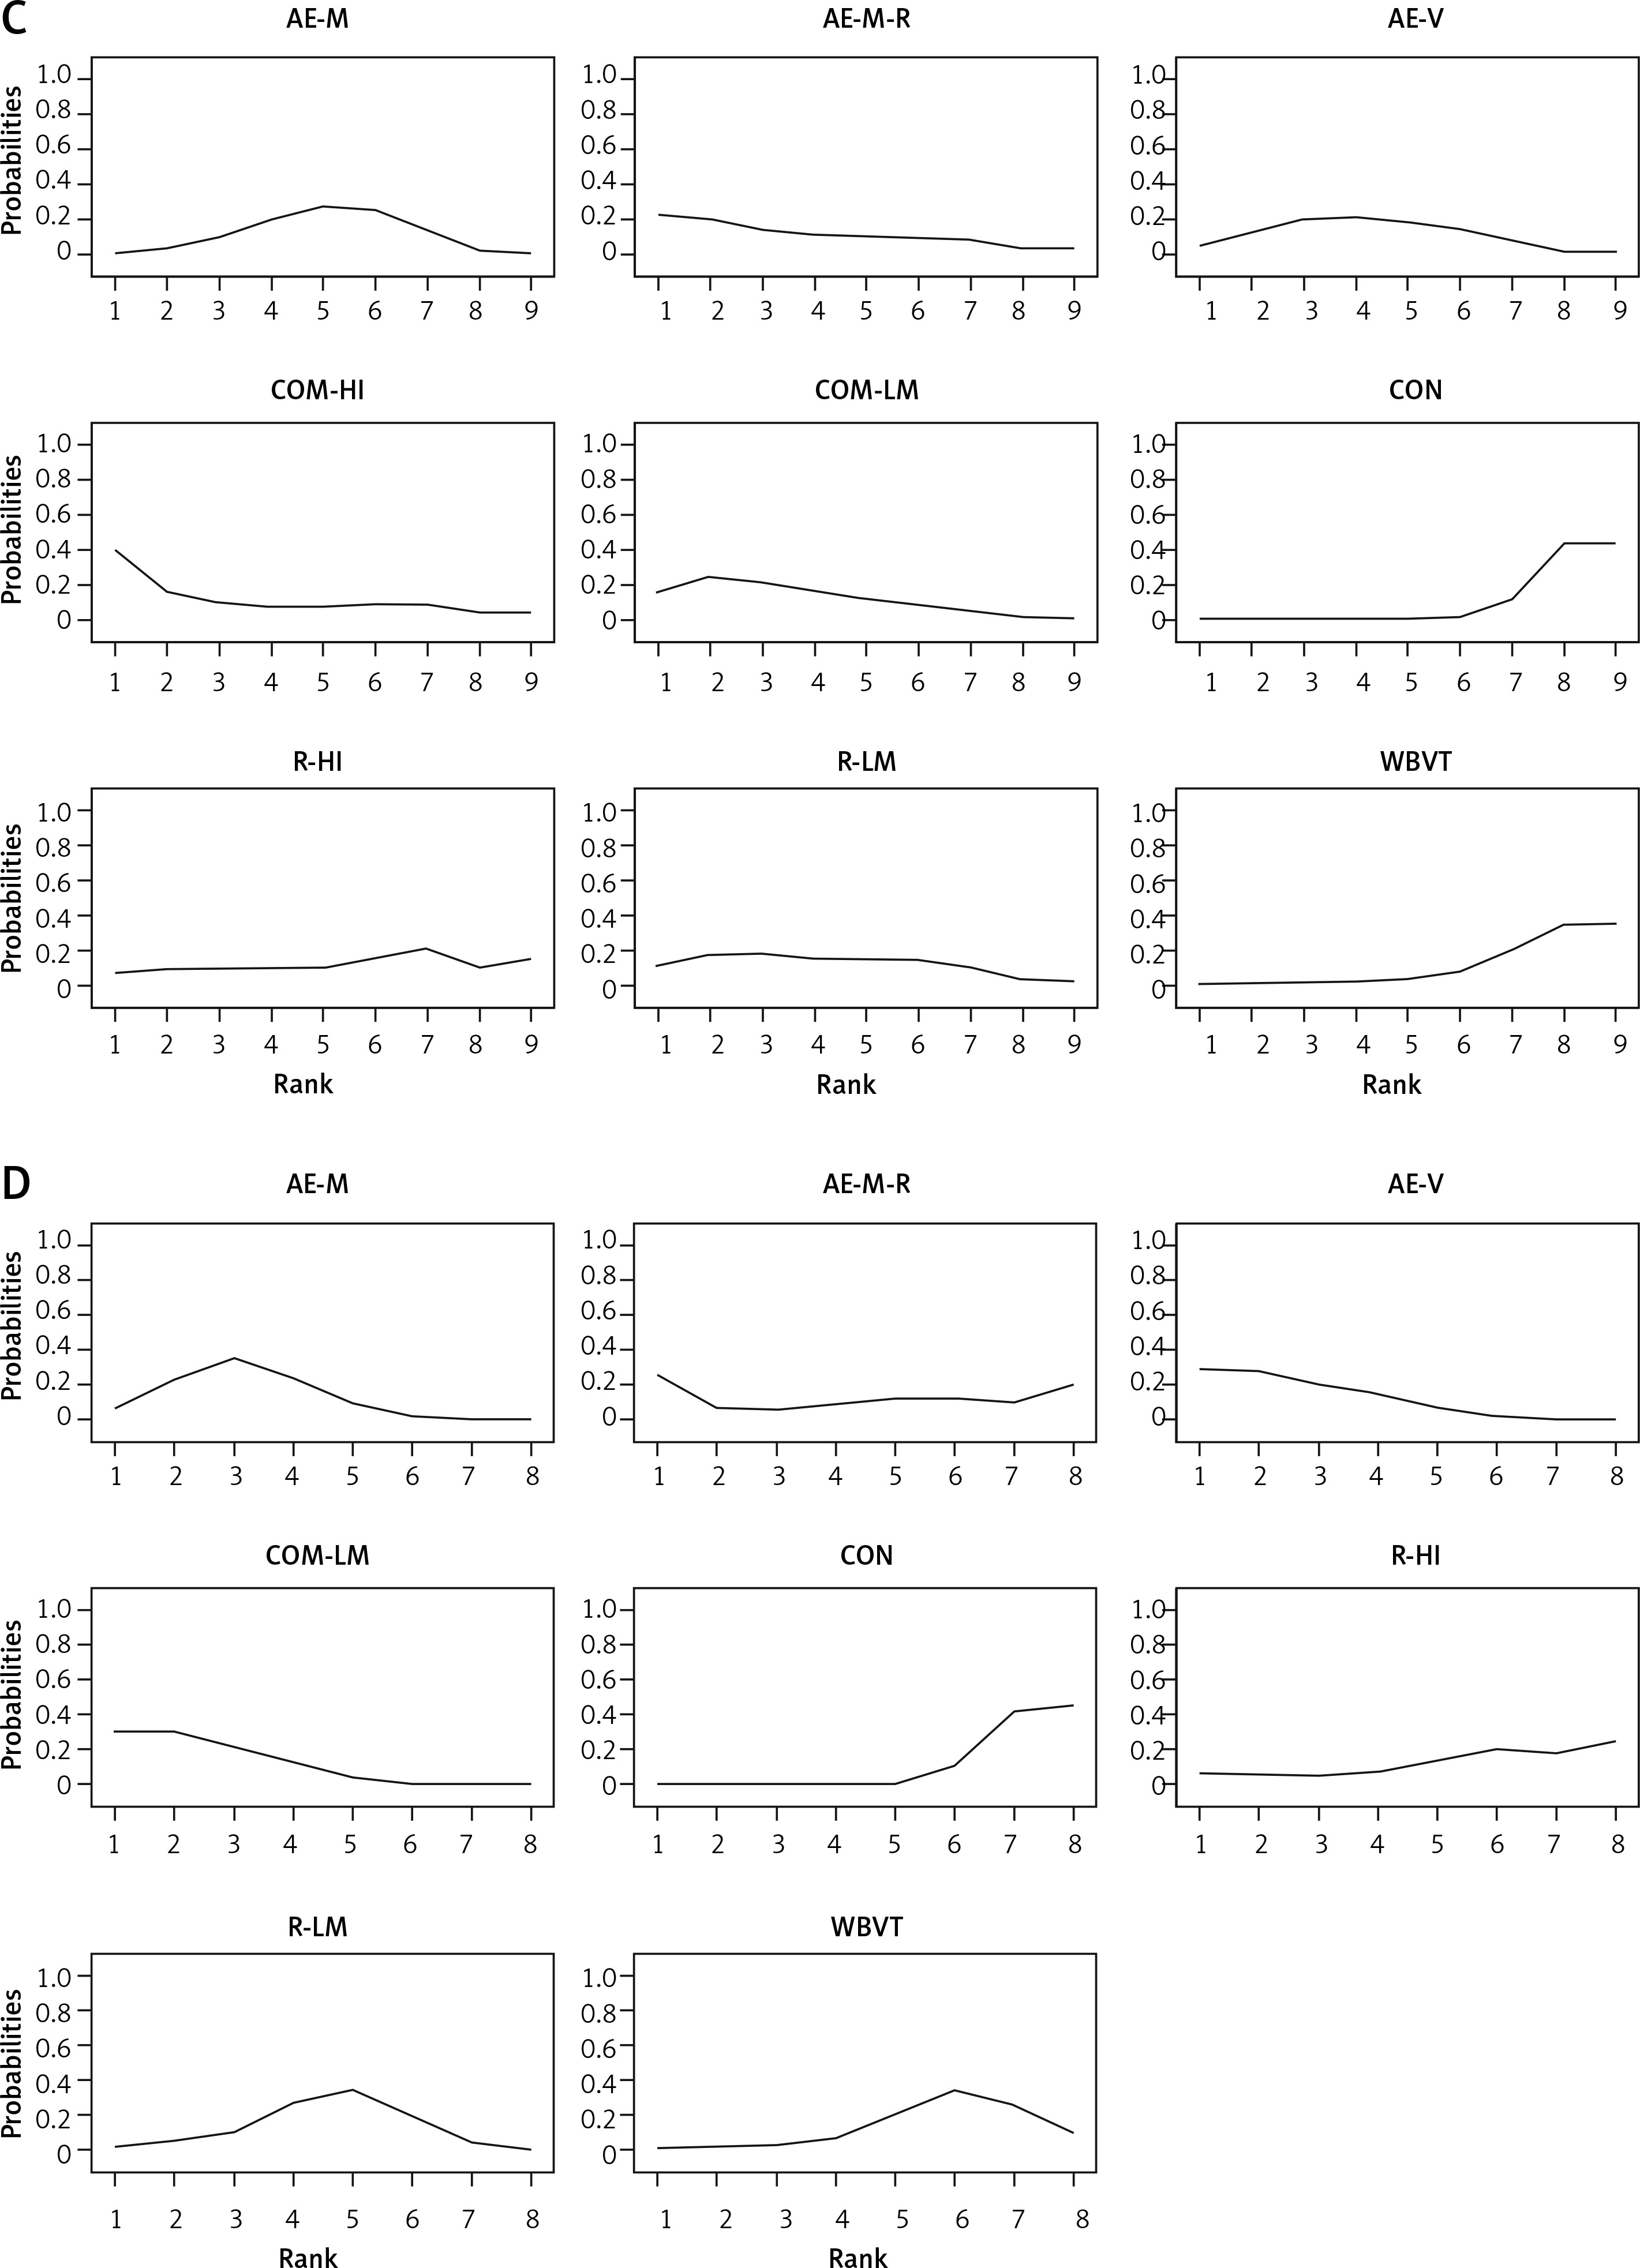
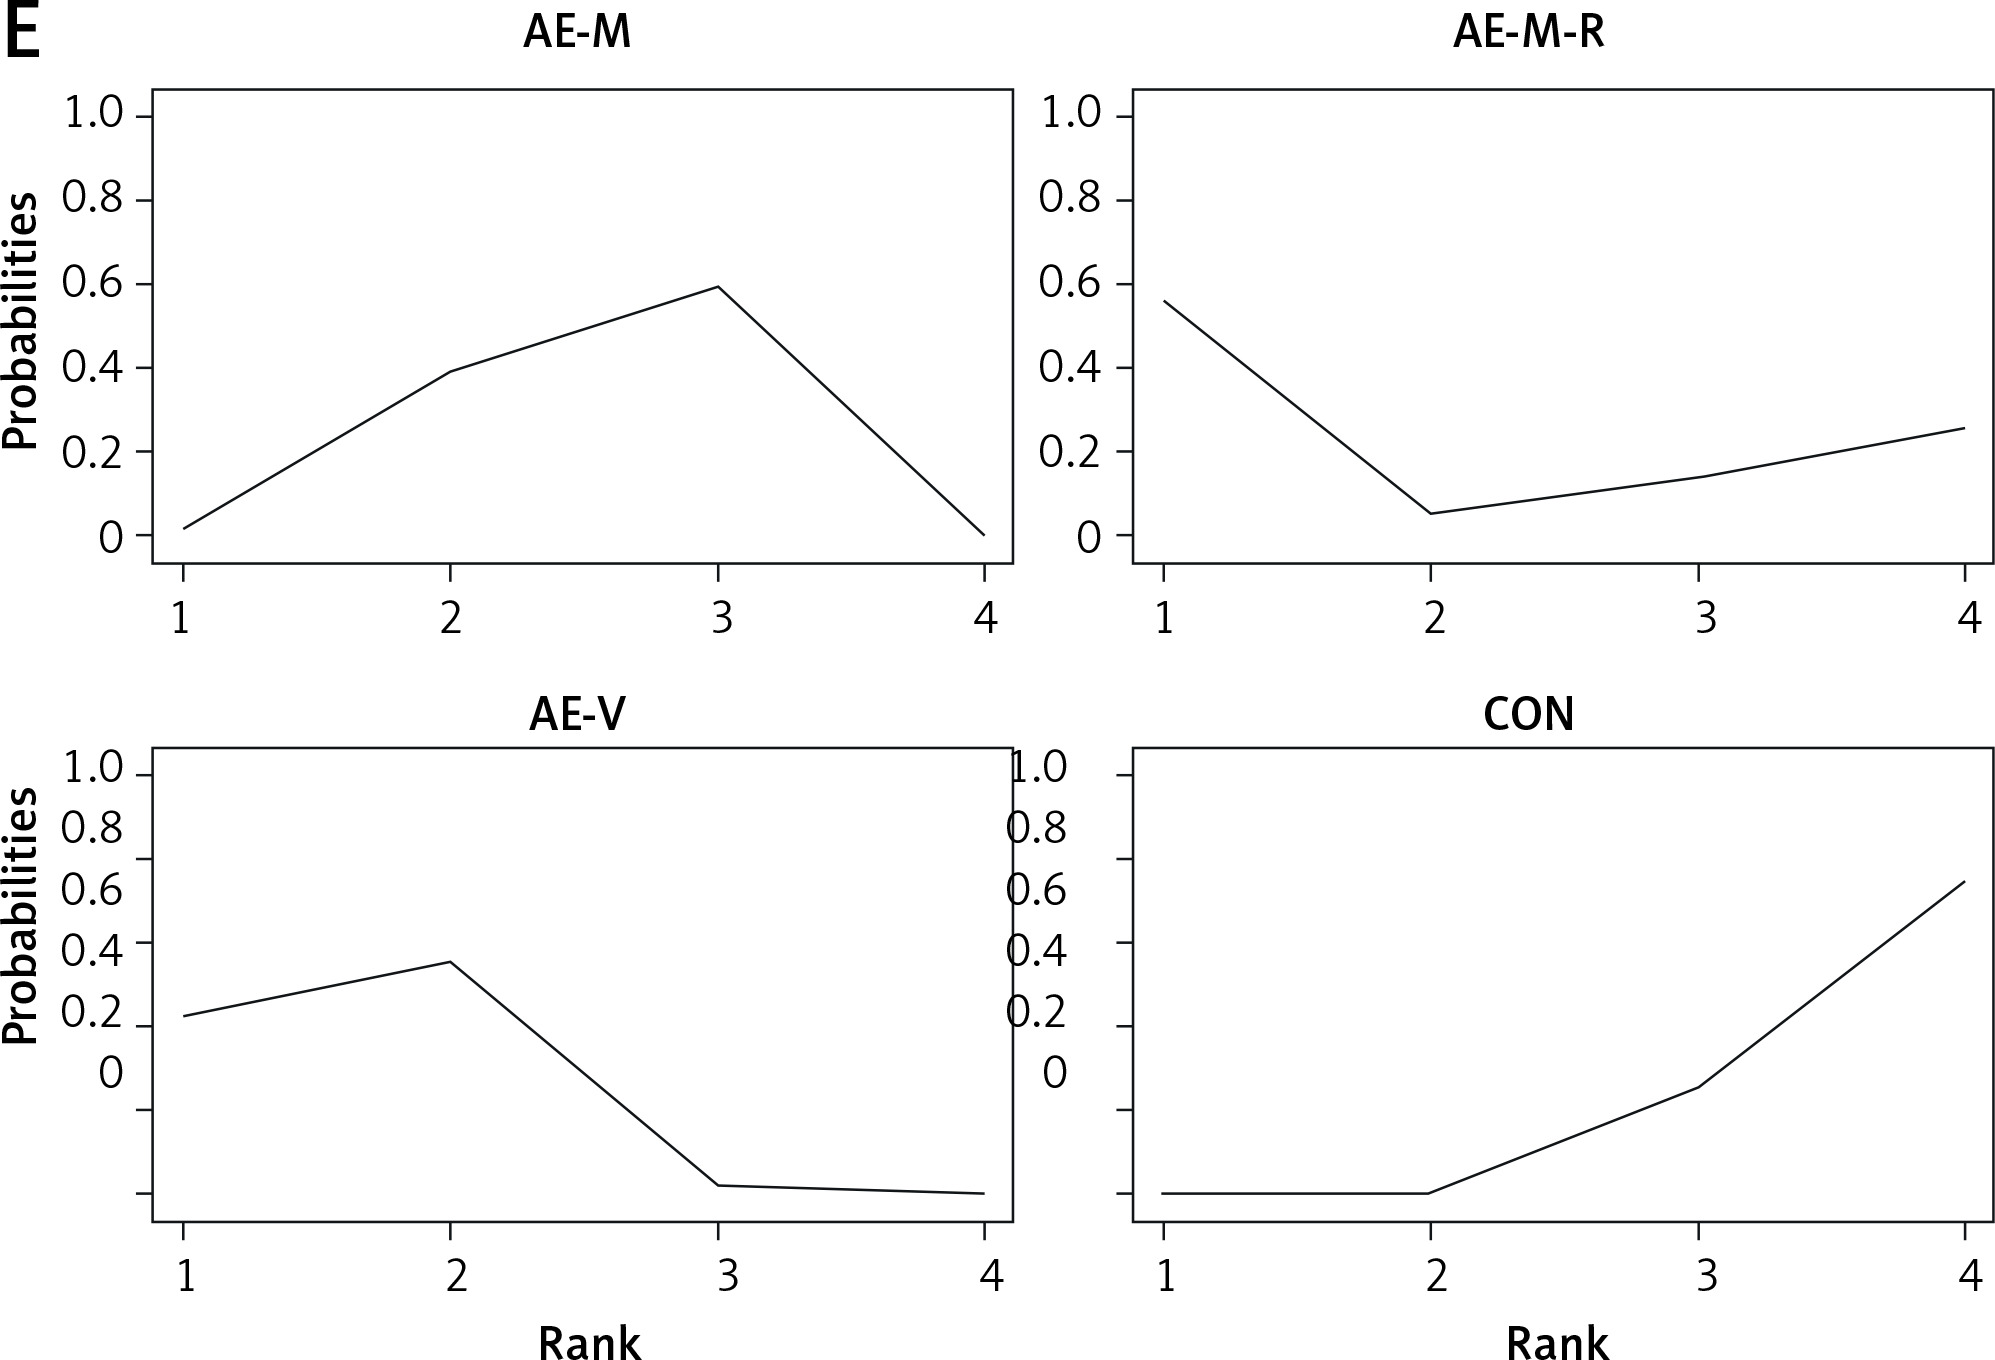
Four indicators of body composition, BMI, weight (kg), WC (cm), FAT%, and one indicator of cardiorespiratory fitness, VO2max (L min-1), are included in the NMA. Detailed information is presented in Supplementary Table SIII. Figures 2 A–E show the complete NMA diagram, which illustrates the intervention effects of different exercise interventions on BMI, weight, WC, FAT% and VO2max. The size of nodes is correlated with the number of participants of different intervention types, and the width of the lines between different interventions is correlated with the number of studies. Table IV lists the complete league chart matrix, and Table V is ranked according to the likelihood of the expected effects of the exercise intervention. SUCRA area is shown in Figures 3 A–E.
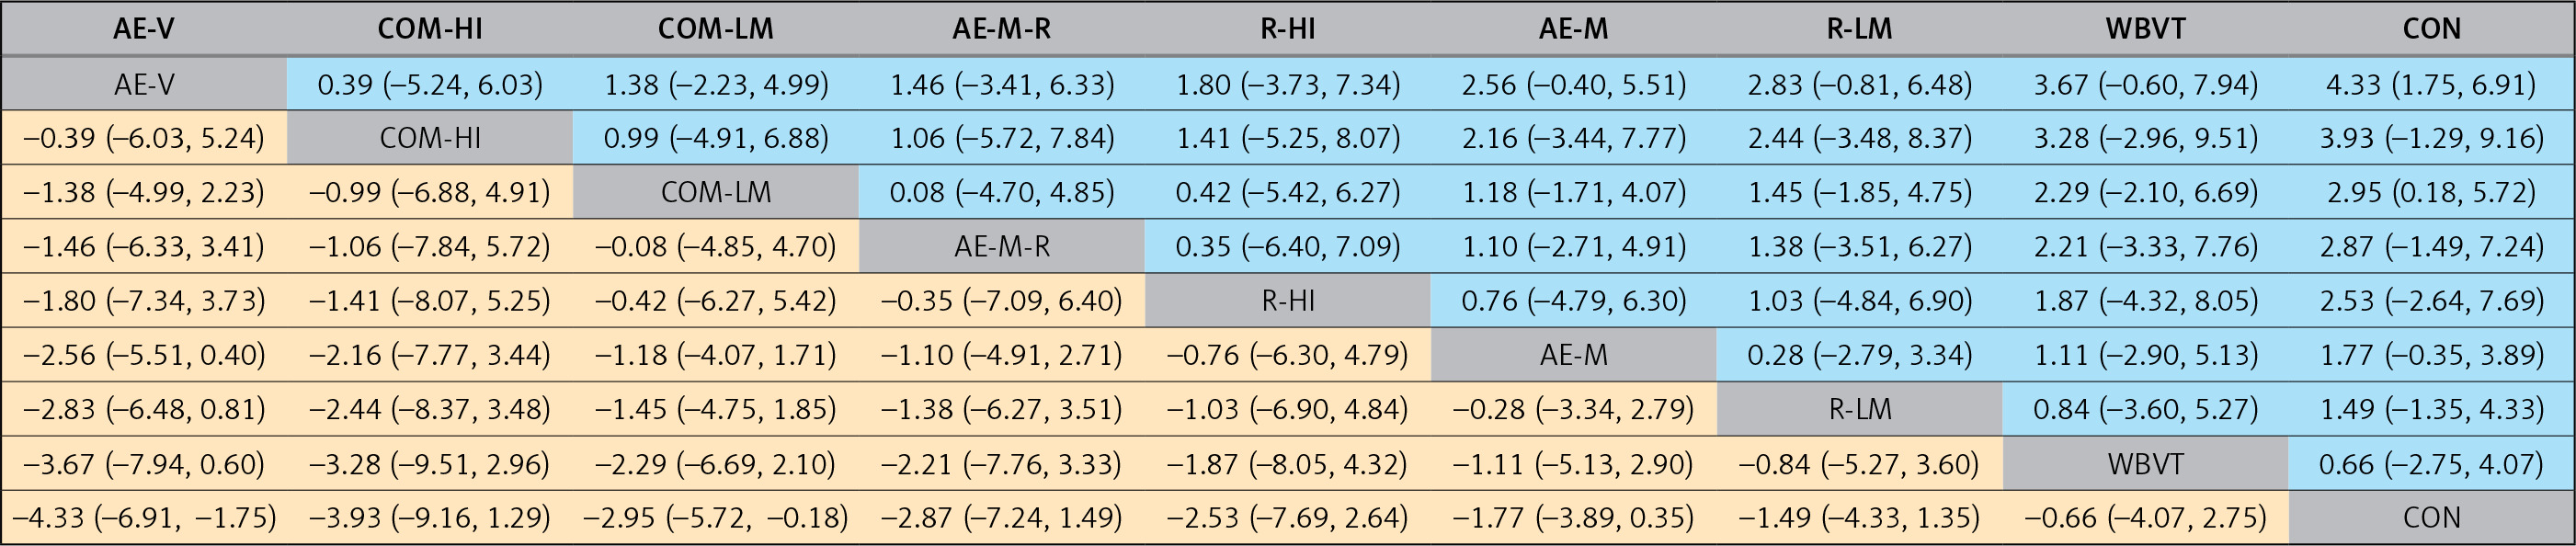
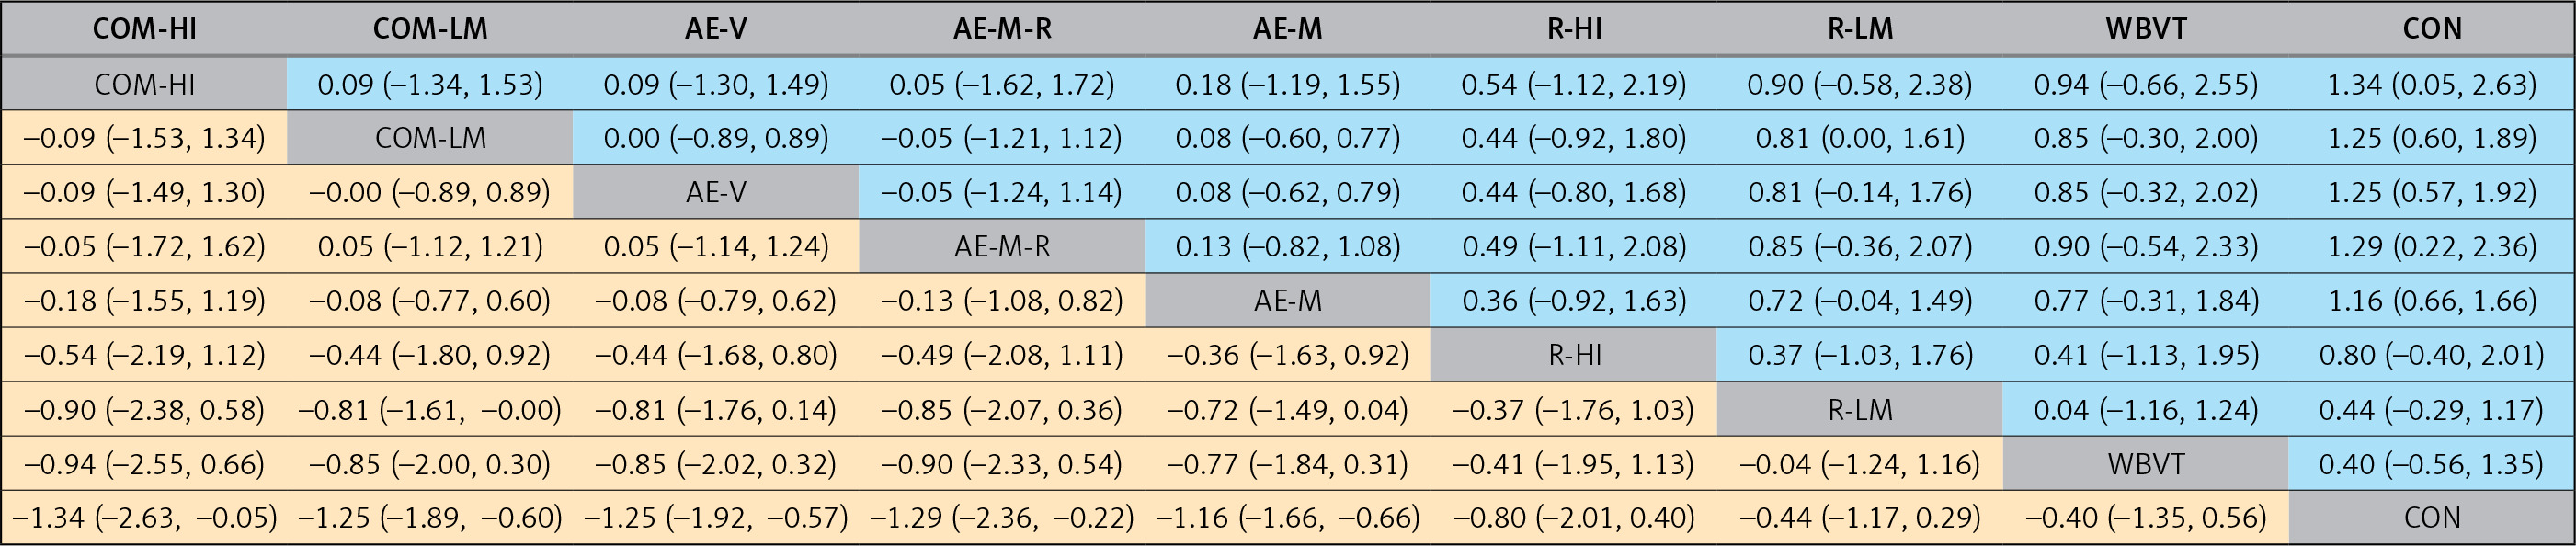
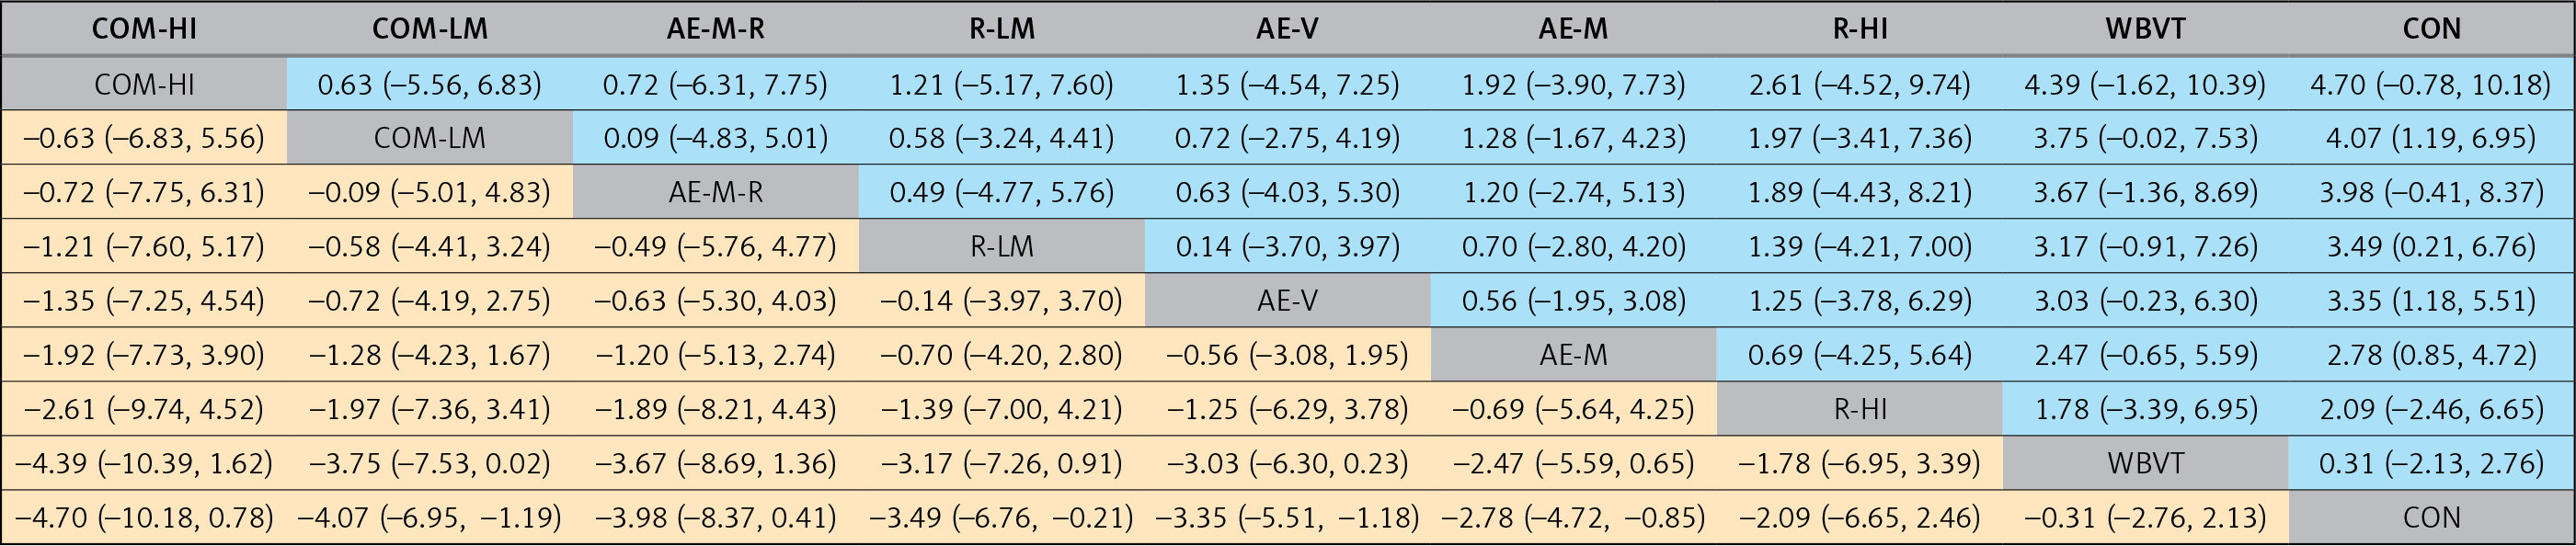
Table IV
League charts of direct and indirect comparisons between different interventions
| Weight | ||||||||
 | ||||||||
| BMI | ||||||||
 | ||||||||
| FAT% | ||||||||
 | ||||||||
| WC | ||||||||
 | ||||||||
| VO2max | ||||||||
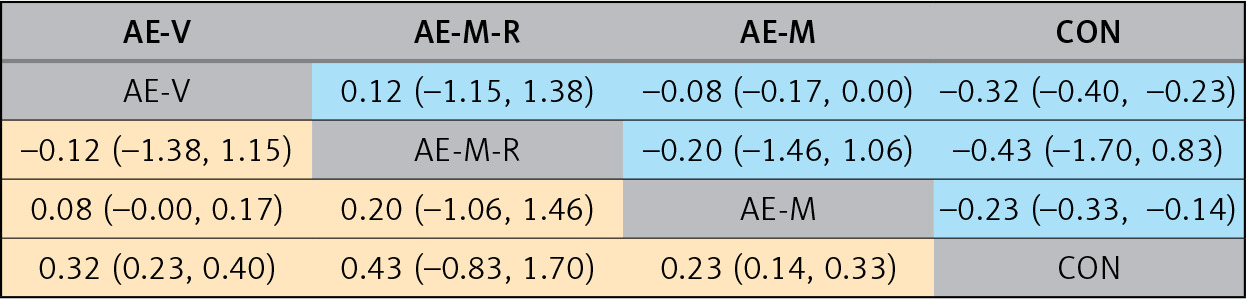 | ||||||||
Table V
P score
Body weight
Twenty-seven studies (8 intervention categories) helped us conduct NMA in terms of body weight. The average ranges from –2.95 to –4.33. The two exercise measures had significant advantages over the control group in terms of weight reduction, and the difference was statistically significant (AE-V: –4.33 [–6.91, –1.75] and COM-LM: –2.95 [–5.72, –0.18]). The complete league chart comparison is presented in the table. In NMA comparison, AE-V was the best intervention to reduce body weight (P score = 0.82).
BMI
Twenty-seven studies (8 intervention categories) helped us to conduct NMA in BMI. The average ranges from –1.16 to –1.34. The five exercise measures had significant advantages in reducing BMI compared with the control group, and the difference was statistically significant (COM-HI: –1.34 [–2.63, –0.05]; COM-LM: 1.25 [1.89, 0.60]; AE-V: 1.25 [1.92, 0.57]; AE-M-R: 1.29 [2.36, 0.22] and AE-M: 1.16 [1.66, 0.66]). The entire league contrast figure is presented in the table. In NMA comparison, COM-HI was the best intervention to reduce BMI (P score = 0.71).
FAT%
Nineteen studies (8 intervention categories) helped us to conduct NMA in FAT%. The average ranges from –2.78 to –4.07. The four exercise measures had significant advantages in FAT% reduction compared with the control group, and the difference was statistically significant (COM-LM: –4.07 [–6.95, –1.19]; R-LM: 3.49 [6.76, 0.21]; AE-V: 3.35 [5.51, 1.18]) and AE-M: Com-hi was the best intervention to reduce FAT% in NMA (P score = 0.73). Com-hi was the best intervention to reduce FAT% in NMA (P score = 0.73).
WC
Ten studies (seven intervention categories) helped us conduct NMA in WC. The average ranges from –7.14 to –4.61. The four exercise measures had significant advantages in reducing WC compared with the control group, and the difference was statistically significant (COM-LM: –7.14 [–10.02, –4.26]; AE-V: –6.98 [–10.39, –3.58]; AE-M: –6.29 [–8.83, –3.75] and R-LM: –4.61 [–7.74, –1.47]). The complete league chart comparison is presented in the table. In comparison of NMA, COM-LM was the best intervention to reduce WC (P score = 0.81).
VO2max
Eight studies (3 intervention categories) helped us conduct NMA in VO2max. The average ranges from 0.23 to 0.32. The two exercise measures had significant advantages over the control group in improving VO2max, and the difference was statistically significant (AE-V: 0.32 [0.23, 0.40] and AE-M: 0.23 [0.14, 0.33]). The complete league chart comparison was presented in the table. In NMA comparison, AE-V was the best intervention to improve VO2max (P score = 0.80).
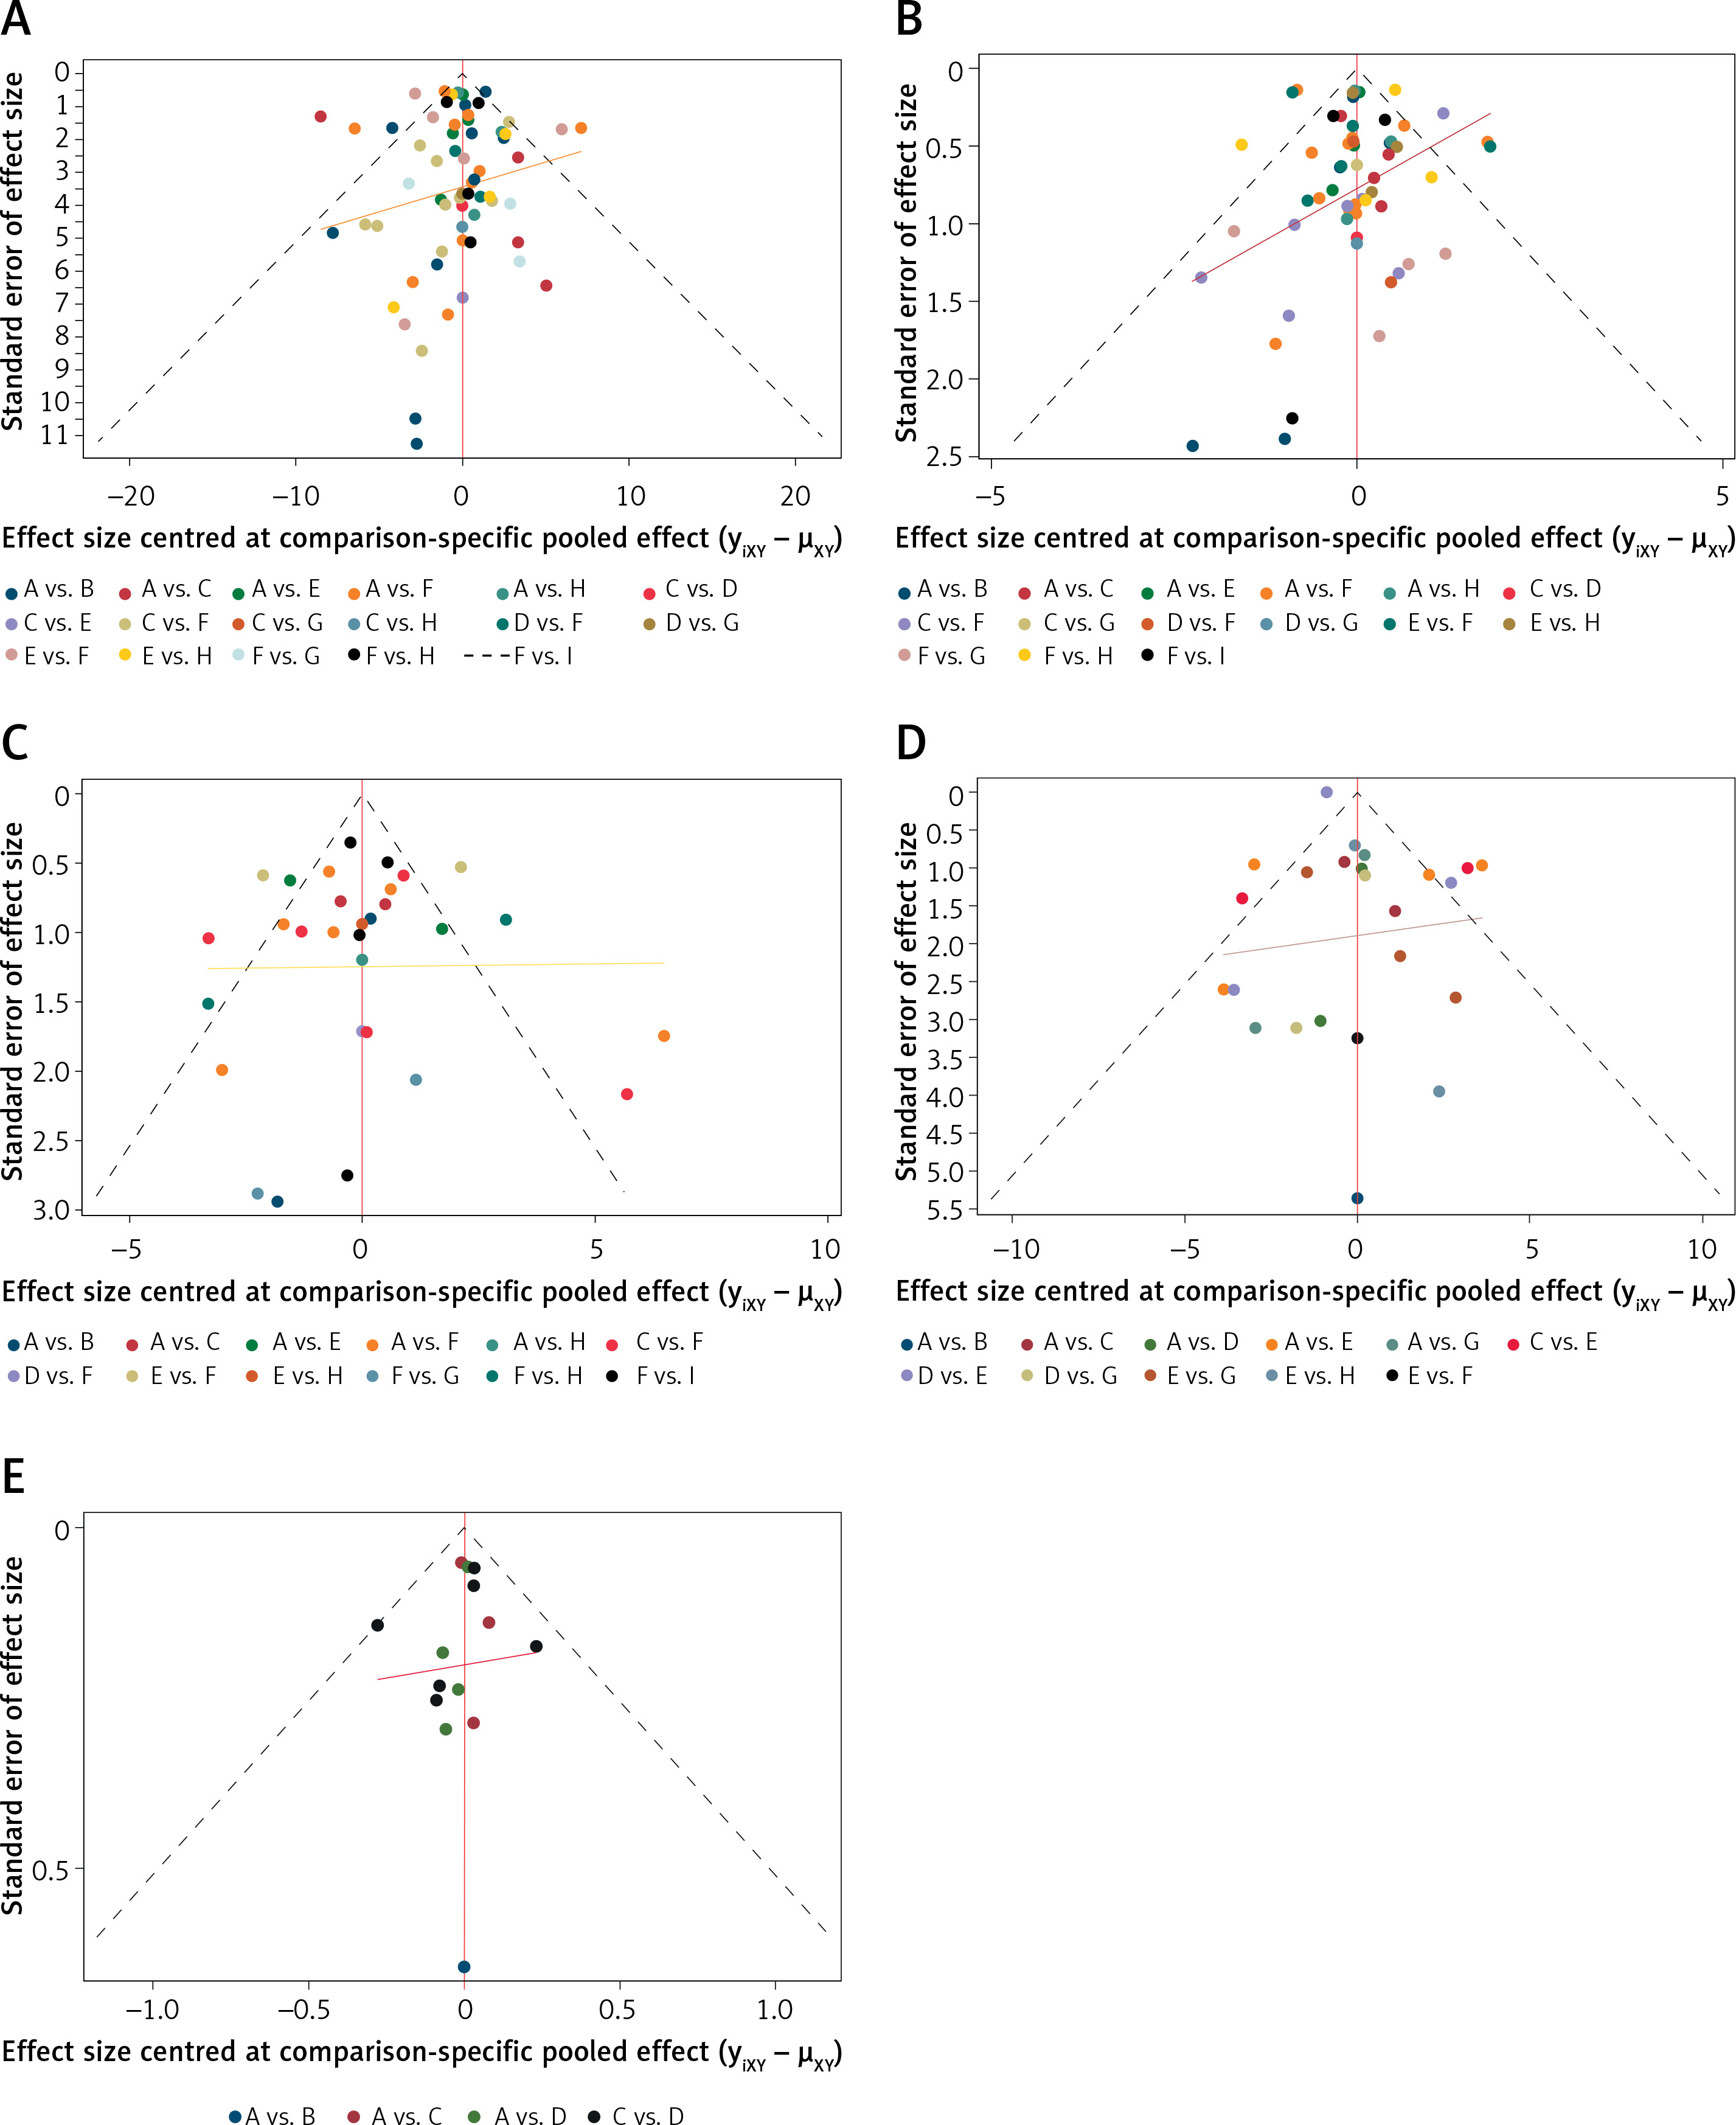
Publication bias test
Stata15.1 was used to test the funnel plot of the research results. The funnel plot of weight had poor symmetry and might have publication bias. The funnel plot of other related indicators is shown in Figures 4 A–E.
Discussion
In this NMA, we compared the effects of different exercise interventions on weight loss in 1401 obese young adults. We pooled the results of 32 RCTs and made direct and indirect comparisons. High-intensity aerobic exercise may be the best way to reduce the weight of obese people; high-intensity aerobic training combined with resistance training may be the best way to reduce BMI and FAT%; moderate-intensity aerobic training combined with resistance training may be the best way to reduce the waistline; high-intensity aerobic exercise may be the best way to boost VO2max.
Our findings suggest that different intensities of exercise interventions produce different effects on weight and BMI reduction, with high intensity aerobic exercise and high intensity aerobic exercise combined with high intensity resistance training being more effective than low to moderate intensity exercise interventions, possibly because higher intensity exercise causes excess post-exercise oxygen consumption, and the substrate for these energy oxidations is fat, in addition to the fact that during high intensity exercise the body needs to secrete more adrenaline and noradrenaline for muscle control and after exercise the body still maintains a high metabolic level for a longer period of time. All of these effects cause an increase in the resting metabolic level of the body, which further stimulates fat burning [66–68]. In addition, aerobic exercise combined with resistance training is more effective than resistance training alone, which is the same as the results reported in previous studies [69].
At the same time, however, recent research suggests that the percentage of body fat (fat%) may be a more accurate indicator of weight loss than BMI or body weight [70]. A recent meta-analysis showed that exercise as an intervention had a greater impact on fat% change than body weight change, but since the type of exercise intervention reported in this study was a single exercise mode, it is difficult to say which exercise mode had a greater impact on fat% change. In addition, our study shows different results from previous studies due to the inclusion of the COM-HI motion mode. In their study, Pedro et al. mentioned that resistance training combined with aerobic training had a –3.8% reduction in fat%, 95% CL: [–4.7, –2.9] [71], and in Mary et al.’s study, resistance training had the greatest effect on fat% reduction, –1.4%, 95% CL: [–4.24, 1.44] [72]. However, our study suggested that COM-HI was perhaps the best exercise intervention for reducing fat%: –4.7%.
In addition to the above indicators on the overall changes of the body, abdominal fat volume, as a local change indicator [73], has gradually been recognized by the academic community as a better indicator for predicting obesity and obesity-related diseases (such as hypertension, coronary heart disease, stroke, etc.). Waist circumference is often used as a simple measure of abdominal fat, and changes in waist circumference can lead to changes in abdominal fat, which in turn can lead to changes in health-related risks [74]. Related studies have reported that larger waist circumference is associated with higher risk of cardiovascular disease and mortality [22]. In our NMA, COM-LM was found to be the best type of exercise in reducing waist circumference, which is consistent with the results reported in a previous study [75]. However, it is worth noting that no study has reported the effect of COM-HI on waist circumference, and in view of the research results of other indicators in this NMA, we maintain a conservative attitude towards the result that COM-LM is the best type of exercise to improve waist circumference. We hope that there will be further studies to support our hypothesis.
In addition, compared with previous studies on the intervention effect of exercise on obese people, our NMA is more prominent in the inclusion of the index of cardiopulmonary fitness (VO2max). Most of the previous studies focus on the changes in body composition of obese people caused by exercise. The American College of Sports Medicine (ACSM) suggests that improving cardiopulmonary fitness can help reduce all-cause mortality and health risks in obese people [23]. In addition, increased cardiopulmonary fitness can improve the autonomic nervous system (ANS) in obese patients. Therefore, we believe that the improvement of cardiopulmonary fitness is an important indicator for obese young people. We observed that aerobic exercise has a good effect on cardiopulmonary fitness of obese young people, especially the category of AE-V.
Both aerobic exercise and resistance training are helpful to the effect of weight loss in obese young people, but they have their own characteristics. Firstly, aerobic exercise cannot reduce the number of fat cells, but can inhibit the accumulation of fat cells and reduce the volume of fat cells [76]. Secondly, aerobic exercise can improve the reduction of insulin receptor binding and insulin resistance of obese people, and avoid storing a large amount of energy as fat [77]. Thirdly, during aerobic exercise, the sympathetic nerve is activated and the plasma insulin resistance concentration increases, and the decrease of insulin secretion will increase the activity of related enzymes in the process of fat hydrolysis, thus accelerating the hydrolysis of fat [78]. Finally, aerobic exercise also increases growth hormone and adiponectin levels, which play a role in reducing abdominal fat and circulating free fatty acids [79]. In terms of resistance training, it can change the metabolic characteristics of skeletal muscle, strengthen muscle anabolism, increase muscle weight, and increase lean body weight. In addition, resistance strength can also increase resting basal metabolic rate (RMR) [80]. The improvement of RMR has a good effect on the regulation of body weight. An increase in RMR of 1–2% has a great influence on the regulation of body weight. Finally, resistance training can also reduce the exercise-induced oxidative stress response and increase the glycated hemoglobin glycosylated hemoglobin (HbA1c) level [81] in obese people.
Finally, we found that fewer people mentioned before that hypoxic training is a kind of effective exercise intervention, a low oxygen environment is a stimulus for the organism, short and long term low oxygen exposure in the body or hypoxia training will occur after a series of reactions and adaptability to changes, including body oxygen transport, oxygen utilization of the glucose transporter [82], changes in vasodilation function and related metabolic enzyme activities. Periodic hypoxia training can promote and improve the body health status, and meanwhile, hypoxia has a significant improvement effect on lipid metabolism. Hypoxia training can improve the body composition and lipid level of obese people by affecting the activity of the glycolytic enzyme, increasing serum in the blood and reducing the leptin level [83].
Our NMA has several advantages and disadvantages. First of all, the investigation of the corresponding study was comprehensive, systematic and detailed, including a large sample size of obese young people (n = 1401), so the differences in comparison between different groups could be detected. Our study only analyzed RCTs, the gold standard for evaluating the effectiveness of clinical interventions. At the same time, on the basis of conventional exercise interventions, we added new exercise interventions (AE-M-R and WBV) with fewer studies. A meta-analysis also described the effect of intervention duration on exercise effect, and the peak of the exercise effect occurred 8–32 weeks after intervention. In our study, 26 original studies had interventions with duration > 8 weeks (accounting for about 81% of the total included studies).
Admittedly, our study shares some limitations with the research on which it is based. Although we did our best to control for heterogeneity in the inclusion of these original studies, heterogeneity between studies was unavoidable (e.g., study location and ratio of male to female participants). In addition, metabolic outcomes related to obesity (e.g., blood pressure, triglycerides, high-density lipoprotein) were not included in this NMA because there were too few reports of relevant data in the original studies included. However, since exercise is considered a cornerstone for the prevention and management of metabolic syndrome, we suggest that subsequent RCTs should consider reporting these metabolic markers as an important outcome indicator.
In our study, readers should interpret the results with caution because of the small number of studies and limited evidence for direct head-to-head comparisons of certain interventions. At the same time, it also highlights the necessity and timeliness of further expanding relevant research.
Finally, this article has included in 12 of the 32 study is defined as a high risk, but because for sport as intervention study, implement blinded for intervention objects, and researchers is not too realistic, before intervention, always by the patients themselves or their relatives signed the informed consent form to ensure safety research.
In conclusion, our study shows that different exercise methods are effective in treating primary obesity in young people, but moderate to high intensity aerobic training combined with resistance training is the most recommended exercise method. However, more studies are needed to expand the results of this study to update the therapeutic effects of different exercise interventions on primary obesity in young adults.