Introduction
Parkinson’s disease (PD) is the most common neurodegenerative disorder after Alzheimer’s disease (AD). Parkinson’s disease typically develops between the ages of 55 and 65 years. Approximately 2% of people over the age of 60 years are affected, and this percentage rises to 3.5% at the age of 85–89 years [1].
Parkinson’s disease is a complex neurological disease associated with the progressive degeneration of dopaminergic neurons in the substantia nigra pars compacta (SNPC) and in the locus coeruleus. The histopathological hallmarks of PD are the accumulation of aggregates of α-synuclein, known as Lewy bodies, in the SNPC, causing degeneration of the extrapyramidal circuits of the midbrain and basal ganglia, eventually resulting in several signs and symptoms due to the impairment of motor control and modulation [2, 3]. The intracellular aggregates of α-synuclein damage the neuronal membrane, inducing the phenomena of oxidative stress, excitotoxicity, energy failure, and neuroinflammation, thus leading to neural death [4].
Both motor and non-motor signs characterize the clinical picture of typical PD patients. Among the former, bradykinesia, resting tremor, muscle rigidity, postural instability, and hypomimic face are common manifestations [5]. The accumulation of Lewy bodies also in the cerebral cortex and autonomic and peripheral nervous system [6] produces a variety of non-motor symptoms, such as cognitive decline until dementia, mood changes, sleep disorders, and dysautonomia (including hypotension and urinary disturbances). Cognitively, sequence learning, motor sequence, switching between different tasks, and verbal fluency are the cognitive domains usually affected in PD patients [7].
In this scenario, PD pathophysiology also includes mitochondrial dysfunction and the related inhibition of the electron transport chain. These pathomechanisms lead to the generation of reactive oxygen species (ROS) and cellular energy failure, thus consequently causing cellular damage and neuronal death.
Mitochondria are present in all nucleated human cells and underlie multiple functions, especially the generation of energy for the cell. Mitochondrial dysfunction leads to insufficient energy production required to satisfy the needs of several organs, especially the nervous system [8]. Growing evidence has shown that impairment of the mitochondrial respiratory chain plays a key role in several neurodegenerative diseases, including PD [8, 9].
Specific elements of the respiratory chain within the mitochondrial membrane can be impaired following a disruption of the electron transport efficiency. Namely, defects of complex I, which represents the first step in the electron transport chain of mitochondrial oxidative phosphorylation (OXPHOS), have been documented in SNPC, platelets, and skeletal muscle of idiopathic PD patients [10–12]. Since then, altered complex I activity has been reported in fibroblasts and in the frontal cortex [13, 14]. Complex IV (or cytochrome c oxidase) represents the last enzyme of this chain, whereas complex V (ATP synthase) is a ubiquitarian membrane enzyme playing a crucial role in energy metabolism [15].
In this context, mitochondrial dysfunction has been closely linked to the development and pathophysiology of PD [16]. In particular, damage of the electron transport chain, inhibition of complex I activity, mishandling of calcium, enhanced sensitivity to mitochondrial toxins, oxidative stress, and dysfunctional mitochondrial dynamics might all contribute to neuronal dysfunction and take part in the onset, course, and severity of PD [17]. As the relevant energy-producing organelles within the cell, mitochondria oxidize carbon and further release adenosine triphosphate (ATP) through oxidative phosphorylation [18]. Furthermore, progressive mitochondrial damage might lead to the accumulation of non-functional mitochondria, thus further contributing to cellular dysfunction and neuronal degeneration [17].
Based on these considerations, in the present study we evaluated the expression of the mRNA of eleven mitochondrial subunits (Table I) in a sample of PD patients compared to normal controls (NC). We hypothesized that specific mRNA expression profiling of mitochondrial subunits might be useful for early detection of PD and differentiation with NC.
Table I
Description of the studied mitochondrial subunits
Material and methods
Participants and samples for qRT-PCR and RNA sequencing study
For the analysis through qRT-PCR, a total of 86 participants, including 43 NC (15 females and 28 males; age range 56–84 years) and 43 PD patients (15 females and 28 males; age range 56–84 years) were enrolled at the Oasi Research Institute-IRCCS, Troina (Italy). Both NC and PD patients were Caucasian and of Sicilian ancestry. Family history was obtained through a detailed interview with a first-degree relative or the proband spouse. Clinical and past medical history of each patient was collected, including drug prescriptions, medical records, and medical certificates. Clinical diagnoses were provided by a trained neurologist according to the current diagnostic criteria for PD [19].
For the analysis through next generation sequencing (NGS), 16 NC (9 females and 7 males; age range 50–88 years) and 21 PD patients (8 females and 13 males; age range 51–86 years) were recruited at the Oasi Research Institute-IRCCS, Troina (Italy). Blood samples were obtained from each participant, as described by Salemi et al. (2018) [20].
Informed consent for inclusion in the study was obtained from all subjects or their legal guardians. The study was carried out in accordance with the Declaration of Helsinki of 1964 and its later amendments, and the Ethics Committee of the Oasi Research Institute–IRCCS, Troina (Italy) approved the protocol on June 3, 2017 (2017/05/31/CE-IRCCS-OASI/9).
RNA extraction for qRT-PCR
RNA extraction by peripheral blood mononuclear cells (PBMCs) and subsequent retro-transcription were performed using the RNeasy Mini Kit and QuantiTect Reverse Transcription Kit (Qiagen Sciences, Germantown, USA), as previously described [15]. For mRNA extraction, each whole blood sample (approximately 8 ml) was processed within 2 h of collection and the mRNA was stored at –80°C. Two whole blood samples were processed for each patient.
The quantification of RNA was performed using the Nanodrop ND-1000 spectrophotometer (NanoDrop Technologies). The tracks of genomic DNA were removed using the QuantiTect Reverse Transcription Kit (Qiagen, Germany), with the thermocycler program: 2′ at 42°C with gDNA wipeout buffer. Complementary DNA (cDNA) synthesis was carried out using 100 ng of RNA and the QuantiTect Reverse Transcription Kit (Qiagen Sciences, Germantown, USA), thermocycler program: 15′ at 42°C and 3′ at 95°C.
RNA extraction for RNA sequencing
PBMC separation was performed using Ficoll-Paque (Ficoll Plaque PLUS – GE Healthcare Life Sciences, Piscataway, USA) and the RNA was extracted using the TRIzol reagent (TRIzol Reagent, Invitrogen Life Technologies, Carlsbad, CA, USA), according to the instructions provided by the manufacturer. For mRNA extraction, each whole blood sample (approximately 10 ml) was processed within 2 h of collection and the mRNA was stored at –80°C. One whole blood sample was processed for each patient.
qRT-PCR
In a total volume of 25 µl, the qRT-PCR experiments were performed using the Light Cycler 480 instrument (Roche Diagnostics; Mannheim, Germany). The mitochondrial subunits target gene assays (assay ID ATP6 Hs02596862_g1; assay ID ATP8 Hs02596863_g1; assay ID CO1 Hs02596864_g1; assay ID CO2 Hs02596865_g1; assay ID CO3 Hs02596866_g1; assay ID ND1 Hs02596873_s1; assay ID ND2 Hs02596874_g1; assay ID ND3 Hs02596875_s1; assay ID ND4 Hs02596876_g1; assay ID ND5 Hs02596878_g1; assay ID ND6 Hs02596879_g1) [21] and the glyceraldehyde-3-phosphate dehydrogenase (GAPDH) reference gene assay (assay IDHs99999905_m1) were obtained from Applied Biosystems (Carlsbad, CA, USA).
The thermal cycling conditions consisted of one cycle of 2 min at 50°C (Uracil-DNA glycosylases incubation), one cycle of 15 min at 95°C (enzyme activation) and 42 cycles of 15 s at 94°C, followed by 1 min at 60°C (PCR). The QuantiTect Probe PCR Kit (Qiagen Sciences, Germantown, USA) was used.
The amplified cDNA was quantified using the threshold cycle (Ct) method and the relative quantification analysis data were generated using the comparative 2–ΔCt method: each cDNA from PD subjects was coupled with the cDNA from NC. The Light Cycler 1.5 software package supplied with the Light Cycler 480 was used to analyze the relative quantification.
Statistical analysis for qRT-PCR
Distribution analysis of mitochondrial subunit levels was performed using the Shapiro-Wilk test, whereas the inferential statistical analysis was carried out using the Wilcoxon rank-sum test and bivariate linear regression analysis. Graph Pad Prism 5 software was used for statistical analysis. We considered a p-value < 0.05 as statistically significant.
RNA sequencing and data analysis
In each sample, the RNA concentration was assayed with a ND-1000 spectrophotometer (NanoDrop) and its quality assessed with the TapeStation 4200 (Agilent Technologies). Indexed libraries were prepared from 1 µg/ea purified RNA with TruSeq Stranded Total RNA (Illumina) Library Prep Kit, according to the manufacturer’s instructions. Libraries were quantified using the Agilent 2100 Bioanalyzer (Agilent Technologies) and pooled such that each index-tagged sample was present in equimolar amounts, with a final concentration of the pooled samples of 2 nM. The pooled samples were subjected to cluster generation and sequencing using an Illumina NextSeq 500 System (Illumina) in a 2x75 paired-end format. The raw sequence files generated (fastq files) underwent quality control analysis using FastQC (https://www.bioinformatics.babraham.ac.uk/projects/fastqc/). Subsequently, the quality checked reads were trimmed with cutadapt v.1.10 and then aligned to the human genome (hg38 assembly) using STAR v.2.5.2 [15], with standard parameters. The read-count for the genes of interest was computed using featureCounts [22] and normalized, considering all genes expressed in the samples, using DESeq2 [23]. RNA sequencing was performed by Genomix4Life srl (Baronissi, Italy). Raw RNA sequencing data are available in the NCBI SRA database (http://www.ncbi.nlm.nih.gov/bioproject/680218) with Accession Number PRJNA680218.
Results
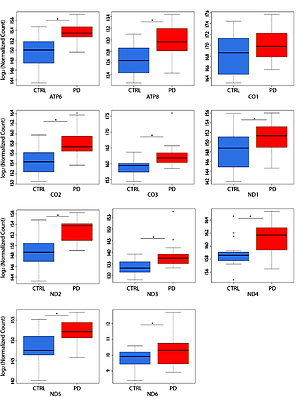
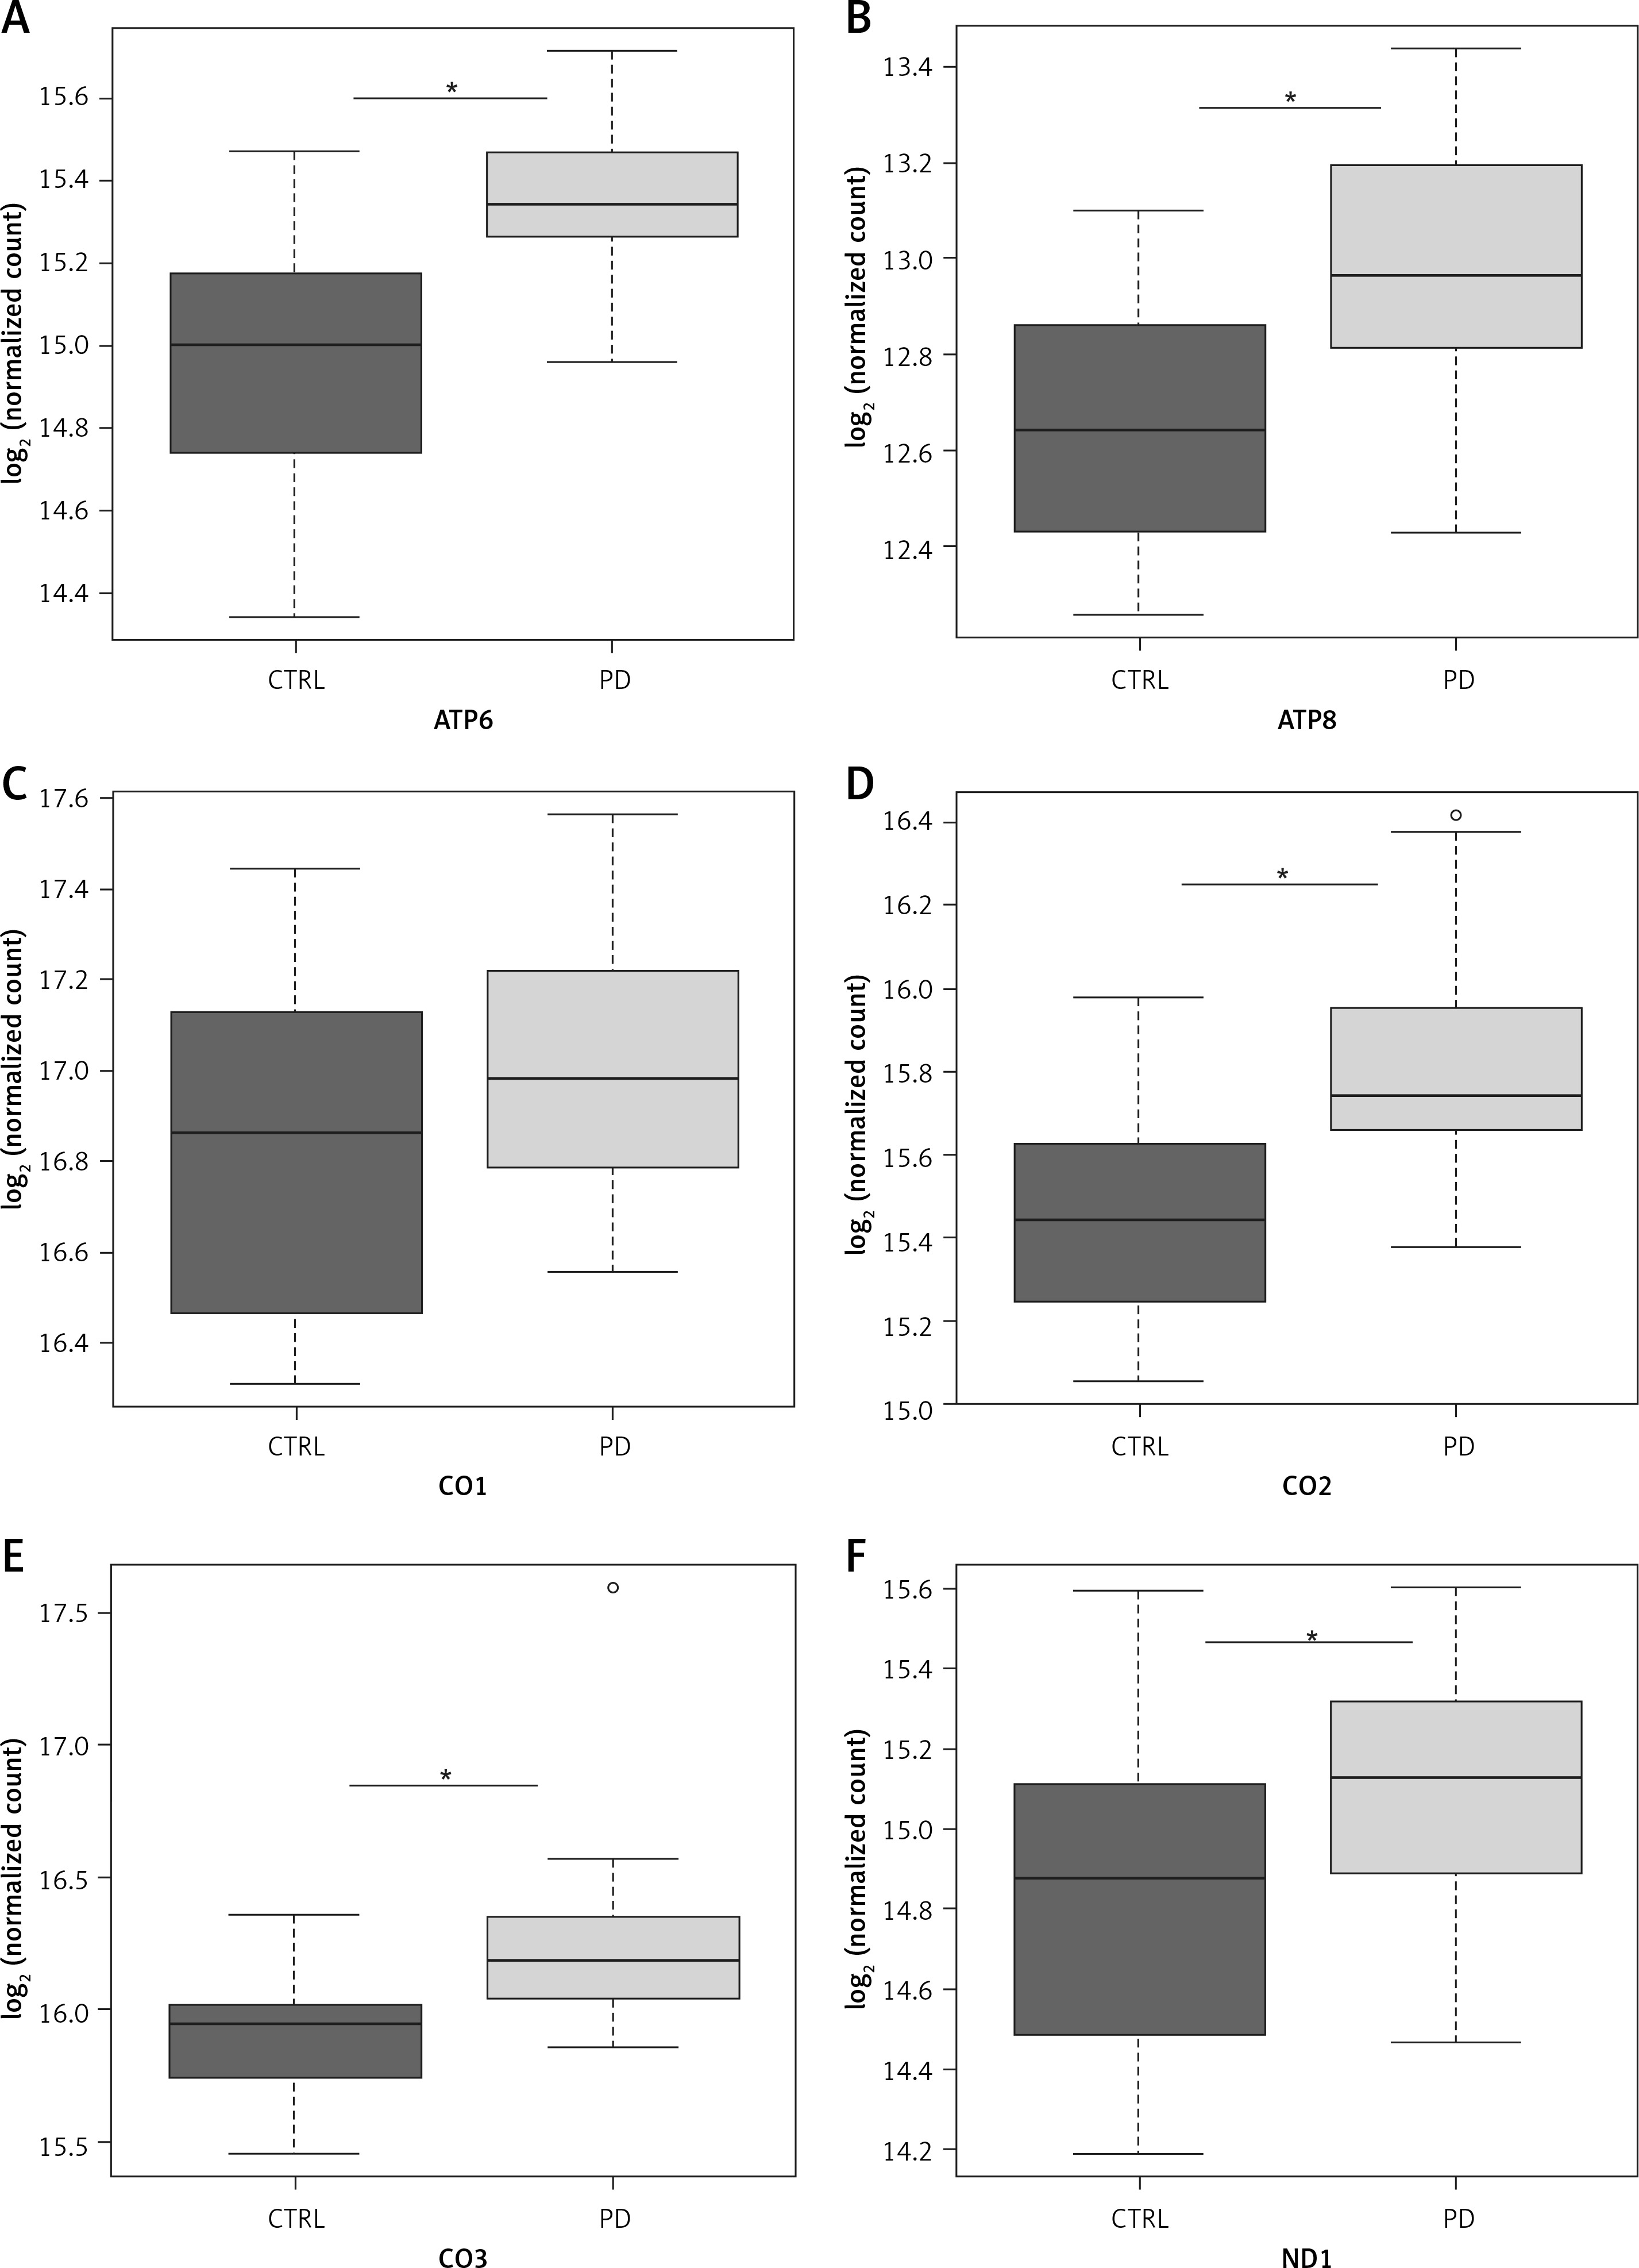
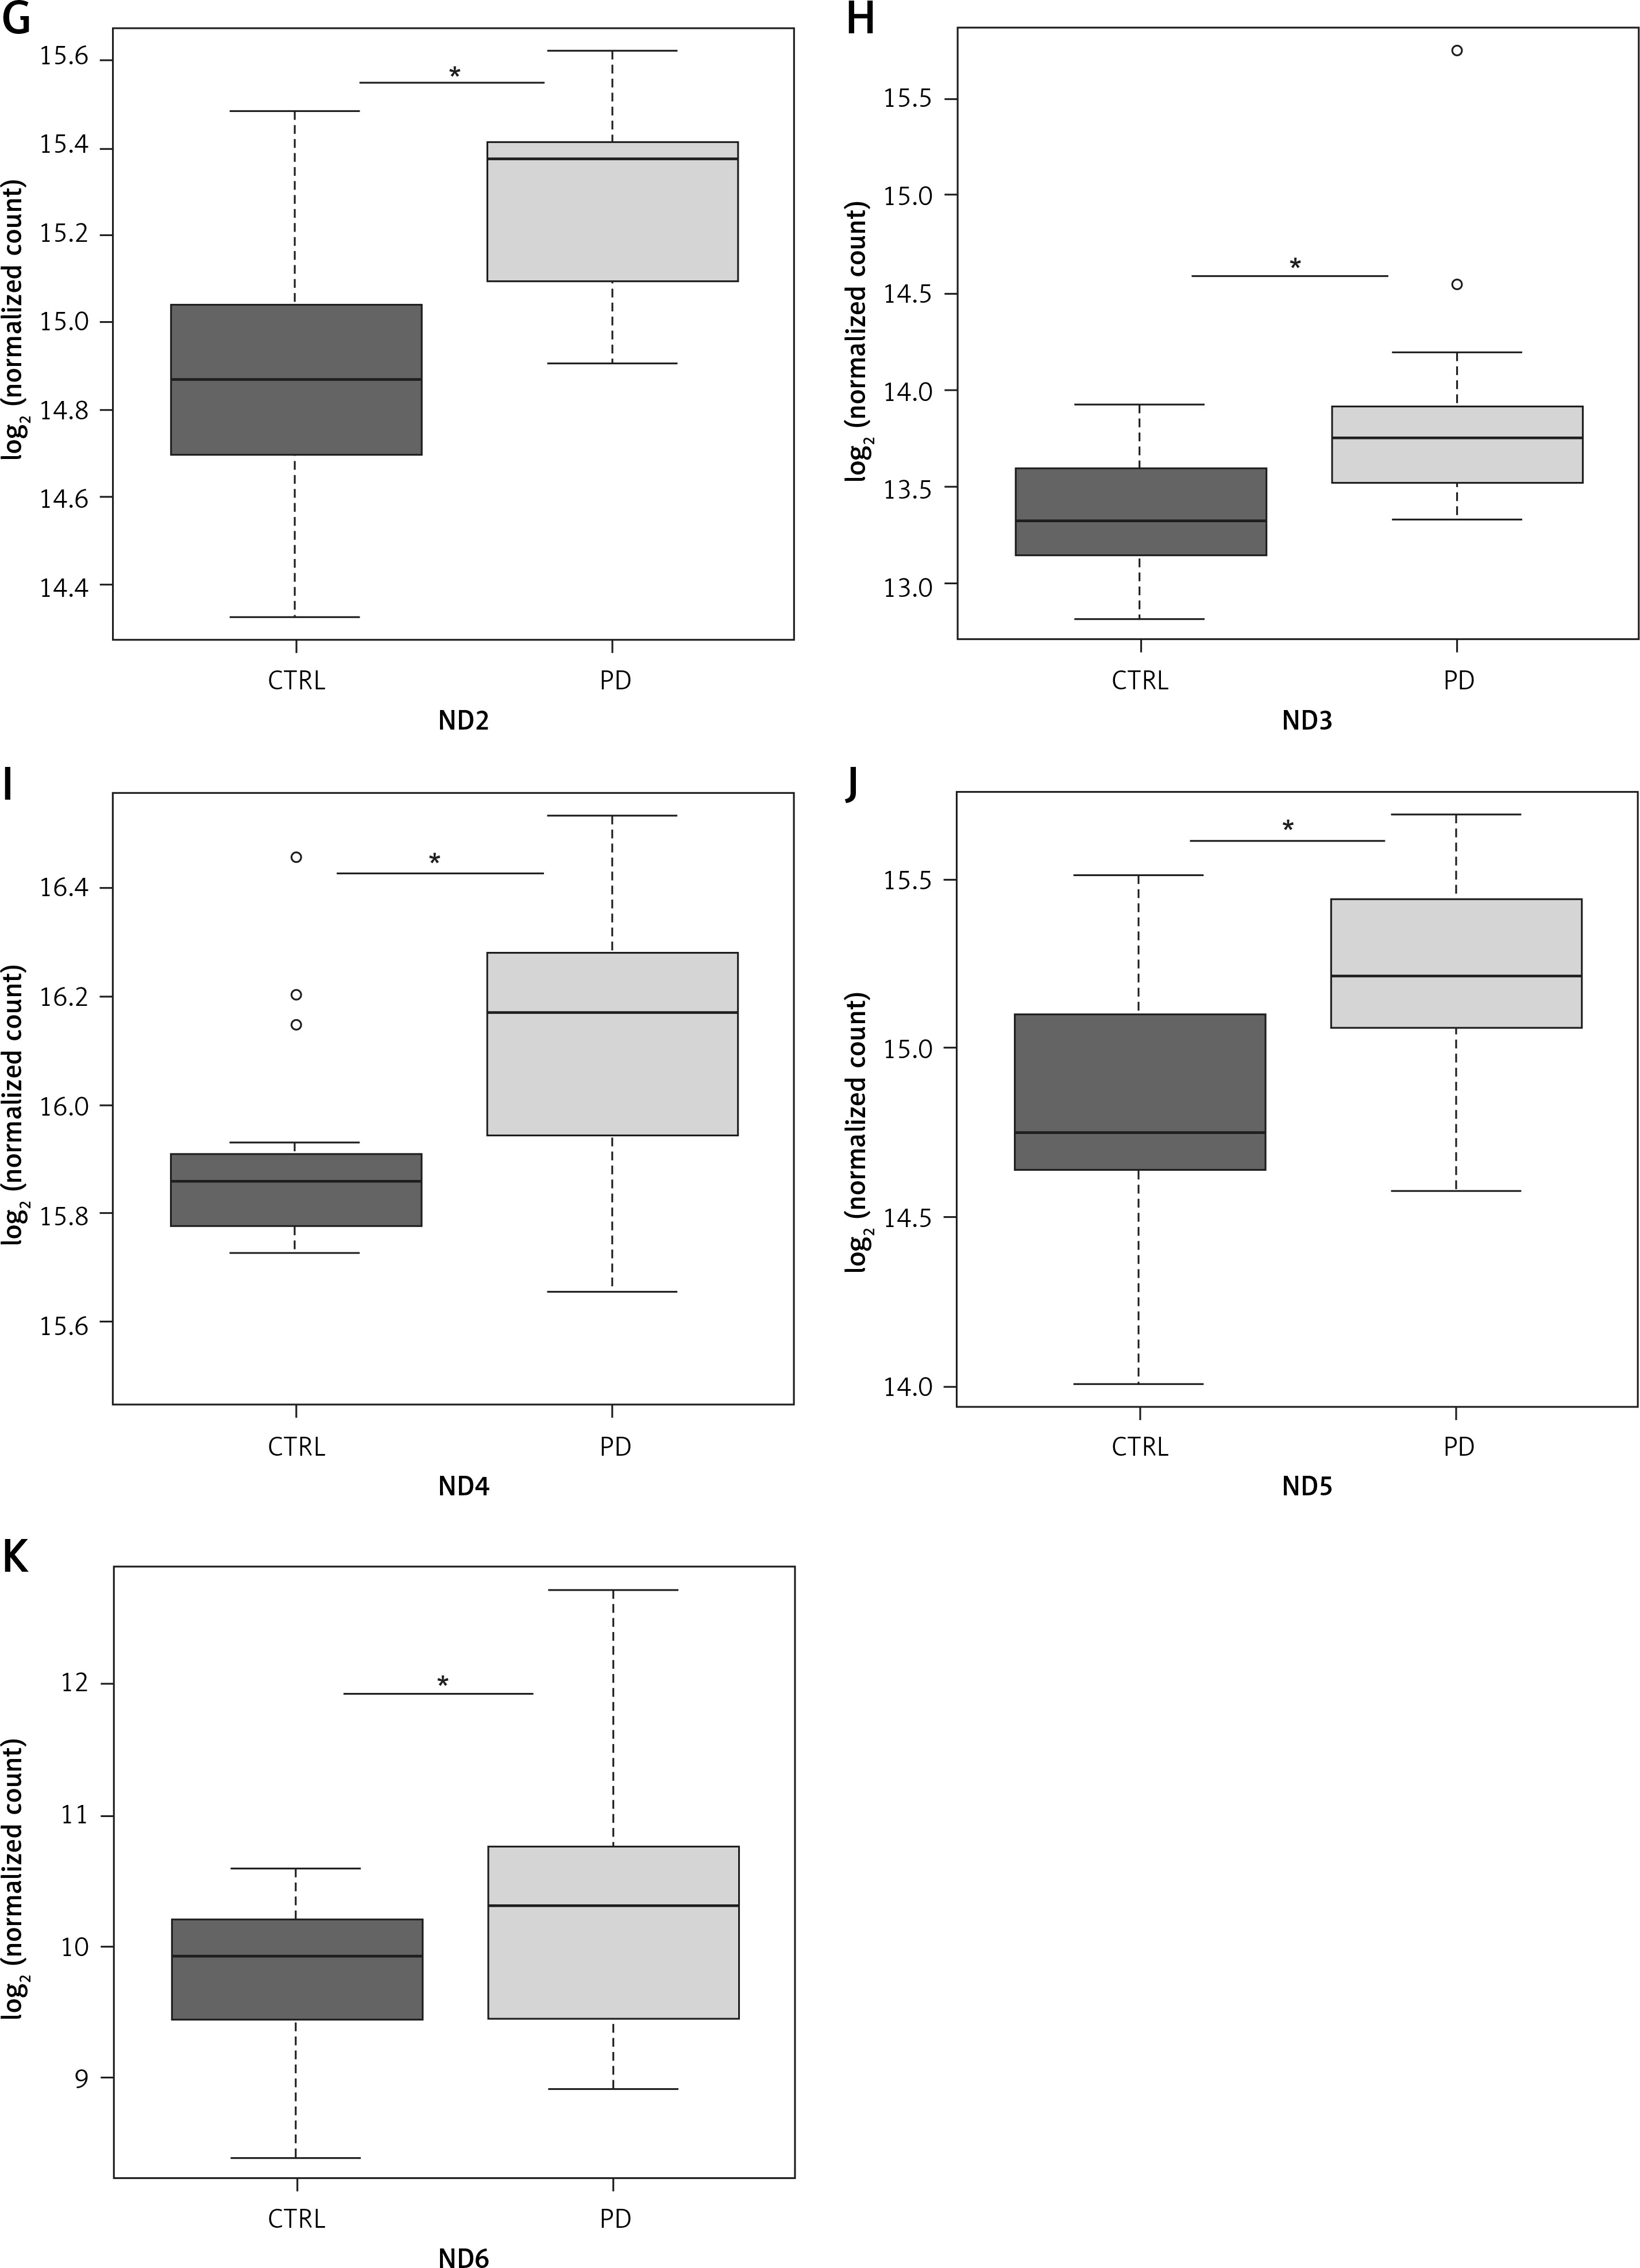
NGS transcriptome analysis showed that the mitochondrial subunits MT-ATP6, MT-ATP8, MT-CO1, MT-CO2, MT-CO3, MT-ND1, MT-ND2, MT-ND3, MT-ND4, MT-ND5, and MT-ND6 were all upregulated in PD patients compared with NC (Figure 1). Except for the MT-CO1 (p = 0.07), all the other subunits were compared with NC with a p <0.03 and, in particular, a p ≤ 0.01 was obtained for these subunits (Table II).
Table II
Difference of expression, along with p value in normal controls and patients with Parkinson disease (PD)
Figure 1
Box plots showing normalized expression values between the 15 samples of normal controls and 21 samples of PD patients, for each selected gene. *p < 0.03. Box plot of the distribution count for each sample. The frequency distribution, mean, median, and outliers are also presented. log2 normalized counts
QRT-PCR analysis confirmed the NGS data. Accordingly, the mean expression of all mitochondrial subunits had an expression level of at least 7 times compared with NC (Figure 2). Statistical analysis showed a significant difference between PD and NC (p < 0.05) for all mitochondrial subunits, whereas no significant difference was found by analyzing subgroups by sex (p > 0.05).
Figure 2
mRNA mitochondrial expression in 43 patients with Parkinson’s disease and 43 normal controls (not included in the figure with value 1). Data were obtained by qRT-PCR, elaborated media mRNA levels by comparative ΔΔCt method are shown
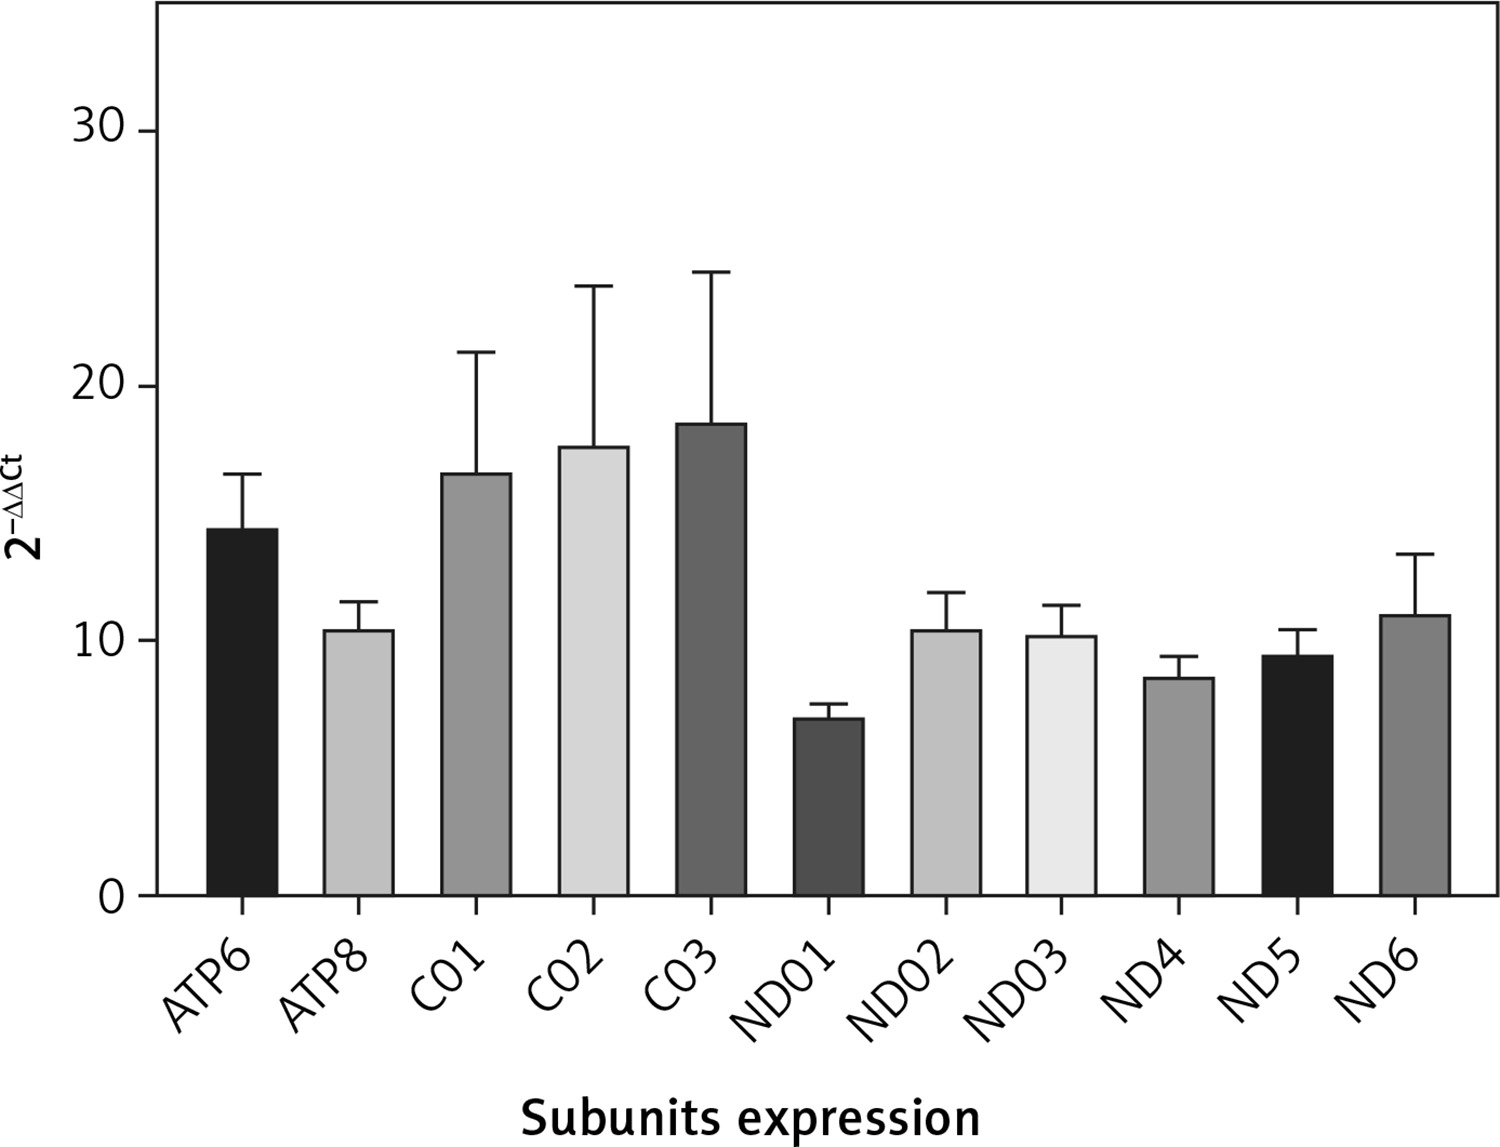
To summarize, the results confirmed the data obtained by NGS analysis, and differences in values may reflect the methodological differences.
Discussion
The main finding of this study is an overall increase in mitochondrial gene expression in PD patients compared to NC. Given that all the mitochondrial subunits were found to be up-regulated, it is likely that mitochondrial complexes to which they belong might be considered to be impaired as well, probably suggesting a compensatory mechanism secondary to a deficient mitochondrial quantity or dynamics.
Mitochondria play a number of pivotal roles in respiratory functions and bioenergetics of the cell through several biochemical processes, such as the Krebs cycle and oxidative phosphorylation (OXPHOS) [24–26]. In this scenario, mitochondria continuously modulate their structure and functioning in response to the stimuli that the cell receives, the so-called “mitochondrial dynamics”, in order to maintain proper cellular homeostasis. A reduction or lack of nutrients exposes mitochondria to elongation (fusion) in the attempt to increase the OXPHOS activity [25, 26], whereas an excess of nutrients induces mitochondrial fragmentation (fission) [24].
Mitochondrial dynamics also allows the compliance of mitochondrial activity with some physiological demands, such as Ca2+ homeostasis, ATP production, and regulation of ROS production [27]. Moreover, a selective autophagosomal process of mitochondrial degradation (mitophagy) to ensure quality control and cellular homeostasis [28] removes damaged mitochondria. Thus, a dysfunction of mitochondrial dynamics or mitophagy is a key factor involved in the pathogenesis of different types of cancers, metabolic diseases, and neurodegenerative disorders [29, 30].
In PD, the impairment of mitochondrial dynamics exposes neuronal cells to a greater susceptibility to oxidative stress, eventually leading to mitochondrial fragmentation and fusion [31]. Mitochondrial fusion compensates the functions of mitochondria through elongated tubules that facilitate the spread of various molecules throughout the mitochondrial compartments. Therefore, mitochondrial fusion is of crucial importance to avoid accumulation of damaged mitochondria, although excessive fusion of mitochondria inhibits the segregation and removal of damaged mitochondria themselves. Moreover, altered fusion inhibits the respiratory function in mitochondria, which, in turn, triggers excessive ROS production and leads to defective mitochondrial transports in dendrites or axons, with subsequent ATP deficiency in peripheral sites [32–37].
Taken together, these considerations might explain the over-expression of mitochondrial mRNA subunits we observed in PD patients, possibly acting as a compensatory mechanism triggered by the alteration of mitochondrial structure and function. Conversely, the reduced expression of mitochondrial mRNA in dementia with Lewy bodies [38] suggests that the molecular mechanisms affecting mitochondrial structure and functioning may differ between PD and atypical parkinsonisms also at the subcellular level.
Environmental and food-related factors certainly correlate with the reduced risk for PD, including caffeine intake, and can positively affect the integrity of mtDNA by favoring a milder course of PD [39]. There is also evidence on how mitochondrial dysfunctions can affect neurodegenerative diseases other than PD, such as AD [40, 41]. These neurodegenerative conditions indeed show some similarities in the impairment of enzyme activities of complex I (to which the subunits MT-ND1, MT-ND2, MT-ND3, MT-ND4, MT-ND5 and MT-ND6 belong) and complex IV (to which the subunits MT-CO1, MT-CO2, MT-CO3 belong) at the level of the frontal cortex, substantia nigra, and cerebellum. These brain regions are all involved in patients with cognitive decline and in both motor and non-motor-related impairment of different neurotransmission systems [42]. In particular, complex I dysfunction seems to be critical in PD pathogenesis, because it correlates with the degeneration of dopaminergic neurons in the SNPC [43, 44].
The main limitation of this study is that the analysis of expression levels was performed on mRNA obtained from PBMCs. Given that neurons and blood cells have different environment and energetic demands, caution is needed when translating the results from blood cells to neurons. However, we cannot exclude that the mechanisms highlighted in PBMCs are not activated also in the brain (dopaminergic neurons) of the same subjects. In fact, as in other neurodegenerative diseases, a neurological impairment might be the result of a lack or a partial turnover of neurons.
In conclusion, our data showed overexpression of the mRNA mitochondrial subunits in PD patients, suggesting an alteration of the mitochondrial structure or the presence of compensatory mechanisms that would preserve the cell from programmed death (e.g. apoptosis due to the accumulation of ROS). The study of specific mRNA by PBMCs will provide further diagnostic frames for the early detection of PD patients. Future studies, also including patients with early-onset PD, are needed to validate this hypothesis and to expand the present findings to atypical parkinsonisms and other neurodegenerative diseases.