Introduction
Membranous nephropathy (MN), as a glomerular disease characterized by the diffuse deposition of immune complexes including IgG, beneath the renal glomerular epithelium, is one of the leading causes of adult non-diabetic nephrotic syndrome [1]. MN can occur in individuals of any gender, age, and race, with an estimated incidence rate of approximately 8–10 cases per million [2]. In China, the incidence of MN has nearly doubled, from 10.4% in 2003–2006 to 24.1% in 2011–2014 [3]. It is estimated that about one-third of patients with MN may experience spontaneous remission without treatment, while the remaining patients, despite a slower disease progression rate with effective symptomatic treatment, still have a 30% to 40% risk of progressing to end-stage renal disease within 5 to 15 years after onset, requiring life-sustaining measures such as hemodialysis or kidney transplantation, and ultimately even leading to death [4].
In recent decades, significant breakthroughs have been made in the understanding of MN pathogenesis. Studies have demonstrated that abnormal immunological reactions may play a critical role in its progression, with immune cells serving as the primary players in immune responses, highlighting their significance [5]. For example, there is substantial evidence linking regulatory T cells (Tregs) to MN: MN patients exhibit reduced Treg proportions, decreased expression of Foxp3 (a marker of Tregs) [6], and impaired activation and suppression of Tregs [7]. In fact, immunosuppressive therapy has become an important treatment approach for MN, involving the use of glucocorticoids, cytotoxic drugs (such as cyclophosphamide and chlorambucil), and calcineurin inhibitors (including cyclosporine and tacrolimus) to suppress the immune system [8], alleviate symptoms, and restore renal structure and function. For instance, B cell abnormalities may be associated with MN, and studies have found that rituximab, through B cell depletion, can induce and sustain complete or partial remission of proteinuria in MN patients [9]. Targeted Treg therapy is also being investigated and holds great promise for future development [10]. However, although increasing research suggests a potential link between immune cell abnormalities and the occurrence and progression of MN, our understanding of the underlying mechanisms is still in its early stages.
Mendelian randomization (MR) is a statistical method used to assess causal relationships between observed modifiable exposures or risk factors and clinically relevant outcome factors [11]. MR utilizes genetic variations strongly associated with the exposure factor as instrumental variables. Due to the random allocation of alleles during gamete formation [12], MR is less susceptible to common confounding factors than traditional statistical methods and provides a reasonable causal temporal sequence [13]. In recent years, MR has been frequently used to investigate potential connections between immune cells and various common diseases. If the causal relationship between immune cells and MN can be sufficiently demonstrated through MR, it would have important implications for prevention and treatment strategies in the clinical management of membranous nephropathy.
Material and methods
Data sources
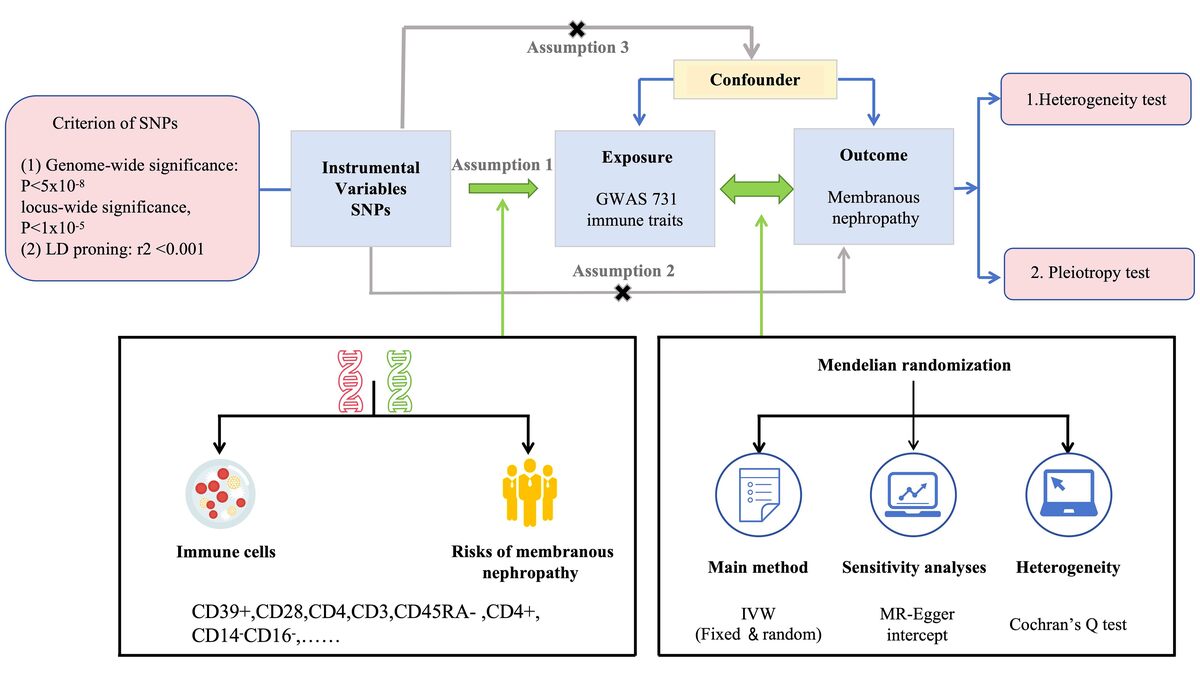
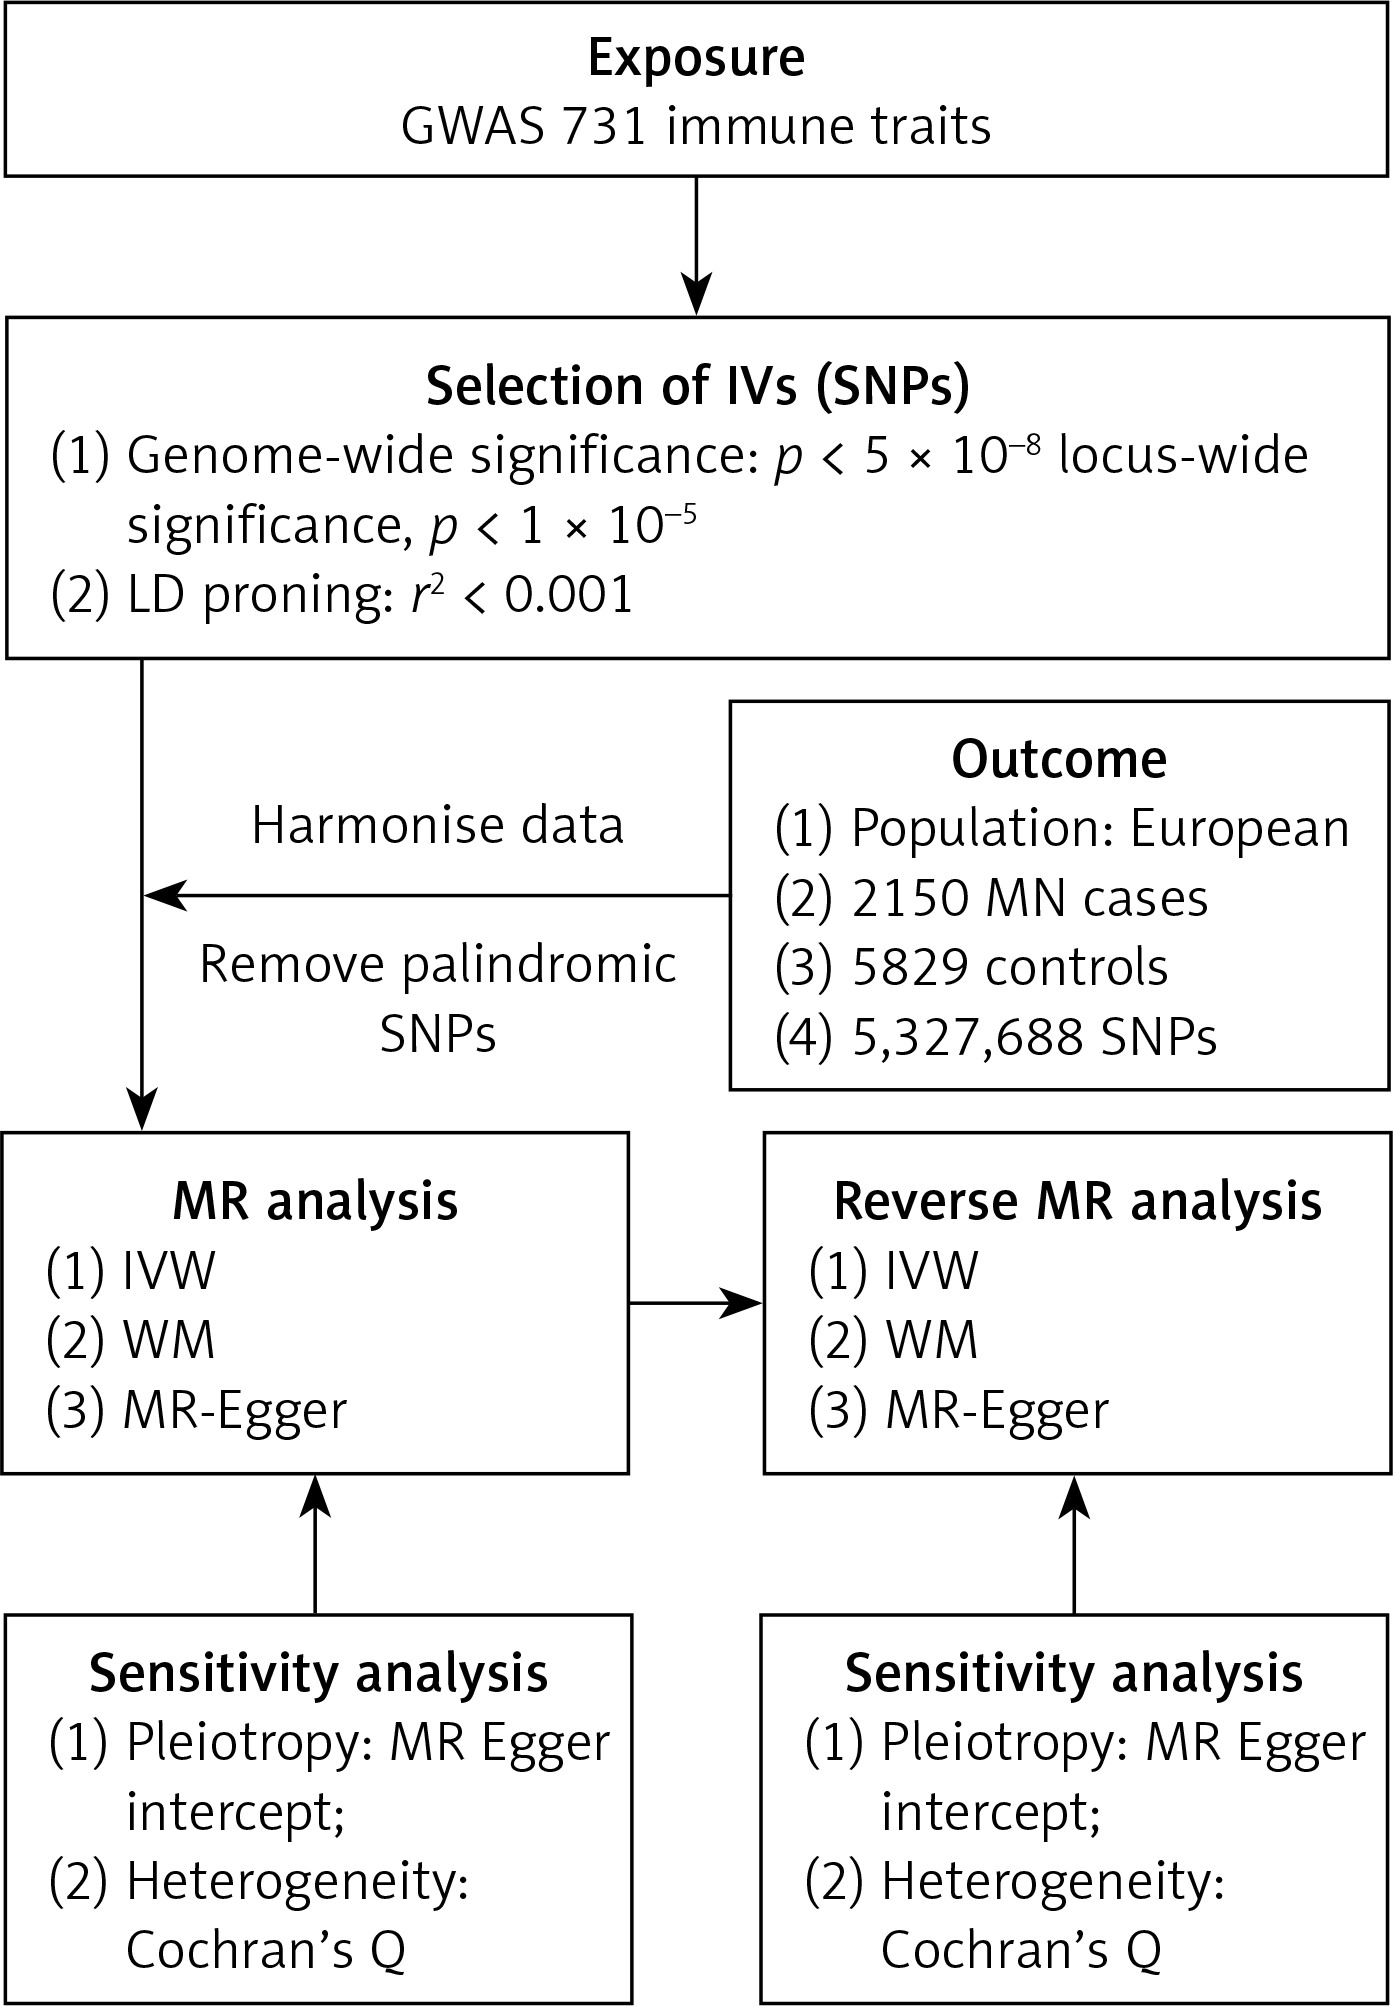
This study employed summary statistics derived from previous genome-wide association studies (GWAS) conducted on immune traits [14]. Due to the nature of the data used, neither ethical approval nor participant consent was deemed necessary. The comprehensive investigation encompassed a wide range of 731 immunophenotypes, comprising absolute cell counts, median fluorescence intensities, morphological parameters, and relative cell counts. To ensure the robustness of the analysis, rigorous adjustments were performed, taking into account important factors such as age and sex, and assessing their correlations. To minimize potential bias arising from population stratification, only individuals of European descent were included in the study [14]. The genetic summary statistics specific to MN were derived from a GWAS conducted on cases and controls of European ancestry. A total of 2150 cases of primary MN were detected by renal biopsy, eliminating suspected cases caused by autoimmune diseases, medications, infections, or malignant tumors. The control group in the German chronic kidney disease (CKD) cohort consists of 5,829 individuals who do not have MN [15]. The study design, including the key components and procedures, is visually depicted in Figure 1, providing a clear overview of the study’s structure and methods. Summary data of MN are publicly available in the IEU Open GWAS database (https://gwas.mrcieu.ac.uk/). The information of data sources is illustrated in Table I.
Table I
Details of the datasets used in our MR study
| Exposure or outcome | Sample size | Ancestry | Link | PMID |
|---|---|---|---|---|
| Genetic variation for immune phenotypes | 14,082 participants | European ancestry | https://gwas.mrcieu.ac.uk/datasets/ (GCST90001391 to GCST90002121) | 32929287 |
| Membranous nephropathy | 7979 participants | European ancestry | https://gwas.mrcieu.ac.uk/datasets/ebi-a-GCST010005/ | 32231244 |
Instrumental variables (IV)
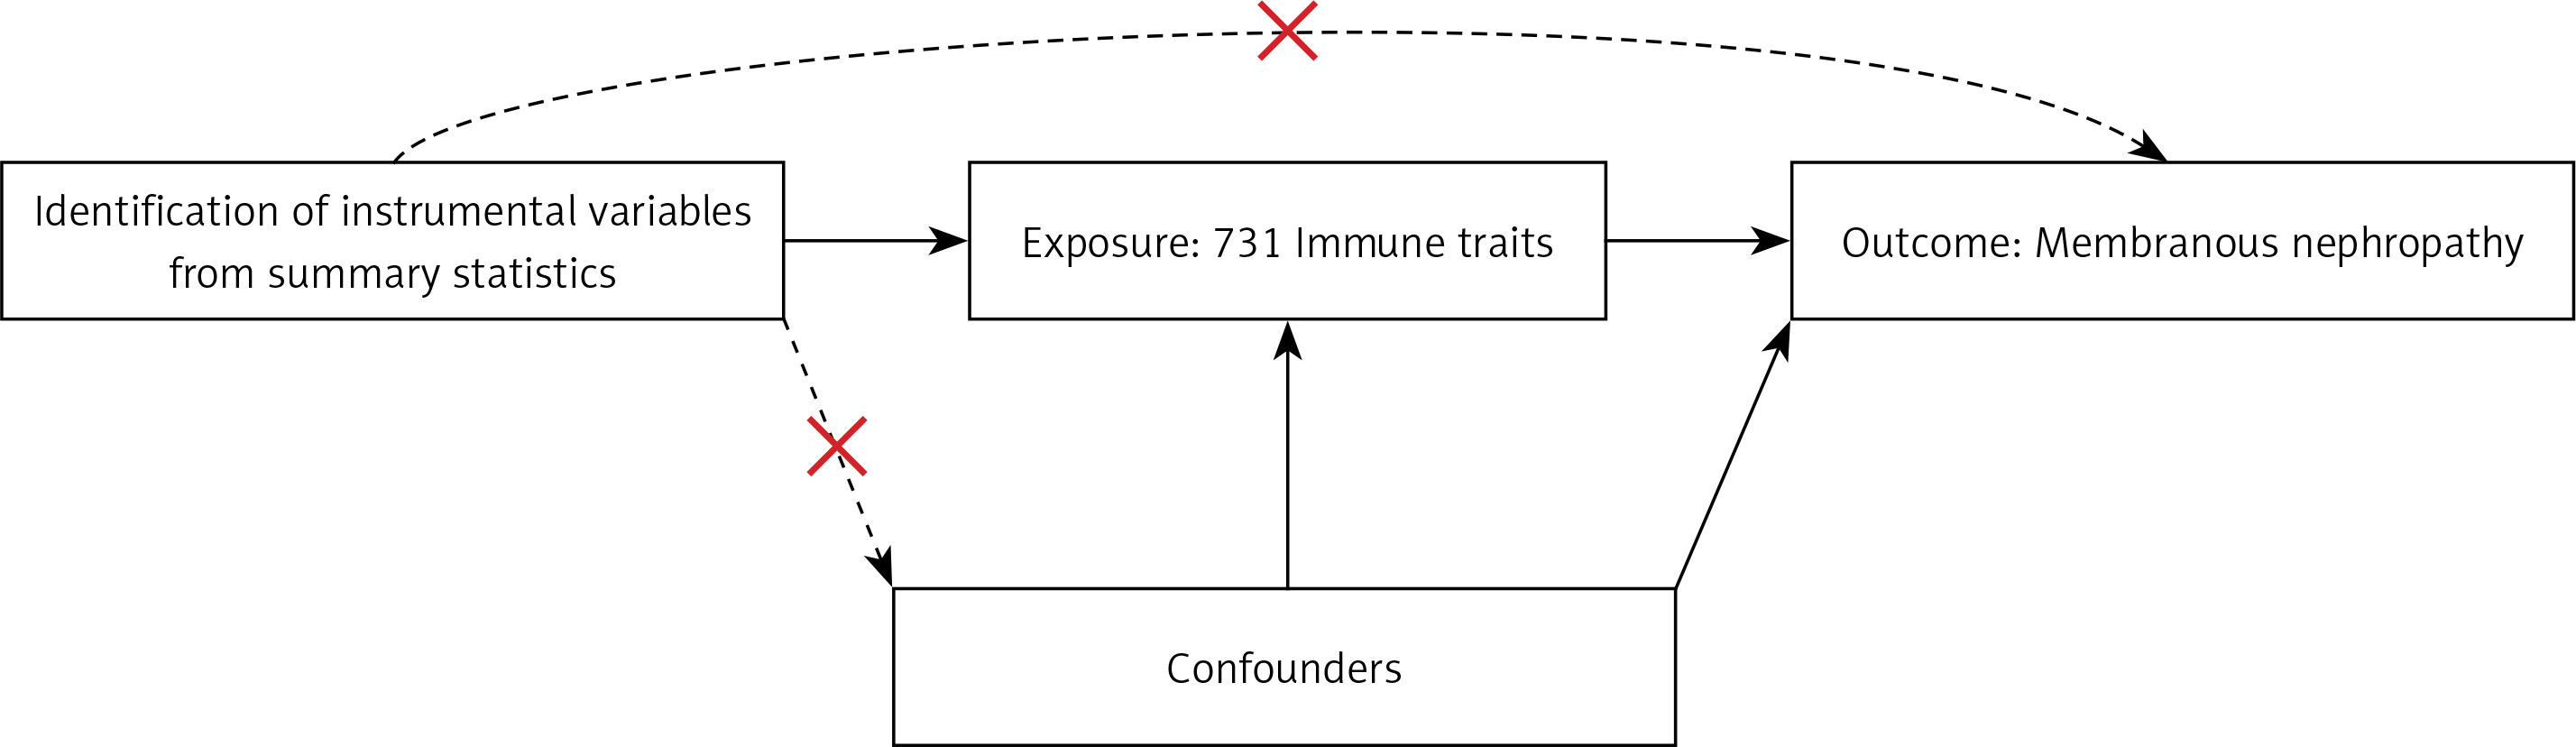
In this study, we used MR with genetic variants serving as IVs to evaluate the causal relationship. The validity of causal inference depends on three critical assumptions: 1) a strong association between genetic variants and the exposure; 2) the independence of genetic variants from confounding factors; and 3) genetic variants not influencing the outcome through pathways other than the exposure [16, 17]. Details are shown in Figure 2.
We carefully selected and analyzed IVs for immunological characteristics, using a 1 × 10⁻⁵ significance level and strict criteria for independent loci. To select IVs for membranous nephropathy, an even stricter significance level of 5 × 10⁻⁸ was applied. To ensure the independence of loci, a clumping window of 10,000 kb and a linkage disequilibrium (LD) threshold of r2 < 0.001 were employed. When specific SNPs are missing in the outcome dataset, proxy SNPs in linkage disequilibrium can be used. To guarantee their eligibility as instrumental variables, the r2 value is adjusted to 0.8, indicating a significant association with the target SNPs. Palindromic SNPs, which have A/T or G/C alleles, may introduce ambiguity in determining the effect allele in exposure and outcome GWAS. To ensure reliability of the reference strand, palindromic SNPs with effect allele frequencies between 0.3 and 0.7 are excluded [18]. Additionally, the variance explained by each SNP is calculated [19]. To eliminate weak instrumental bias, the strength of each IV was measured using F statistics (β2/SE2) [20]. After excluding IVs with low F statistics (< 10), four IVs were retained for subsequent analysis in the reverse MR analysis.
Statistical analysis
The inverse variance-weighted (IVW) method was chosen as the primary analytical approach for providing the causal effect estimate between immune cells and MN. The random-effects inverse variance-weighted method provides a robust and unbiased estimate by considering heterogeneity among studies and appropriately weighting the effects based on accuracy [18]. A p-value < 0.01 was considered statistically significant in the IVW analysis. The weighted median provides a robust estimate that is less sensitive to extreme values or outliers by giving higher weights to more reliable or precise observations. Even if single nucleotide polymorphisms (SNPs) violate the second and third assumptions of Mendelian randomization, the MR-Egger method can analyze the causal effect without bias [18]. MR-Egger intercept provides a test for horizontal pleiotropy in Mendelian randomization analysis by assessing the presence of bias due to pleiotropic effects and providing an estimate of the average pleiotropic effect [21, 22]. The heterogeneity test in Mendelian randomization relies on Cochran’s Q statistic, which assesses the presence of significant differences among treatment groups, indicating whether there is heterogeneity in the treatment effects [23].
Furthermore, reverse MR analysis was selectively used to establish the association between MN and immune traits. The reverse MR analysis was carried out only under the assumption that IVW methods provide support for the association between immune cells and MN. All MR analyses were performed using R (version 4.3.0) with the “TwoSampleMR” package (version 0.5.7), ensuring consistency and reliability in the analytical process.
Results
Causal effect of immunophenotypes on MN
The F-statistics of SNPs for 731 immune cell signatures ranged from 19.55 to 2381.77, showing that there was negligible weak instrument bias.
Detailed information on SNPs for each trait is contained in Supplementary Tables SI and SII. The MR results for all traits and their association with MN risk using the IVW method are presented in Supplementary Table SIII. Although most immune cells did not show significant correlations with MN, the IVW technique showed eight immunophenotypes associated with MN risk, as depicted in Figure 3 and described in detail in Supplementary Table SIV.
Figure 3
Forest plot: associations of genetically determined immune traits with membranous nephropathy risk
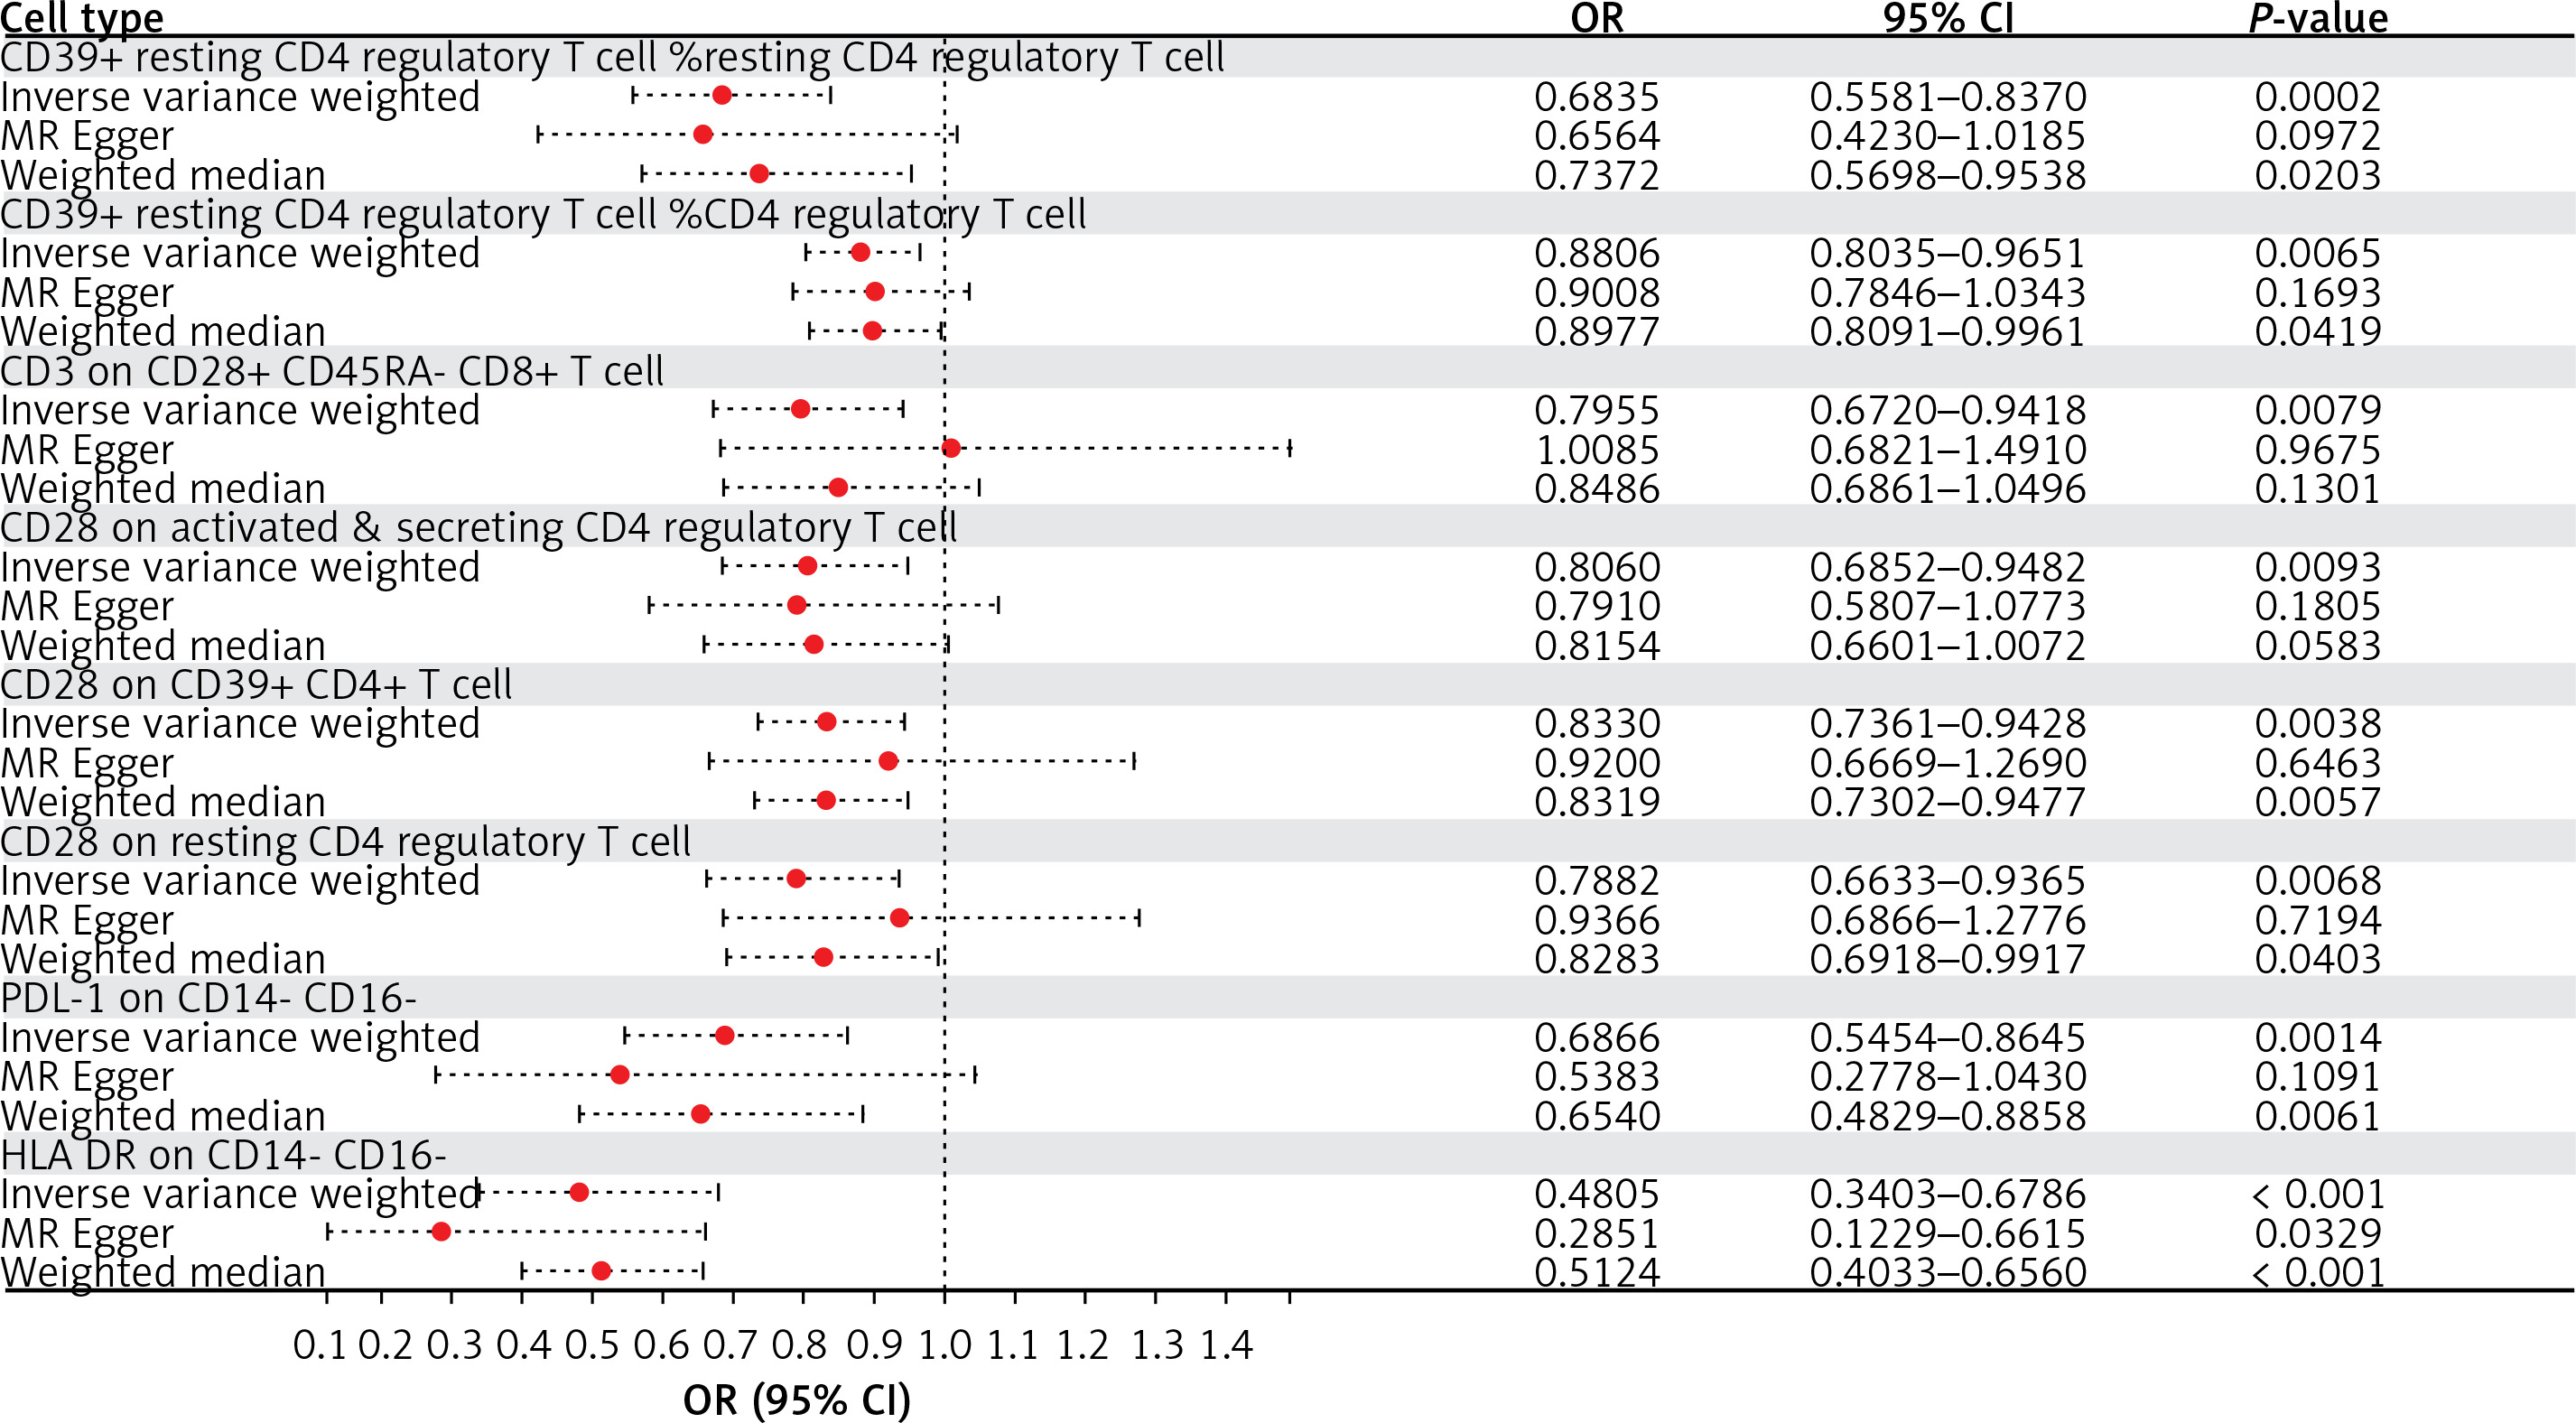
Employing the IVW method, a negative correlation emerged between genetically predicted CD39+ resting CD4 regulatory T cell %resting CD4 regulatory T cell and MN risk (OR = 0.6835, 95% CI: 0.5581–0.8370, p = 0.0002). MR-Egger analyses detected no directional pleiotropic effects. Despite these findings, both MR-Egger and weighted median analyses failed to establish a causal link between CD39+ resting CD4 regulatory T cell %resting CD4 regulatory T cell and MN risk (Supplementary Table SIV). Similarly, CD39+ resting CD4 regulatory T cell %CD4 regulatory T cell exhibited a negative association with MN using the IVW method (OR = 0.8806; 95% CI: 0.8035–0.9651, p = 0.0065). MR-Egger analyses revealed no horizontal pleiotropy, yet both MR-Egger and weighted median analyses did not substantiate a causal link between CD39+ resting CD4 regulatory T cell %CD4 regulatory T cell and MN (Supplementary Table SIV).
IVW analysis revealed a negative correlation between CD3 on CD28+ CD45RA- CD8+ T cell (OR = 0.7955, 95% CI: 0.6720–0.9418, p = 0.0079) and MN, and the same was observed for CD28 on activated & secreting CD4 regulatory T cells (OR = 0.8060, 95% CI: 0.6852–0.9482, p = 0.0093) and CD28 on resting CD4 regulatory T cells (OR = 0.7882, 95% CI: 0.6633–0.9365, p = 0.0068). Intercept of MR-Egger analyses revealed no horizontal pleiotropy, but neither MR-Egger nor weighted median analyses substantiated a latent link (Supplementary Table SIV).
Additionally, the IVW analysis results for CD28 on CD39+ CD4+ T cell (OR = 0.8330, 95% CI: 0.7361–0.9428, p = 0.0038), PDL-1 on CD14- CD16- (OR = 0.6866, 95% CI: 0.5454–0.8645, p = 0.0014) and HLA DR on CD14- CD16- (OR = 0.4805, 95% CI: 0.3403–0.6786, p < 0.0001) also consistently indicate a negative correlation with MN. The results of the weighted median analysis were also consistent with those of the IVW method. MR-Egger investigations found no horizontal pleiotropy (Supplementary Table SIV).
In summary, based on the IVW analysis results, we conclude that the eight immunophenotypes mentioned all consistently exert a protective effect against MN risk. Furthermore, there was little evidence of directional pleiotropy or outliers in MR-Egger analyses, further confirming the robustness of the results. Regarding the results of the horizontal pleiotropy analysis of all immune cell levels, see Supplementary Table SV for details. Supplementary Table SVI demonstrates no significant heterogeneity among instrumental variables for immune traits, except for HLA DR on CD14- CD16-.
Results of reverse MR analysis
Reverse MR analyses were conducted to explore potential associations between MN and the eight immunophenotypes. Using the IVW method, no statistically significant associations were observed: CD39+ resting CD4 regulatory T cell %resting CD4 regulatory T cell (OR = 0.9969; 95% CI: 0.9539, 1.0419; p = 0.8915), CD39+ resting CD4 regulatory T cell %CD4 regulatory T cell (OR = 1.0136; 95% CI: 0.9456, 1.0864; p = 0.7037), CD3 on CD28+ CD45RA- CD8+ T cell (OR = 0.9978; 95% CI: 0.9543, 1.0432; p = 0.9216), CD28 on activated & secreting CD4 regulatory T cell (OR = 0.9941; 95% CI: 0.9517, 1.0384; p = 0.7894), CD28 on CD39+ CD4+ T cell (OR = 0.9967; 95% CI: 0.9303, 1.0679; p = 0.9259), CD28 on resting CD4 regulatory T cell (OR = 1.0110; 95% CI: 0.9686, 1.0551; p = 0.6174), PDL-1 on CD14- CD16- (OR = 1.0056; 95% CI: 0.9677, 1.0449; p = 0.7770) and HLA DR on CD14- CD16-(OR = 0.8718; 95% CI: 0.6993, 1.0869; p = 0.2227). The sensitivity analyses confirmed the stability of these results, as demonstrated in Supplementary Tables SVII and SVIII.
Discussion
This two-sample MR study identified a total of 8 immunophenotypes which might be significantly negatively associated with the risk of MN: CD39+ resting CD4 regulatory T cell %resting CD4 regulatory T cell, CD39+ resting CD4 regulatory T cell %CD4 regulatory T cell, CD3 on CD28+ CD45RA- CD8+ T cell, CD28 on activated & secreting CD4 regulatory T cell, CD28 on CD39+ CD4+ T cell, CD28 on resting CD4 regulatory T cell, PDL-1 on CD14- CD16-, and HLA DR on CD14- CD16-.
According to previous research, there is a close relationship between Tregs and MN. A substantial body of research indicates that Treg cells are less abundant or have functional abnormalities in renal diseases [10]. Tregs play a role in maintaining tolerance to self-antigens (kidney autoantigens) that contribute to autoimmune kidney diseases, exerting local anti-inflammatory effects in the kidney, and preventing alloreactivity [24]. Research has shown an imbalance between Tregs and Th17 cells in patients with primary membranous nephropathy (PMN). The frequency of Th17 cells and interleukin-17 (IL-17, a Th17-related cytokine) is significantly increased in peripheral blood mononuclear cells (PBMC), while the frequency of Tregs and interleukin-10 (IL-10, a Treg-related cytokine) is significantly decreased [6]. Motavalli et al. found a significant reduction in Tregs in patients with idiopathic membranous nephropathy (IMN) compared to the healthy control group [25], suggesting a potential protective role of Tregs in the kidney and a potential reduction in the incidence of MN.
CD39 is a critical marker of (FOXP3) Tregs and exerts its immunosuppressive effects primarily by promoting the degradation of extracellular nucleotides such as ATP [26]. In vitro and in vivo studies on mice with ENTPD1 deficiency (CD39) have shown impaired suppressive function of Tregs [27]. Experimental evidence suggests that extracellular nucleotides mediate kidney injury, and CD39 expressed by Treg cells and other cells plays a protective role in the kidney [28]. Therefore, the percentage of CD39+ resting CD4 regulatory T cells relative to resting CD4 regulatory T cells, and the percentage of CD39+ resting CD4 regulatory T cells relative to total CD4 regulatory T cells, may inhibit renal inflammatory responses and alleviate kidney damage through the degradation of extracellular nucleotides.
We can find clues about how CD28 on activated and secreting CD4 regulatory T cells, CD28 on CD39+ CD4+ T cells, and CD28 on resting CD4 regulatory T cells might reduce MN risk. CD28 expressed on the surface of Tregs provides essential co-stimulatory signals for Treg activation and differentiation. Upon loss of CD28, Tregs cease proliferation and experience a dramatic reduction in number, and their function declines accordingly [29]. CD28 is primarily expressed on the surface of Tregs and provides crucial co-stimulatory signals for activation and differentiation. Studies have found that the absence of CD28 has a protective effect on primary podocyte-induced kidney injury through the PI3K/Akt signaling pathway [30], suggesting a potential association between increased CD28 expression and renal damage. Another study demonstrated that CD28 deficient (KO) mice were almost completely protected against anti-glomerular basement membrane (GBM) glomerulonephritis (GN) induction [31].
It is challenging to find relevant literature exploring the direct relationship between CD3 on CD28+ CD45RA- CD8+ T cells and MN. T cell adaptive immune responses are first activated through the binding of the T cell receptor (TCR)/CD3 complex to peptide-major histocompatibility complex (pMHC) (Signal 1). This activation is then enhanced by a second “co-stimulatory” signal, such as the binding of the CD28 receptor on T cells to its homologous ligand on target cells (Signal 2) [32]. Studies have shown that patients with chronic kidney disease (CKD) exhibit significantly decreased levels of CD3, CD4, and CD8 T cells, as well as a reduced CD4/CD8 T cell ratio. Kaplan-Meier analysis has demonstrated a significant correlation between low levels of CD3 T cells and renal outcomes in CKD patients [33]. The role of different phenotypes of CD8 T cells in membranous nephropathy and their potential biological mechanisms require further experimental validation.
There is limited literature discussing the exact relationship between programmed death-ligand 1 (PD-L1) and human leukocyte antigen (HLA) on CD14- CD16- immune cells and MN. PD-L1 is an immune checkpoint molecule and a ligand for programmed cell death protein 1 (PD-1), primarily responsible for suppressing immune responses. Liao et al. found that PD-L1 Ig in BXSB and NZB/NZW F1 mice activates the PD-1/PD-L1 axis in CD4+ T cells, leading to Th17 cell inactivation, reduced serum levels of IFN-γ, IL-10, IL-17, and anti-dsDNA antibodies, decreased IgG deposition in the glomeruli, and improved survival [34]. However, Sung et al. observed that PD-L1 exacerbates lupus progression in NZM2328 mice, with blockade of PD-L1 reducing proteinuria and glomerular damage [35]. Thus, the role of PD-L1 in kidney disease remains controversial, and its protective effect in MN patients has not been directly demonstrated. Our findings suggest directions for further research.
HLA-DR belongs to the MHC-II class molecules and is primarily expressed on antigen-presenting cells such as dendritic cells, B cells, and macrophages. HLA-DR is a class II MHC molecule primarily expressed on antigen-presenting cells, such as dendritic cells, B cells, and macrophages, and is responsible for presenting peptides to CD4+ T cells. Numerous studies have indicated both pathogenic and protective HLA associations in autoimmune kidney diseases, including ANCA-associated vasculitis (AAV), membranous nephropathy, and lupus nephritis [36]. Experimental evidence by reported by Ooi et al. confirmed that HLA-DR1 acts as a dominant protective molecule in autoimmune diseases. It can activate Treg cells by presenting the α3135–145 peptide segment, thereby suppressing the autoreactive conventional T cells induced by HLA-DR15 [37].
In fact, there is relatively limited research directly investigating the relationship between immune cells and MN. Instead, available evidence mainly relies on associations between immune cells and autoimmune diseases or other kidney disorders to indirectly support the connection between immune cells and MN. However, the reviewed literature to date has not refuted our conclusion that specific immune cells may potentially be negatively correlated with MN.
Regardless, our study still has some unavoidable limitations. Firstly, GWAS summary databases used in this study lack individual-level data, which limits the ability to perform further stratified analyses based on variables such as age, sex, disease duration, treatment status, and disease subtype, making it difficult to compare causal effects between subgroups. Secondly, the p-value threshold we chose was 1.0 × 10⁻⁵, which is relatively lenient and may lead to some false positives. In traditional research, a more stringent significance level (p < 5 × 10⁻⁸) is generally used to obtain more rigorous results. Thirdly, our data primarily came from databases of European populations. While this reduces bias due to racial differences, it makes it difficult to extrapolate the results to other racial/ethnic groups, limiting the generalizability of the findings. Due to the genetic and immunological differences between different populations, further research is needed to expand upon our findings. Additionally, due to time constraints and current limitations in experimental hardware, we regret that we have not yet designed experiments to assess whether the use of immunosuppressants affects the levels of immune factors and cells (such as IL-6, TNF, IL-17, and Treg cells) in plasma before and after treatment. In the future, we plan to conduct supplementary biological and clinical experiments to analyze the relevance of these immune substances in evaluating disease prognosis and monitoring disease progression.
In conclusion, MN is a complex disease, and the immune system is a vast and intricate system in the human body. Although this study has provided evidence of a potential causal relationship between MN and immune cells through Mendelian randomization, future research is urgently needed to involve more diverse, comprehensive, and in-depth studies. Monitoring changes and trends of immune cells in individual MN patients in clinical settings, assessing their roles in MN progression and prognosis, and further exploring the potential associations and mechanisms between different immune cell types and MN subtypes are crucial for a deeper understanding. Through detailed analysis and research on MN, we can provide directions and references for clinical diagnosis and treatment.