Introduction
During childhood, brown adipose tissue (BAT) dissipates chemical energy to produce heat as a defense against hypothermia and obesity and has an important role in weight determination and musculoskeletal development [1, 2]. Activity of BAT may vary depending on age, gender, adiposity and temperature [3]. It has been shown that volume and activity of BAT especially increases during puberty [4], probably because of the effect of sex steroids and growth hormone [5, 6]. Discovery of presence of BAT in adolescents and adults raised many questions about its physiology, function, possible influence on human health and possible treatment options. The activity of BAT in adults has been associated with body mass index (BMI), body fat mass and glucose metabolism [7]. It has been observed that healthy adults with BAT have lower glucose, total cholesterol (TC) and low-density lipoprotein cholesterol (LDL-C) levels compared to individuals without BAT [7, 8]. Brown adipose tissue volume was significantly associated with increased whole-body lipolysis, triglyceride fatty acid cycling, triglyceride-free fatty acid (FFA) oxidation and adipose tissue insulin sensitivity [9].
Positive regulatory domain containing 16 (PRDM16) protein, a 140 kDa zinc-finger protein, is a key regulator of BAT development. Its expression is highly elevated in BAT, where it induces brown fat phenotype as a co-activator of PGC1α, PPARα, PPARγ, C/EBP and thyroid receptor [10]. PRDM16 also acts as a repressor of white fat cells expressed genes through association with C-terminal binding co-repressor proteins (CtBP1 and CtBP2) [11].
In the 5ʹ-flanking region the PRDM16 gene contains the polymorphism rs12409277. It has been suggested that T to C change in this polymorphism might influence the transcriptional activity of the gene [12].
CtBP2 controls cellular processes by acting as a transcriptional corepressor, transcriptional activator and regulator of the cytoskeleton [13]. An intronic polymorphism within the CtBP2 gene, rs1561589, has been previously associated with BMI in females [14].
The aim of our research was to investigate the association of rs12409277 polymorphism within the PRDM16 gene and rs1561589 polymorphism within the CtBP2 gene with BMI, fasting glucose level and lipid profile of adolescents.
Material and methods
Study design and study population
Our study included 295 randomly selected healthy school children of both genders, 15 years of age, who participated in Yugoslav Study of the Precursors of Atherosclerosis in School Children (YUSAD). Anthropometric, demographic and medical data including age, gender, height, weight, lipid profile (TC, high-density lipoprotein cholesterol (HDL-C), LDL-C, triglycerides (TG)) and fasting glucose were recorded. Children were classified as normal weight, overweight (above 85th percentile) and obese (above 97th percentile) according to BMI charts published for Serbian children 15 years of age [15]. Criteria for exclusion from the study were type 1 or type 2 diabetes, generalized inflammation, cardiovascular diseases, malignant diseases, genetic syndromes and chronic immobility or cerebral palsy. A signed informed consent form was obtained from each child’s parent or guardian and the study protocol was approved by the Ethics Committee of Faculty of Medicine, University of Belgrade, Serbia.
Genotyping
Molecular-genetic analyses were performed at the Institute of Human Genetics, Faculty of Medicine, University of Belgrade, Serbia. DNA was extracted from 5 ml of peripheral blood by the salting out method [16]. Genotypes of the selected polymorphisms were detected by the real-time PCR method using pre-designed TaqMan SNP Genotyping assays. PCR amplification included an initial step at 95°C for 10 min and 40 cycles of 15 s at 92°C and 1 min at 60°C. PCR and post-PCR fluorescence analyses were performed on the Applied Biosystems 7500 Real Time PCR System (Applied Biosystems, Foster City, CA), and the results were analyzed using the Applied Biosystems 7500 software v2.0.6 (Applied Biosystems, Foster City, CA).
Biochemical analysis
Each individual fasted for 12 h before sample collection. Serum glucose, total cholesterol, HDL-C and triglyceride levels were measured as described previously [17]. LDL-C concentrations in samples were calculated using Friedewald’s equation (LDL-C = TC – HDL-C – TG/5) [18].
Statistical methods
For statistical analyses, the statistical software package SPSS 17 was used. Quantitative variables were expressed as mean ± standard deviation. The association of genotypes and BMI, fasting glucose level and serum lipid levels was tested by analysis of variance (ANOVA) or the Kruskal-Wallis test. After the grouping of genotypes Student’s t-test or the Mann-Whitney test was used, depending on the variable distribution. In order to evaluate the association of serum lipid levels and PRDM16 and CtBP2 genotypes with gender, fasting glucose level and BMI as covariates, multivariate linear regression analysis was also performed.
Results
Our study included 295 school children 15 years of age. There were 145 boys (49.2%) and 150 girls (50.8%). Among boys, 26 (17.9%) were overweight and 20 (13.8%) were obese. In the group of girls, 29 (19.3%) were overweight and 17 were obese (11.3%). The main characteristics of adolescents are presented in Table I. There was a statistically significant difference in mean values of systolic blood pressure, fasting glucose level and TC level between the groups of boys and girls.
Table I
Main characteristics of adolescents included in the study
| Parameter | All | Boys | Girls | P-value |
|---|---|---|---|---|
| BMI [kg/m2] | 22.08 ±4.31 | 21.86 ±4.33 | 22.26 ±0.63 | 0.244 |
| SBP [mm Hg] | 114.77 ±12.53 | 116.64 ±14.22 | 112.96 ±10.37 | 0.012* |
| DBP [mm Hg] | 72.91 ±9.12 | 73.09 ±9.63 | 72.74 ±8.62 | 0.745 |
| FPG [mmol/l] | 4.72 ±0.58 | 4.79 ±0.53 | 4.64 ±0.63 | 0.005* |
| Tg [mmol/l] | 0.99 ±0.55 | 0.99 ±0.63 | 1.00 ±0.47 | 0.213 |
| TC [mmol/l] | 4.36 ±0.87 | 4.21 ±0.79 | 4.50 ±0.92 | 0.003* |
| HDL-C [mmol/l] | 1.42 ±0.41 | 1.38 ±0.43 | 1.45 ±0.39 | 0.164 |
| LDL-C [mmol/l] | 2.48 ±0.87 | 2.40 ±0.84 | 2.55 ±0.90 | 0.122 |
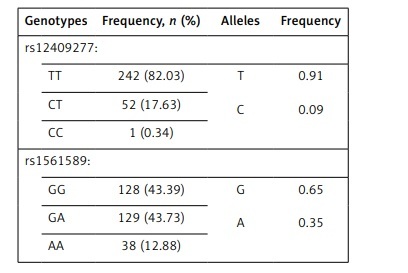
Frequencies of genotypes and alleles of rs12409277 and rs1561589 polymorphisms are presented in Table II. The distributions of genotypes of analyzed polymorphisms were in Hardy-Weinberg equilibrium. There was no statistically significant difference between male and female adolescents in frequencies of PRDM16 (p = 0.476) and CtBP2 (p = 0.816) genotypes. Mean values of analyzed parameters depending on the PRDM16 and CtBP2 genotypes are shown in Tables III and IV respectively.
Table II
Frequencies of rs12409277 and rs1561589 genotypes and alleles, n (%)
| Genotypes | Frequency, n (%) | Alleles | Frequency |
|---|---|---|---|
| rs12409277: | |||
| TT | 242 (82.03) | T C | 0.91 0.09 |
| CT | 52 (17.63) | ||
| CC | 1 (0.34) | ||
| rs1561589: | |||
| GG | 128 (43.39) | G A | 0.65 0.35 |
| GA | 129 (43.73) | ||
| AA | 38 (12.88) | ||
Table III
Mean values of analyzed parameters by PRDM16 rs12409277 genotype (mean ± SD)
| Parameter/Genotype | All | P-value | Boys | P-value | Girls | P-value |
|---|---|---|---|---|---|---|
| BMI [kg/m2]: | ||||||
| TT | 21.99 ±4.30 | 0.327 | 21.74 ±4.22 | 0.474 | 22.21 ±4.39 | 0.434 |
| CT+CC | 22.54 ±4.38 | 22.47 ±4.92 | 22.45 ±3.96 | |||
| FPG [mmol/l]: | ||||||
| TT | 4.72 ±0.60 | 0.790 | 4.79 ±0.52 | 0.919 | 4.65 ±0.67 | 0.793 |
| CT+CC | 4.70 ±0.48 | 4.79 ±0.52 | 4.59 ±0.40 | |||
| Tg [mmol/l]: | ||||||
| TT | 1.00 ±0.58 | 0.442 | 0.99 ±0.66 | 0.555 | 1.02 ±0.49 | 0.229 |
| CT+CC | 0.92 ±0.38 | 0.99 ±0.46 | 0.90 ±0.38 | |||
| TC [mmol/l]: | ||||||
| TT | 4.40 ±0.87 | 0.067 | 4.21 ±0.79 | 0.739 | 4.57 ±0.92 | 0.037* |
| CT+CC | 4.20 ±0.84 | 4.17 ±0.81 | 4.21 ±0.86 | |||
| HDL-C [mmol/l]: | ||||||
| TT | 1.42 ±0.42 | 0.930 | 1.40 ±0.44 | 0.328 | 1.43 ±0.39 | 0.340 |
| CT+CC | 1.41 ±0.36 | 1.30 ±0.36 | 1.51 ±0.34 | |||
| LDL-C [mmol/l]: | ||||||
| TT | 2.51 ±0.88 | 0.170 | 2.39 ±0.85 | 0.828 | 2.61 ±0.90 | 0.054 |
| CT+CC | 2.36 ±0.82 | 2.41 ±0.80 | 2.29 ±0.85 | |||
Table IV
Mean values of analyzed parameters by CtBP2 rs1561589 genotype (mean ± SD)
Statistical analysis has shown that there is a statistically significant difference in mean values of TC (p = 0.037) and borderline significance in mean values of LDL-C (p = 0.054) depending on PRDM16 genotype in the group of girls. Girls carrying TT genotype had a significantly higher TC level and a tendency towards a higher LDL-C level. However, when we performed multiple linear regression analysis using fasting glucose level and BMI as covariates we could not confirm these results. Children were further grouped according to their PRDM16 and CtBP2 genotypes in groups with TT+GG genotypes, CT+GG genotypes, TT+GA/AA genotypes and CT+GA/AA genotypes, respectively. Combination of CC+GA genotypes was observed in just 1 patient while other combinations of genotypes were not recorded in our study group. Statistical analysis showed that carriers of CT+GG genotype have significantly lower TC (p = 0.005) and LDL-C (p = 0.032) levels compared to all other groups (Table V). These results were confirmed by multiple linear regression analysis for both TC (β = –0.198, p = 0.001) and LDL-C (β = –0.159, p = 0.008) using gender, BMI and fasting glucose level as covariates.
Table V
Mean values of analyzed parameters by combined PRDM16 and CtBP2 genotypes (mean ± SD)
| Genotypes | n (%) | BMI | FPG | Tg | TC | HDL-C | LDL-C |
|---|---|---|---|---|---|---|---|
| TT+GG | 101 (34.35) | 21.86 ±3.94 | 4.70 ±0.59 | 0.94 ±0.40 | 4.47 ±0.92 | 1.43 ±0.37 | 2.58 ±0.83 |
| CT+GG | 27 (9.18) | 22.01 ±3.82 | 4.67 ±0.48 | 0.86 ±0.34 | 3.81 ±0.57 | 1.40 ±0.36 | 2.04 ±0.58 |
| TT+GA/AA | 141 (47.96) | 22.12 ±4.62 | 4.75 ±0.61 | 1.06 ±0.69 | 4.35 ±0.85 | 1.40 ±0.45 | 2.46 ±0.92 |
| CT+GA/AA | 25 (8.51) | 23.01 ±5.00 | 4.71 ±0.50 | 0.96 ±0.41 | 4.53 ±0.88 | 1.45 ±0.37 | 2.62 ±0.88 |
| P-value | 0.805 | 0.897 | 0.458 | 0.005* | 0.897 | 0.032* |
Discussion
It has been previously reported that BAT has an important role in weight determination [2, 19]. In the study of Matsushita et al. [7] healthy, adult subjects with and without detectable BAT were compared. Subjects with detectable BAT were younger and showed lower adiposity-related parameters such as BMI, body fat mass, and abdominal fat area. It has also been observed that blood glucose, total cholesterol and LDL cholesterol were significantly lower in the BAT-positive group. Our aim was to investigate whether polymorphisms of genes important for expression of BAT and repression of white adipose tissue (WAT) formation may influence BMI, glucose level and lipid profile of adolescents. PRDM16 is a co-regulatory protein crucial for BAT development. Its main role is to induce BAT formation through co-activation of PGC1α, PPARα, PPARγ, C/EBP and thyroid receptor genes [10] and repress the expression of white cells specific genes by interacting with CtBP1 and CtBP2 co-repressors [20]. The results of Urano et al. showed that the rs12409277 single nucleotide polymorphism (SNP) influences transcriptional activity of the PRDM16 gene. The presence of the C allele corresponds with higher expression activity [12] and therefore higher volume and activity of BAT/beige WAT. In our study we did not find a statistically significant association between this polymorphism and BMI, fasting glucose and lipid profile of all adolescents. In the group of girls an association between PRDM16 rs12409277 polymorphism and TC level was observed. During puberty there is an increase in production of growth hormone, growth factors, gonadotropins and sex steroid hormones that might influence BAT activity [4]. Therefore, the possible explanation for the gender-specific result we obtained might be the difference in growth and sexual maturity between boys and girls in our study group. However, our result was not confirmed by multiple linear regression analysis.
The same polymorphism was analyzed [12] in the group of postmenopausal women. Results of this study have shown that presence of CC or CT genotypes is significantly associated with higher lean body mass. In the study of AlAmrani et al. wild type genotype of PRDM16 rs2651899 polymorphism was associated with higher blood cholesterol, HDL-C and LDL-C and with lower triglyceride level [21]. Also, it has been suggested that presence of mutated alleles (GA and AA genotype) increases the risk of obesity. Yue et al. investigated the rs2236518 polymorphism located in the 3ʹUTR region of the PRDM16 gene and detected an association with BMI in both young males (20–40 years) and older males (50–80 years) [22]. Park et al. tested the association of PRDM16 rs17390167 and susceptibility to metabolic syndrome (MetS) and found a significant trend but the results did not reach the statistical threshold in cohorts from the Framingham Heart Study [23]. Zhang et al. in their study observed a negative association between rs2236518 and susceptibility to MetS in Uygur Chinese subjects [24].
Our analysis of CtBP2 rs1561589 polymorphism also did not reveal a statistically significant association with any of the analyzed parameters. The same polymorphism was investigated in the genome-wide association study (GWAS) of Hinney et al. [14]. This study revealed the association of rs1561589 as well as two other intronic polymorphisms (rs126681170 and rs126674064) with susceptibility to anorexia nervosa and increased BMI, predominantly in females. They also analyzed these SNPs in the Early Growth Genetics Consortium data set that includes only children and adolescents and no significant findings were observed, which is in accordance with our results [25].
PRDM16 and CtBP2 form complexes that bind directly to the promoters of white fat tissue specific genes such as resistin and angiotensinogen and repress their expression [11]. Based on the knowledge of interaction between PRDM16 and CtBP2 proteins we investigated the combined effect of two analyzed polymorphisms. Our results have shown that carriers of CT genotype for the PRDM16 gene rs12409277 and GG genotype of CtBP2 gene rs1561589 polymorphism have significantly lower levels of TC and LDL-C compared to all the other combinations of genotypes. Presence of the minor C allele increases expression of the PRDM16 gene. The effect of intronic polymorphism in the CtBP2 gene has not yet been confirmed. However, based on the current knowledge it is possible that the presence of the minor allele reduces the expression or activity of CtBP2 either directly or by being in linkage disequilibrium with another, still unknown functional polymorphism. Therefore, it is possible that carriers of CT+GG genotypes have higher expression of PRDM16 and CtBP2 and consequently less WAT and more BAT. To our knowledge this is the first study that has investigated the combined effect of PRDM16 and CtBP2 gene polymorphisms.
One limitation of our research is the lack of data about non-genetic factors that could influence the BMI, glucose level and lipid profile of adolescents. It is known that lifestyle, nutritional behavior and medications can modify lipid status [26]. The studies of Bergier et al. and Junger et al. have shown that boys are more active than girls, while girls, who in a very small percentage fulfill the physical activity recommendations, have better nutritional behavior [27, 28]. Also, an association between the PRDM16 and CtBP2 genotypes and TC was observed only in the population of healthy adolescents, and the long-term health impact of this association is not clear. Some studies investigated the tracking of blood lipid changes from adolescence to adulthood and their results supported the importance of measuring lipids during adolescence for identifying individuals with high risk for cardiovascular disease [29, 30]. Still, there is not enough evidence about the importance of early measurement of lipids [31].
In order to draw definite conclusions it would be of great interest to further analyze the association of combined PRDM16 and CtBP2 genotypes with lipid profile of adolescents and adults on a larger population, taking into consideration non-genetic factors as well.