Severe acute respiratory syndrome coronavirus 2 (SARS-CoV-2) infection has rapidly spread throughout the world and within a few months caused a global pandemic [1]. During the early months of the coronavirus disease 2019 (COVID-19) pandemic, it was suggested that children are not susceptible to COVID-19 infection. Later, during the pandemic, paediatric COVID-19 was described as asymptomatic or with mild symptoms (such as fever, cough, sore throat, diarrhoea) causing very few paediatric hospitalizations [2, 3]. Currently (especially during the infection of delta and omicron variants), more and more children have been infected with the coronavirus and they have often ended up in hospital intensive care units (ICU) with alarming symptoms that begin appearing weeks after the initial infection of COVID-19. This new condition develops very quickly and can attack multiple systems and organs causing high fever, cutaneous manifestations, abdominal symptoms, and cardiovascular problems [4, 5]. Gastrointestinal manifestations are very common and include abdominal pain, diarrhoea, and vomiting [6]. Some patients may also have neurological symptoms (e.g., headache, conjunctivitis) [7]. This new clinical entity was for the first time identified in April 2020 as a paediatric inflammatory multisystem syndrome temporally associated with SARS-CoV-2 infection (PIMS-TS) [3–6]. Due to the wide range of its symptoms and the possible imitation of other diseases [8], PIMS-TS is still diagnosed too late, what can increase the risk of morbidity, long-term complications, and even mortality. Therefore, it seems that children with PIMS-TS should be well characterized and described to potentially predict the occurrence of this life-threatening condition. Thus, in the present analysis we aimed to characterize biochemical and cardiovascular predictors of PIMS risk in children recovered from COVID-19 based on the first data from the LATE-COVID-Kids study (NCT04799444).
Methods
148 consecutive (by 15 March 2021) COVID-19 convalescents (mean age: 8.58 ±4.96; 75 boys and 73 girls) hospitalized for the clinical evaluation after the acute phase of the COVID-19 were classified into two groups related to symptoms: 33 children finally diagnosed with PIMS and 115 children with non-PIMS. All patients had confirmed coronavirus infection based on the positive results of the nucleic acid test (reverse transcriptase-polymerase chain reaction – RT-PCR), and they were serologically tested for antibodies against SARS-CoV-2. They had detailed laboratory testing, electrocardiography, echocardiography, lung ultrasound and spirometry.
Statistical analysis
Normal distribution was assessed using the Shapiro-Wilk test. The obtained results were presented as mean ± standard deviation or median (25–75% percentiles) for continuous variables, as appropriate, and as proportions in case of discrete variables. Comparisons between groups were performed using the Student’s t-test for independent variables, the Mann-Whitney U test or χ2 test with Yates correction, as appropriate. Generalized linear model was used to calculate p adjusted for sex and age. P-values < 0.05 were considered statistically significant. Statistical analysis was performed using the Statistica v.13 software (TIBCO Software Inc., Palo Alto, CA, USA).
Results
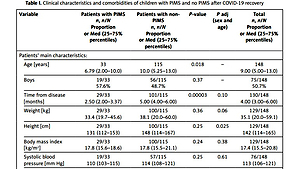
The time from COVID-19 recovery was from 1 to 13 months (4.00 (3.00–6.00)); for children with PIMS was 2.5 months (2.00–3.37) and for children with no PIMS was 5 months (4.00–6.00; p = 0.00003). Patients with PIMS were significantly younger in comparison to those without PIMS (6.79 ±4.57 vs. 9.10 ±4.94 years, p = 0.018). We did not observe any male predominance within the studied groups. In the PIMS group of patients there were 19 boys (57.6%) and in the non-PIMS group 56 boys (48.7%) (Table I). Most of the young patients with PIMS had no comorbidities (81.8%) similar to the non-PIMS group of children (65.2%). Furthermore, we did not observe any significant difference in the incidence of mild disorders of the immune (21.2% vs. 21.7%), circulatory (9.10% vs. 6.96%) and respiratory systems (12.1% vs. 3.48%) between the investigated groups (Table I). Interestingly, some diseases (e.g., hypothyroidism, epilepsy, ADHD, autism, anxiety disorders, bile reflux, celiac disease, insulin resistance, hypertriglyceridemia, abdominal pain) occurred only in children without PIMS (Table I).
Table I
Clinical characteristics and comorbidities of children with PIMS and no PIMS after COVID-19 recovery
| Variable | Patients with PIMS n, n/N Proportion or Med (25–75% percentiles) | Patients with non-PIMS n, n/N Proportion or Med (25–75% percentiles) | P-value | P adj (sex and age) | Total n, n/N Proportion or Med (25–75% percentiles) |
|---|---|---|---|---|---|
| Patients’ main characteristics: | |||||
| Age [years] | 33 6.79 (2.00–10.0) | 115 10.0 (5.25–13.0) | 0.018 | – | 148 9.00 (5.00–13.0) |
| Boys | 19/33 57.6% | 56/115 48.7% | 0.37 | – | 75/148 50.7% |
| Time from disease [months] | 29/33 2.50 (2.00–3.37) | 101/115 5.00 (4.00–6.00) | 0.00003 | 0.10 | 130/148 4.00 (3.00–6.00) |
| Weight [kg] | 29/33 33.4 (19.7–45.6) | 100/115 38.1 (20.0–60.0) | 0.36 | 0.06 | 129/148 35.1 (20.0–59.1) |
| Height [cm] | 29/33 131 (112–153) | 100/115 148 (114–167) | 0.25 | 0.025 | 129/148 142 (114–165) |
| Body mass index [kg/m2] | 29/33 17.8 (15.6–18.6) | 100/115 17.8 (15.5–21.1) | 0.24 | 0.38 | 129/148 17.4 (15.5–20.8) |
| Systolic blood pressure [mm Hg] | 19/33 110 (103–115) | 57/115 114 (108–121) | 0.25 | 0.61 | 76/148 113 (106–121) |
| Diastolic blood pressure [mm Hg] | 19/33 70.5 (65.7–80.0) | 57/115 68.0 (62.0–71.0) | 0.11 | 0.15 | 76/148 69.0 (63.0–79.0) |
| Heart rate on admission [/min] | 27/33 100 (89.0–111) | 80/115 90.0 (87.7–100) | 0.007 | 0.008 | 107/148 90.0 (80.0–100) |
| Comorbidities*: | |||||
| Immune system | 7/33 21.2% | 25/115 21.7% | 0.95 | 0.96 | 32/148 21.6% |
| Circulatory system | 3/33 9.10% | 8/115 6.96% | 0.68 | 0.74 | 11/148 7.43% |
| Respiratory system | 4/33 12.1% | 4/115 3.48% | 0.054 | 0.12 | 8/148 5.40% |
| Endocrine system | 0/33 0% | 3/115 2.60% | 0.35 | 0.44 | 3/148 2.03% |
| Nervous system | 0/33 0% | 8/115 6.96% | 0.12 | 0.20 | 8/148 5.40% |
| Digestive system | 0/33 0% | 13/115 11.3% | 0.04 | 0.10 | 13/148 8.78% |
| Without comorbidities | 27/33 81.8% | 75/115 65.2% | 0.07 | 0.14 | 102/148 68.9% |
* Explanation: Immune system diseases – immunodeficiencies, allergies, erythema, atopic dermatitis (AD), leukopenia; Circulatory system diseases – heart defect, tachycardia, ischemic stroke, anaemia, vascular diathesis, hypertension; Respiratory system diseases – chronic lung disease, asthma, frequent infections of the upper respiratory tract; Endocrine system diseases – hypothyroidism; Nervous system diseases – epilepsy, depression, attention deficit hyperactivity disorder (ADHD), autism, anxiety disorders, hyperactivity; Digestive system diseases – bile reflux, Gilbert’s syndrome, celiac disease, fructose intolerance, overweight, insulin resistance, hypertriglyceridemia, abdominal pain.
Both analysed groups of children (PIMS and non-PIMS) did not differ in terms of any symptoms on hospital admission (51.5% vs. 56.5%, respectively). The prevalence of mild complications of respiratory symptoms (weakness, pulmonary distension, cough, shortness of breath, decreased exercise tolerance) was 24.2% vs. 27.8%, gastrointestinal manifestations (enlarged liver, diarrhoea, eating disorder, abdominal pain) – 9.10% vs. 10.4%, neurological symptoms (headache, concentration disorders, insomnia) – 15.1% vs. 7.83%, dermatological symptoms (rash, hair falling, lumps on the toes) – 6.10% vs. 6.10%, and cardiovascular symptoms (low contraction murmur under the heart, sinus bradycardia, arrhythmia, fainting) – 6.10% vs. 2.60% in children with PIMS and non-PIMS, respectively. The immune system symptoms (such as enlarged lymph nodes, enlarged tonsils) appeared more often in the PIMS group than in the non-PIMS group (6.01% vs. 0.87%, respectively). Spirometry in these two investigated groups showed some signs of lung obstruction similarly to lung ultrasound, which revealed only post-inflammatory pulmonary lesions found in PIMS as well as non-PIMS children (Table II). The above pulmonary lesions were not considered as pathological.
Table II
Symptoms on hospital admission of the patients with PIMS and non-PIMS after COVID-19 recovery
| Variable | Patients with PIMS n/N Proportion | Patients with non-PIMS n/N Proportion | P-value | P adj (sex and age) | Total n/N Proportion |
|---|---|---|---|---|---|
| *Symptoms on admission: | |||||
| Respiratory | 8/33 24.2% | 32/115 27.8% | 0.69 | 0.74 | 40/148 27.0% |
| Gastrointestinal | 3/33 9.10% | 12/115 10.4% | 0.82 | 0.85 | 15/148 10.1% |
| Neurological | 5/33 15.1% | 9/115 7.83% | 0.21 | 0.31 | 14/148 9.46% |
| Dermatological | 2/33 6.10% | 7/115 6.10% | 1.00 | 0.99 | 9/148 6.10% |
| Cardiovascular | 2/33 6.10% | 3/115 2.61% | 0.34 | 0.44 | 5/148 3.38% |
| Immunological | 2/33 6.01% | 1/115 0.87% | 0.06 | 0.13s | 3/148 2.03% |
| No symptoms | 17/33 51.5% | 65/115 56.5% | 0.15 | 0.25 | 82/148 55.4% |
| Lung ultrasound: | |||||
| Post-inflammatory pulmonary lesions | 16/33 48.5% | 24/57 42.1% | 0.56 | 0.61 | 40/90 44.4% |
* Explanation: Respiratory symptoms – weakness, pulmonary distension, cough, shortness of breath, decreased exercise tolerance; Gastrointestinal symptoms – enlarged liver, diarrhoea, eating disorder, abdominal pain; Neurological symptoms – headache, concentration disorders, insomnia: Dermatological symptoms – rash, hair loss, lumps on the toes; Cardiovascular symptoms – low contraction murmur under the heart, sinus bradycardia, arrhythmia; Immunological symptoms – enlarged lymph nodes, enlarged tonsils.
In comparison to the non-PIMS group, children with PIMS had a higher level of antithrombin III (111 ±9.30 vs. 105 ±11.4, p = 0.02), higher heart rate (HR)/min (100 (89.0–111) vs. 90.0 (79.7–100), p = 0.007) and sinus rhythm (100 (86.0–122) vs. 85.0 (75.0–105), p = 0.03) but lower PQ interval (120 (112–120) vs. 130 (120–140), p = 0.02) on admission to hospital. Moreover, the immunological parameters: lymphocytes (absolute count and percentage) were higher in children with PIMS vs. without PIMS (3.32 (2.37–5.34) vs. 2.60 (2.18–3.28), p = 0.03, and 51.7 (41.6–60.6) vs. 44.0 (34.6–50.2), p = 0.004), but IgA and neutrophils (%) were significantly lower (0.69 (0.47–0.87) vs. 1.11 (0.66–1.47), p = 0.0003 and (37.0 ±13.4 vs. 43.3 ±12.0; p = 0.004), respectively). Some acid-base balance parameters were higher in children with PIMS vs. non-PIMS children group: pO2 (50.5 (40.4–60.8) vs. 40.0 (28.3–50.0), p = 0.003), and O2Sat (84.5 (74.1–93.9) vs. 64.1 (44.3–82.6), p = 0.002) and concentration of potassium (4.60 (4.40–4.70) vs. 4.30 (4.10–4.52), p = 0.006; however, pCO2 (41.3 ±5.50 vs. 44.8 ±7.10, p = 0.02) was lower in the PIMS group of children. Finally, children with PIMS had a higher level of thyroid stimulating hormone (TSH: 2.76 (2.16–4.18) vs. 2.36 (1.73–2.83), p = 0.03) and red cell distribution width – coefficient of variation (RDW-CV: 12.9 (12.3–13.9) vs. 12.4 (12.1–12.9), p = 0.005) compared to children without PIMS (Table III).
Table III
Comparison of laboratory test results, electrocardiography, and echocardiography in patients with PIMS and non-PIMS after COVID-19 recovery
| Variable | Patients following PIMS | Patients following non-PIMS | P-value | P adj* | Total | |||
|---|---|---|---|---|---|---|---|---|
| N | Mean ± SD or median (25–75% percentiles) | N | Mean ± SD or median (25–75% percentiles) | N | Mean ± SD or median (25–75% percentiles) | |||
| Laboratory test results: | ||||||||
| Alanine aminotransferase [U/l] | 26 | 16.0 (14.0–18.0) | 112 | 16.0 (12.7–20.0) | 0.76 | 0.43 | 138 | 16.0 (13.0–20.0) |
| Aspartate transaminase [U/l] | 23 | 34.0 (30.5–41.5) | 101 | 32.0 (27.0–39.0) | 0.46 | 0.34 | 124 | 33.0 (27.0–40.2) |
| Albumin [g/dl] | 22 | 4.60 (4.50–4.80) | 54 | 4.60 (4.43–4.80) | 0.76 | 0.64 | 76 | 4.60 (4.50–4.80) |
| Lactate dehydrogenase [U/l] | 28 | 232 ±45.2 | 98 | 226 ±49.4 | 0.50 | 0.45 | 126 | 226 ±48.2 |
| Creatine kinase [U/l] | 23 | 78.0 (44.5–155) | 96 | 87.0 (61.7–113) | 0.72 | 0.93 | 119 | 86.0 (57.5–117) |
| Creatine kinase-MB [U/l] | 26 | 28.5 (18.0–36.0) | 76 | 21.0 (15.0–30.2) | 0.06 | 0.07 | 102 | 23.0 (16.0–32.7) |
| NT-proBNP [pg/dl] | 30 | 47.0 (26.7–80.2) | 97 | 39.0 (18.5–69.0) | 0.23 | 0.54 | 127 | 40.0 (19.0–69.5) |
| APTT-SP [s] | 26 | 31.5 (29.5–31.9) | 102 | 30.8 (29.1–33.1) | 0.56 | 0.33 | 128 | 30.8 (29.1–33.0) |
| Prothrombin time [s] | 26 | 12.3 ±0.77 | 103 | 12.5 ±0.74 | 0.33 | 0.40 | 129 | 12.4 ±0.75 |
| Indicator PT | 26 | 90.0 ±5.53 | 102 | 88.8 ±5.33 | 0.31 | 0.38 | 128 | 89.0 ±5.39 |
| INR | 26 | 1.11 ±0.07 | 101 | 1.13 ±0.07 | 0.35 | 0.41 | 127 | 1.12 ±0.07 |
| D-dimers [ng/ml] | 27 | 390 (260–582) | 102 | 262 (192–387) | 0.005 | 0.21 | 129 | 284 (200–413) |
| Ferritin [g/l] | 27 | 28.0 (17.9–40.3) | 48 | 38.4 (20.1–57.9) | 0.32 | 0.76 | 75 | 34.1 (19.2–54.9) |
| Fibrinogen [g/l] | 28 | 2.27 (2.11–2.53) | 103 | 2.20 (1.95–2.54) | 0.33 | 0.45 | 131 | 2.22 (2.00–2.53) |
| γ-glutamyl transpeptidase [U/l] | 16 | 14.0 (11.7–17.2) | 73 | 14.0 (12.0–17.0) | 0.91 | 0.69 | 89 | 14.0 (12.0–17.0) |
| Serum glucose [mg/dl] | 20 | 85.0 ±9.21 | 92 | 84.5 ±10.5 | 0.63 | 0.88 | 112 | 83.9 ±10.7 |
| Serum creatinine [mg/dl] | 28 | 0.33 (0.25–0.42) | 106 | 0.44 (0.33–0.54) | 0.014 | 0.45 | 134 | 0.41 (0.31–0.54) |
| Glomerular filtration rate [ml/min/1.73 m2] | 22 | 190 ±29.1 | 80 | 183 ±32.8 | 0.36 | 0.24 | 102 | 185 ±32.1 |
| Urea [mg/dl] | 24 | 24.8 ±5.96 | 100 | 26.8 ±6.30 | 0.16 | 0.25 | 124 | 26.4 ±6.28 |
| Total cholesterol [mg/dl] | 22 | 161 ±31.8 | 100 | 162 ±25.5 | 0.89 | 0.85 | 122 | 162 ±26.7 |
| High density lipoprotein cholesterol [mg/dl] | 21 | 51.0 ±11.8 | 100 | 55.3 ±12.6 | 0.16 | 0.23 | 121 | 54.6 ±12.6 |
| Triglycerides [mg/dl] | 24 | 87.5 (69.7–114) | 100 | 76.5 (60.0–101) | 0.10 | 0.38 | 124 | 79.0 (61.5–102) |
| Low density lipoprotein cholesterol [mg/dl] | 21 | 85.7 ±24.7 | 100 | 90.0 ±23.8 | 0.46 | 0.56 | 121 | 89.3 ±24.0 |
| Non-HDL cholesterol [mg/dl] | 20 | 107 ±27.9 | 98 | 107 ±24.5 | 0.95 | 0.98 | 118 | 107 ±25.1 |
| IgG antibodies to SARS-CoV-2 [AU/ml] | 16 | 57.9 (24.7–103) | 93 | 88.0 (49.0–123) | 0.15 | 0.94 | 109 | 77.0 (48.5–123) |
| IgG [g/l] | 30 | 10.5 ±2.50 | 96 | 9.74 ±2.93 | 0.18 | 0.21 | 126 | 9.93±2.85 |
| IgA [g/l] | 29 | 0.69 (0.47–0.87) | 81 | 1.11 (0.66–1.47) | 0.0003 | 0.0004 | 110 | 0.94 (0.61–1.41) |
| IgM [g/l] | 28 | 0.88 (0.72–1.38) | 77 | 0.98 (0.71–1.40) | 0.98 | 0.90 | 105 | 0.97 (0.71–1.40) |
| Complement component 3 [mg/dl] | 25 | 98.0 (91.0–107) | 74 | 99.5 (93.0–116) | 0.70 | 0.72 | 99 | 99.0 (92.0–114) |
| Complement component 4 [mg/dl] | 27 | 22.0 (18.0–25.8) | 95 | 22.0 (19.0–29.0) | 0.71 | 0.77 | 122 | 22.0 (19.0–29.0) |
| Thyroid-stimulating hormone [μUl/ml] | 21 | 2.76 (2.16–4.18) | 98 | 2.36 (1.73–2.83) | 0.03 | 0.01 | 119 | 2.43 (1.76–2.89) |
| Free thyroxine 4 [ng/dl] | 18 | 1.20 (1.15–1.38) | 79 | 1.23 (1.14–1.33) | 0.57 | 0.52 | 97 | 1.23 (1.14–1.33) |
| Vitamin D25-OH [ng/ml] | 20 | 25.6 (22.8–31.1) | 100 | 24.0 (18.8–31.8) | 0.32 | 0.87 | 120 | 24.3 (19.2–31.7) |
| Antithrombin III (%) | 24 | 111 ±9.30 | 84 | 105 ±11.4 | 0.02 | 0.03 | 108 | 106 ±11.2 |
| Urine specific gravity [g/l] | 30 | 1.016 (1.011–1.020) | 98 | 1.018 (1.013–1.024) | 0.20 | 0.27 | 128 | 1.018 (1.012–1.023) |
| Urine pH | 30 | 6.50 (6.00–7.00) | 98 | 6.00 (5.00–6.50) | 0.03 | 0.09 | 128 | 6.00 (5.00–6.50) |
| White blood count [103/μl] | 32 | 6.85 (5.24–9.42) | 112 | 6.60 (5.49–7.87) | 0.68 | 0.53 | 144 | 6.60 (5.44–8.46) |
| Red blood count [106/μl] | 32 | 4.57 (4.41–4.79) | 112 | 4.80 (4.48–4.97) | 0.07 | 0.25 | 144 | 4.74 (4.46–4.94) |
| Haemoglobin [g/dl] | 32 | 12.8 (12.1–13.3) | 112 | 13.3 (12.6–13.8) | 0.02 | 0.08 | 144 | 13.1 (12.5–13.7) |
| Haematocrit (%) | 32 | 36.9 (35.0–38.9) | 112 | 38.4 (36.7–40.4) | 0.02 | 0.08 | 144 | 38.0 (36.4–40.3) |
| Mean corpuscular volume [fl] | 32 | 80.5 ±4.34 | 112 | 81.5 ±3.66 | 0.19 | 0.09 | 144 | 81.3 ±3.85 |
| Mean corpuscular haemoglobin [pg] | 32 | 27.8 (26.7–28.6) | 112 | 28.1 (27.1–29.1) | 0.38 | 0.48 | 144 | 27.9 (27.1–29.1) |
| Mean corpuscular haemoglobin concentration [g/dl] | 32 | 34.4 ±0.88 | 112 | 34.4 ±0.99 | 0.86 | 0.77 | 144 | 34.4 ±0.97 |
| Platelet count [103/μl] | 32 | 329 (297–380) | 112 | 300 (260–348) | 0.04 | 0.89 | 144 | 309 (262–353) |
| Red cell distribution width – coefficient of variation [%] | 32 | 12.9 (12.3–13.9) | 112 | 12.4 (12.1–12.9) | 0.005 | 0.0005 | 144 | 12.5 (12.1–13.0) |
| Platelet distribution width [fl] | 32 | 11.9 (10.3–12.9) | 112 | 12.2 (10.7–13.1) | 0.2 | 0.25 | 144 | 12.1 (10.5–13.1) |
| Mean platelet volume [fl] | 32 | 10.3 (9.48–10.8) | 112 | 10.5 (9.88–11.1) | 0.18 | 0.17 | 144 | 10.4 (9.72–11.0) |
| Platelet large cell ratio (%) | 32 | 27.7 (20.8–31.8) | 112 | 28.8 (23.8–33.5) | 0.20 | 0.21 | 144 | 28.5 (22.2–33.4) |
| Platelet crit (%) | 32 | 0.34 (0.31–0.38) | 112 | 0.30 (0.27–0.36) | 0.08 | 0.05 | 144 | 0.32 (0.28–0.37) |
| Absolute neutrophil count [103/μl] | 32 | 2.07 (1.77–2.95) | 112 | 2.80 (2.20–3.77) | 0.007 | 0.11 | 144 | 2.67 (2.05–3.60) |
| Neutrophils (%) | 32 | 37.0 ±13.4 | 112 | 44.3 ±12.0 | 0.004 | 0.005 | 144 | 42.7 ±12.7 |
| Absolute lymphocyte count [103/μl] | 32 | 3.32 (2.37–5.34) | 112 | 2.60 (2.18–3.28) | 0.03 | 0.03 | 144 | 2.62 (2.20–3.50) |
| Lymphocytes (%) | 32 | 51.7 (41.6–60.6) | 112 | 44.0 (34.6–50.2) | 0.004 | 0.002 | 144 | 45.7 (35.4–52.1) |
| Absolute monocyte count [103/μl] | 32 | 0.56 (0.42–0.75) | 112 | 0.48 (0.43–0.66) | 0.50 | 0.58 | 144 | 0.50 (0.43–0.66) |
| Monocytes (%) | 32 | 7.80 (6.40–8.72) | 112 | 7.80 (6.58–9.13) | 0.76 | 0.85 | 144 | 7.80 (6.50–9.10) |
| Absolute eosinophils [103/μl] | 32 | 0.13 (0.08–0.27) | 112 | 0.20 (0.11–0.30) | 0.17 | 0.25 | 144 | 0.16 (0.11–0.30) |
| Eosinophils (%) | 32 | 2.15 (1.23–3.32) | 112 | 2.70 (1.50–4.30) | 0.14 | 0.16 | 144 | 2.60 (1.50–4.27) |
| Absolute basophil count [103/μl] | 32 | 0.04 (0.03–0.06) | 112 | 0.04 (0.03–0.05) | 0.19 | 0.19 | 144 | 0.04 (0.03–0.05) |
| Basophils (%) | 32 | 0.60 (0.40–0.80) | 112 | 0.60 (0.40–0.73) | 0.49 | 0.59 | 144 | 0.60 (0.40–0.80) |
| Acid-base balance parameters: | ||||||||
| pH | 29 | 7.37 (7.35–7.39) | 61 | 7.35 (7.34–7.37) | 0.10 | 0.16 | 90 | 7.36 (7.35–7.38) |
| pCO2 | 29 | 41.3 ±5.50 | 61 | 44.8 ±7.10 | 0.02 | 0.01 | 90 | 43.7 ±6.80 |
| BE | 29 | –1.55 ±1.69 | 61 | –0.84 ±2.05 | 0.11 | 0.08 | 90 | –1.07 ±1.97 |
| HCO3 - | 29 | 23.7 (22.5–24.2) | 61 | 24.3 (22.8–26.2) | 0.02 | 0.46 | 90 | 24.1 (22.7–25.9) |
| pO2 | 29 | 50.5 (40.4–60.8) | 61 | 40.0 (28.3–50.0) | 0.003 | 0.006 | 90 | 42.7 (30.8–54.5) |
| O2Sat | 29 | 84.5 (74.1–93.9) | 61 | 64.1 (44.3–82.6) | 0.002 | 0.001 | 90 | 76.2 (50.7–87.5) |
| Sodium [mmol/l] | 29 | 139 (138–141) | 67 | 140 (139–141) | 0.27 | 0.33 | 96 | 140 (139–141) |
| Potassium [mmol/l] | 29 | 4.60 (4.40–4.70) | 68 | 4.30 (4.10–4.52) | 0.006 | 0.03 | 97 | 4.40 (4.20–4.70) |
| Chlorides [mmol/l] | 30 | 107 (105–109) | 68 | 107 (014–109) | 0.98 | 0.60 | 98 | 107 (104–109) |
| Electrocardiography: | ||||||||
| PQ [ms] | 24 | 120 (112–120) | 63 | 130 (120–140) | 0.02 | 0.04 | 87 | 120 (110–140) |
| QRS [ms] | 24 | 80.0 (67.5–80.0) | 63 | 80.0 (60.0–80.0) | 0.53 | 0.56 | 87 | 80.0 (60.0–80.0) |
| QTC [ms] | 24 | 388 (358–401) | 63 | 380 (360–409) | 0.78 | 0.61 | 87 | 385 (359–406) |
| Sinus rhythm [/min] | 24 | 100 (86.0–122) | 63 | 85.0 (75.0–105) | 0.03 | 0.009 | 87 | 91.0 (76.0–108) |
| Echocardiography: | ||||||||
| EF (%) | 18 | 70.9 (65.2–75.7) | 60 | 72.0 (68.0–77.9) | 0.23 | 0.26 | 78 | 72.0 (66.7–77.0) |
Discussion
Nowadays, especially in the time of delta and omicron infections, children with COVID-19 are more and more often developing PIMS [9]. Due to the heterogeneous clinical spectrum and appearance of new symptoms all the time, this disease is still not diagnosed quickly. Additionally, what is very important we do not know anything about the long-term consequences of this new disease. Therefore, we have attempted to assess the long-term follow-up studies of children after they recovered from PIMS. We focused on laboratory testing, electrocardiography, echocardiography, lung ultrasound, and spirometry performed in patients with COVID-19 associated with PIMS in comparison to non-PIMS children. The time from disease was over 4 months. We observed that PIMS occurs in younger children with an average age of about 7 years. Laboratory findings showed the increase in antithrombin III, lymphocytes (absolute count and percentage) and some acid-base balance parameters such as partial pressure of oxygen (pO2), oxygen saturation (O2Sat) and potassium level, and a slight decrease in the number of neutrophils, immunoglobulins A and partial pressure of carbon dioxide (pCO2) what can paradoxically indicate better condition in PIMS children. However, cardiac parameters including a higher heart rate and sinus rhythm, and lower PQ interval observed in electrocardiography can suggest abnormalities in the circulatory system in the future linked to PIMS-TS, which was also indicated by Leung et al. [10]. Moreover, the level of thyroid stimulating hormone and red cell distribution width – coefficient of variation were increased in the PIMS group of patients compared to children without PIMS. Based on our best knowledge it is the first attempt to report on the possible predictors of PIMS risk in children recovered from COVID-19.
Unfortunately, it is still difficult to explain why a relatively small ratio of children develop PIMS, while the overwhelming majority of children with COVID-19 recover without long-term complications. This is not indicated by comorbidities that may be associated with the faster COVID-19 progression and development of PIMS, or complications after the disease. We did not observe any significant difference in the incidence of mild disorders of the immune, circulatory, and respiratory, endocrine, nervous, and digestive systems between PIMS and non-PIMS children. Similarly, the investigated groups did not differ statistically in terms of symptoms on admission to hospital. Some authors have pointed out that most children with PIMS-TS have not exhibited respiratory complaints unlike children with no PIMS [11], but we observed post-inflammatory pulmonary lesions detected by ultrasound found both in PIMS and non-PIMS children. Likewise, spirometry in two studied groups of patients who could be tested showed some signs of lung obstruction. Thus, it seems that the explanation why a small ratio of children with COVID-19 developed PIMS might be genetic predisposition [12]. However, social, and demographic factors are also likely to play a large role in this disparity [13]. To summarize, children with PIMS-TS have an overall good prognosis rather without any severe complications despite more frequent hospitalization and intensive medical care. Further research and long-term follow-up studies of PIMS children are necessary.
In conclusion, we showed that children with PIMS have significantly higher levels of antithrombin III, higher HR, sinus rhythm as well as lymphocytes, pO2 and O2Sat, potassium, TSH, RDW-CV on admission to hospital and lower levels of PQ interval, IgA, neutrophils, and pCO2 concentration. Our research is continued to confirm these results and next to create the PIMS SCORE algorithm to enable the prediction of children with the risk of PIMS occurrence after COVID-19 recovery.