Introduction
Lipoprotein (a) (Lp(a)) is a specific lipoprotein composed of an low-density lipoprotein (LDL)-like particle and apolipoprotein (a) (apo (a)), structure of which resembles that of plasminogen [1]. The unique properties of Lp(a), particularly its capacity to transport oxidized phospholipids (OxPLs), contributes to a distinctive risk profile for atherosclerotic cardiovascular disease (ASCVD), characterized by pro-atherogenic, pro-inflammatory, and anti-fibrinolytic features [2–4]. Approximately 90% of plasma Lp(a) concentrations are determined by genetic variation in the LPA gene [5]. Robust evidence supports Lp(a) as a genetically regulated, independent risk factor for various cardiovascular conditions, including myocardial infarction, aortic valve stenosis, peripheral artery disease, heart failure, and stroke [3, 6–10].
Genetic and epidemiological evidence further emphasize the potency of Lp(a) as a cardiovascular disease (CVD) risk factor. Data from the UK Biobank indicate that Lp(a) particles are over six times more strongly associated with CVD risk than LDL particles, a finding consistent with the results from other epidemiological studies [11, 12]. However, in the majority of patients, LDL particles are present in far greater numbers than Lp(a) particles [13]. Moreover, Lp(a) appears to have a more significant impact on the development and progression of atheroma, especially in later stages of disease, while LDL-C exerts its influence steadily across all phases of atherogenesis [14, 15].
Despite extensive research on Lp(a), many aspects of its biological function and contribution to disease remain unclear [16]. While Lp(a) levels are linearly correlated with CVD risk and recognized as an independent predictor of adverse outcomes, epidemiological evidence highlights significant inter-individual variability, suggesting that a substantial proportion of individuals with elevated Lp(a) may never develop cardiovascular disease, even at advanced age [17]. Recent long-term data from Ridker et al. [18] demonstrated that, during a 30-year follow-up of over 27,000 initially healthy women (mean baseline age of 54.7 years), less than 15% of those with the highest quintile of Lp(a) levels experienced cardiovascular events, underscoring the heterogeneity in clinical outcomes despite elevated Lp(a) [18]. In the context of secondary prevention, most individuals (58.8%) with Lp(a) levels exceeding 150 nmol/l (> 60 mg/dl) remained free of further cardiovascular events in a median follow-up of 4.7 years [19]. These findings indicate the need for improved risk stratification among patients with elevated Lp(a) by exploring modulating factors, such as systemic inflammation, lipid metabolism, and other recognized CVD risk factors, which may determine why elevated Lp(a) leads to clinical events in some individuals but not in others.
Therefore, in this analysis, we aimed to comprehensively investigate which cardiovascular risk factors and concomitant conditions, apart from elevated Lp(a) levels, are associated with atherosclerosis progression and the diagnosis of cardiovascular disease. Furthermore, the study sought to identify potential protective factors, which may decrease the CVD risk attributed to increased Lp(a) concentrations, aiming to better understand the interplay between Lp(a) and other clinical or biochemical determinants in individuals over 50 years of age.
Material and methods
Study population and design
This was a cross-sectional sub-analysis of the prospective STAR (Specialist Care Patients)-Lp(a) study, which included 2,594 consecutive patients referred to two outpatient cardiology clinics [20]. For the present analysis, we selected individuals aged over 50 years with elevated Lp(a) levels (≥ 30 mg/dl), regardless of their cardiovascular risk status. This sub-group comprised individuals diagnosed with cardiovascular disease and those with at least three classical cardiovascular risk factors (CRFs), such as arterial hypertension, diabetes mellitus, dyslipidemia, smoking, and obesity, whereas individuals without CVD diagnosis or any CRFs were included in a healthy comparison group. The cutoff value of 50 years for age was chosen based on data availability, as there was insufficient information on healthy individuals in older age group (i.e., > 60–65 years) obtainable for enrollment.
To assess the impact of additional risk and protective factors in the context of elevated Lp(a), participants with Lp(a) level ≥ 30 mg/dl (≥ 75 nmol/l) were first divided into a wider group. Within this population, a distinct high-risk sub-group with Lp(a) > 50 mg/dl was subsequently identified and analyzed separately.
Within each Lp(a) category, participants over 50 years of age were further stratified into two groups: Group 1: Patient group consisting of individuals with established CVD or ≥ 3 cardiovascular risk factors; and group 2: Healthy group including patients without CVD diagnosis or any evident CRFs, despite elevated Lp(a). This classification enabled analysis of determinants, which may contribute to or protect against atherosclerosis progression in the presence of elevated Lp(a) levels.
Lipoprotein(a) and other variables analyses
The following quantitative variables were analyzed: age, body mass index (BMI), total cholesterol (TC), LDL-C, high-density lipoprotein cholesterol (HDL-C), non-HDL cholesterol, triglycerides (TG), TG/HDL-C ratio, fasting blood glucose (FBG), glycated hemoglobin A1c (HbA1c), homocysteine, creatinine, estimated glomerular filtration rate (eGFR), thyroid-stimulating hormone (TSH), systolic and diastolic blood pressure, and heart rate. Qualitative variables, including sex and comorbidities (i.e., hypertension, hyperlipidemia, asthma, chronic obstructive pulmonary disease, rheumatoid arthritis, sleep disorders, and atrial fibrillation), were defined according to current guidelines described in detail elsewhere [20, 21]. Lp(a) concentration was determined using an enzyme-linked immunosorbent assay.
Statistical analysis
Data were summarized as frequencies and percentages for categorical variables, and as mean ± standard deviation or median for continuous variables, as appropriate. Continuous variables were compared with two-tailed Student’s t-test, and for categorical variables, χ2 test was used. Fisher’s exact test was applied where the expected cell counts were low. Correlations between continuous variables were assessed using Pearson’s correlation coefficient in normally distributed data, while Spearman’s rank correlation coefficient was employed if normality assumptions were not met. Predictors of increasing calcium scores were evaluated using linear regression in all participants as well as separately in groups of patients and healthy individuals. Differences between groups were additionally compared using log-rank test. A p-value < 0.05 (two-tailed) was considered statistically significant. Statistical analyses were performed using SPSS software, version 26.0 (IBM Corp., Armonk, NY, USA) and Stata software (StataNow version 18.5, StataCorp, College Station, TX, USA).
Results
Characteristic of healthy individuals and patients with Lp(a) ≥ 30 mg/dl
The analysis finally included 50 healthy individuals and 295 patients. Patients were significantly older than the healthy group (69.6 ±8.7 vs. 62.8 ±8.7 years, p < 0.001). The proportion of females did not differ significantly between the groups (71.9% vs. 78.0%, p = 0.236). Patients with a higher mean BMI (28.5 ±5.1 vs. 26.9 ±4.5 kg/m2, p = 0.033) had an increased prevalence of overweight (75.2% vs. 68.0%, p = 0.012) and obesity (32.7% vs. 16.0%, p = 0.001). The mean Lp(a) concentrations did not differ significantly between healthy individuals and patients, with values of 65.4 and 72.7 mg/dl, respectively (p = 0.118) (Table I). The prevalence of arterial hypertension reached 79.7%, diabetes mellitus was present in 32.2% of patients, and dyslipidemia in 33.2%. Additionally, 16.9% of patients had a history of coronary artery disease (CAD), and 9.2% had experienced a previous stroke. Lipid-lowering therapy (LLT) was commonly used among patients: 67.8% were treated with statins, while a small percentage received ezetimibe (0.8%), combination therapy (1.5%), or fibrates (1.0%). In terms of laboratory results, patients had significantly higher hsCRP levels (2.35 ±4.7 vs. 2.12 ±2.4 mg/l, p = 0.007), glucose levels (104.8 ±31 vs. 91.8 ±16 mg/dl, p < 0.001), and HbA1c levels (5.86 ±0.8% vs. 5.44 ±0.5%, p < 0.001). LDL-C (103.6 ±43 vs. 140.5 ±34 mg/dl), total cholesterol, and non-HDL-C were significantly lower in the patient group (p < 0.001), reflecting pharmacologic treatment (Table I).
There was a significantly higher CAC score among the patient group compared to the healthy group (339.9 ±543 vs. 43.1 ±99, p < 0.001), with fewer individuals scoring 0 (63.1% vs. 82.0%, p = 0.001), and more with CAC score ≥ 100 (24.7% vs. 4.0%, p < 0.001). Echocardiographic indices demonstrated a trend towards lower left ventricular ejection fraction (LVEF) in the patient group (57.4 ±5.8% vs. 59.8 ±4.4%, p = 0.051), and significantly lower tricuspid annulus plane systolic excursion (TAPSE) (2.49 ±0.25 vs. 2.64 ±0.26 cm, p = 0.013) (Table I).
Table I
Demographic, laboratory, and imaging indices among healthy individuals and patients aged > 50 years and Lp(a) ≥ 30 mg/dl
[i] Healthy – age > 50 years, Lp(a) ≥ 30 mg, Patients – age > 50 years, Lp(a) ≥ 30 mg/l, CRF ≥ 3, AH – arterial hypertension, BMI – body mass index, CHD – coronary heart disease, CAD – coronary artery disease, DM – diabetes mellitus, HR – heart rate, Lp(a) – lipoprotein a, TC – total cholesterol, LDL-C – low–density lipoprotein cholesterol, HDL-C – high–density lipoprotein cholesterol, TG – total triglyceride, CRP – C-reactive protein, TSH – thyroid stimulus hormone, CAC – coronary artery calcium; LVEF – left ventricle ejection fraction, TAPSE – tricuspid annulus plane systolic excursion.
Linear regression analysis of 50+ healthy individuals and patients with Lp(a) ≥ 30 mg/dl
A linear regression analysis was conducted to evaluate the association between selected clinical and biochemical variables and CAC scores. Both univariate and multivariate models were applied across the entire study population (Supplementary Table SI) as well as within two sub-groups of healthy individuals and patients with Lp(a) ≥ 30 mg/dl (Table II, Figure 1).
Table II
Independent predictors of increasing calcium scores in linear regression
Figure 1
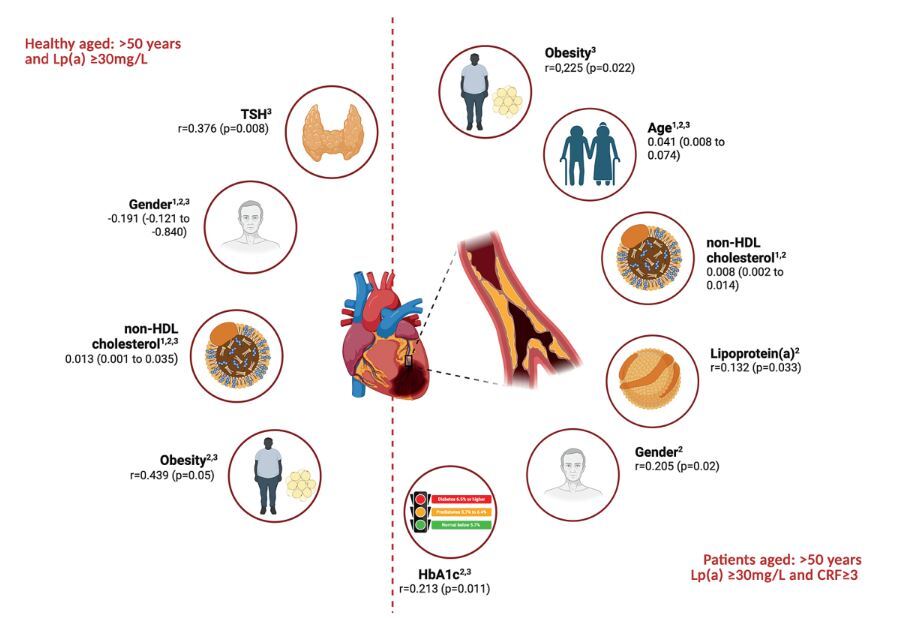
Independent predictors of atherosclerosis progression in healthy individuals and patients aged > 50 years and Lp(a) ≥ 30 mg/dl based on the data from multivariate linear regression analysis (1), and correlation analyses with CAC score (2) and CRP (3)
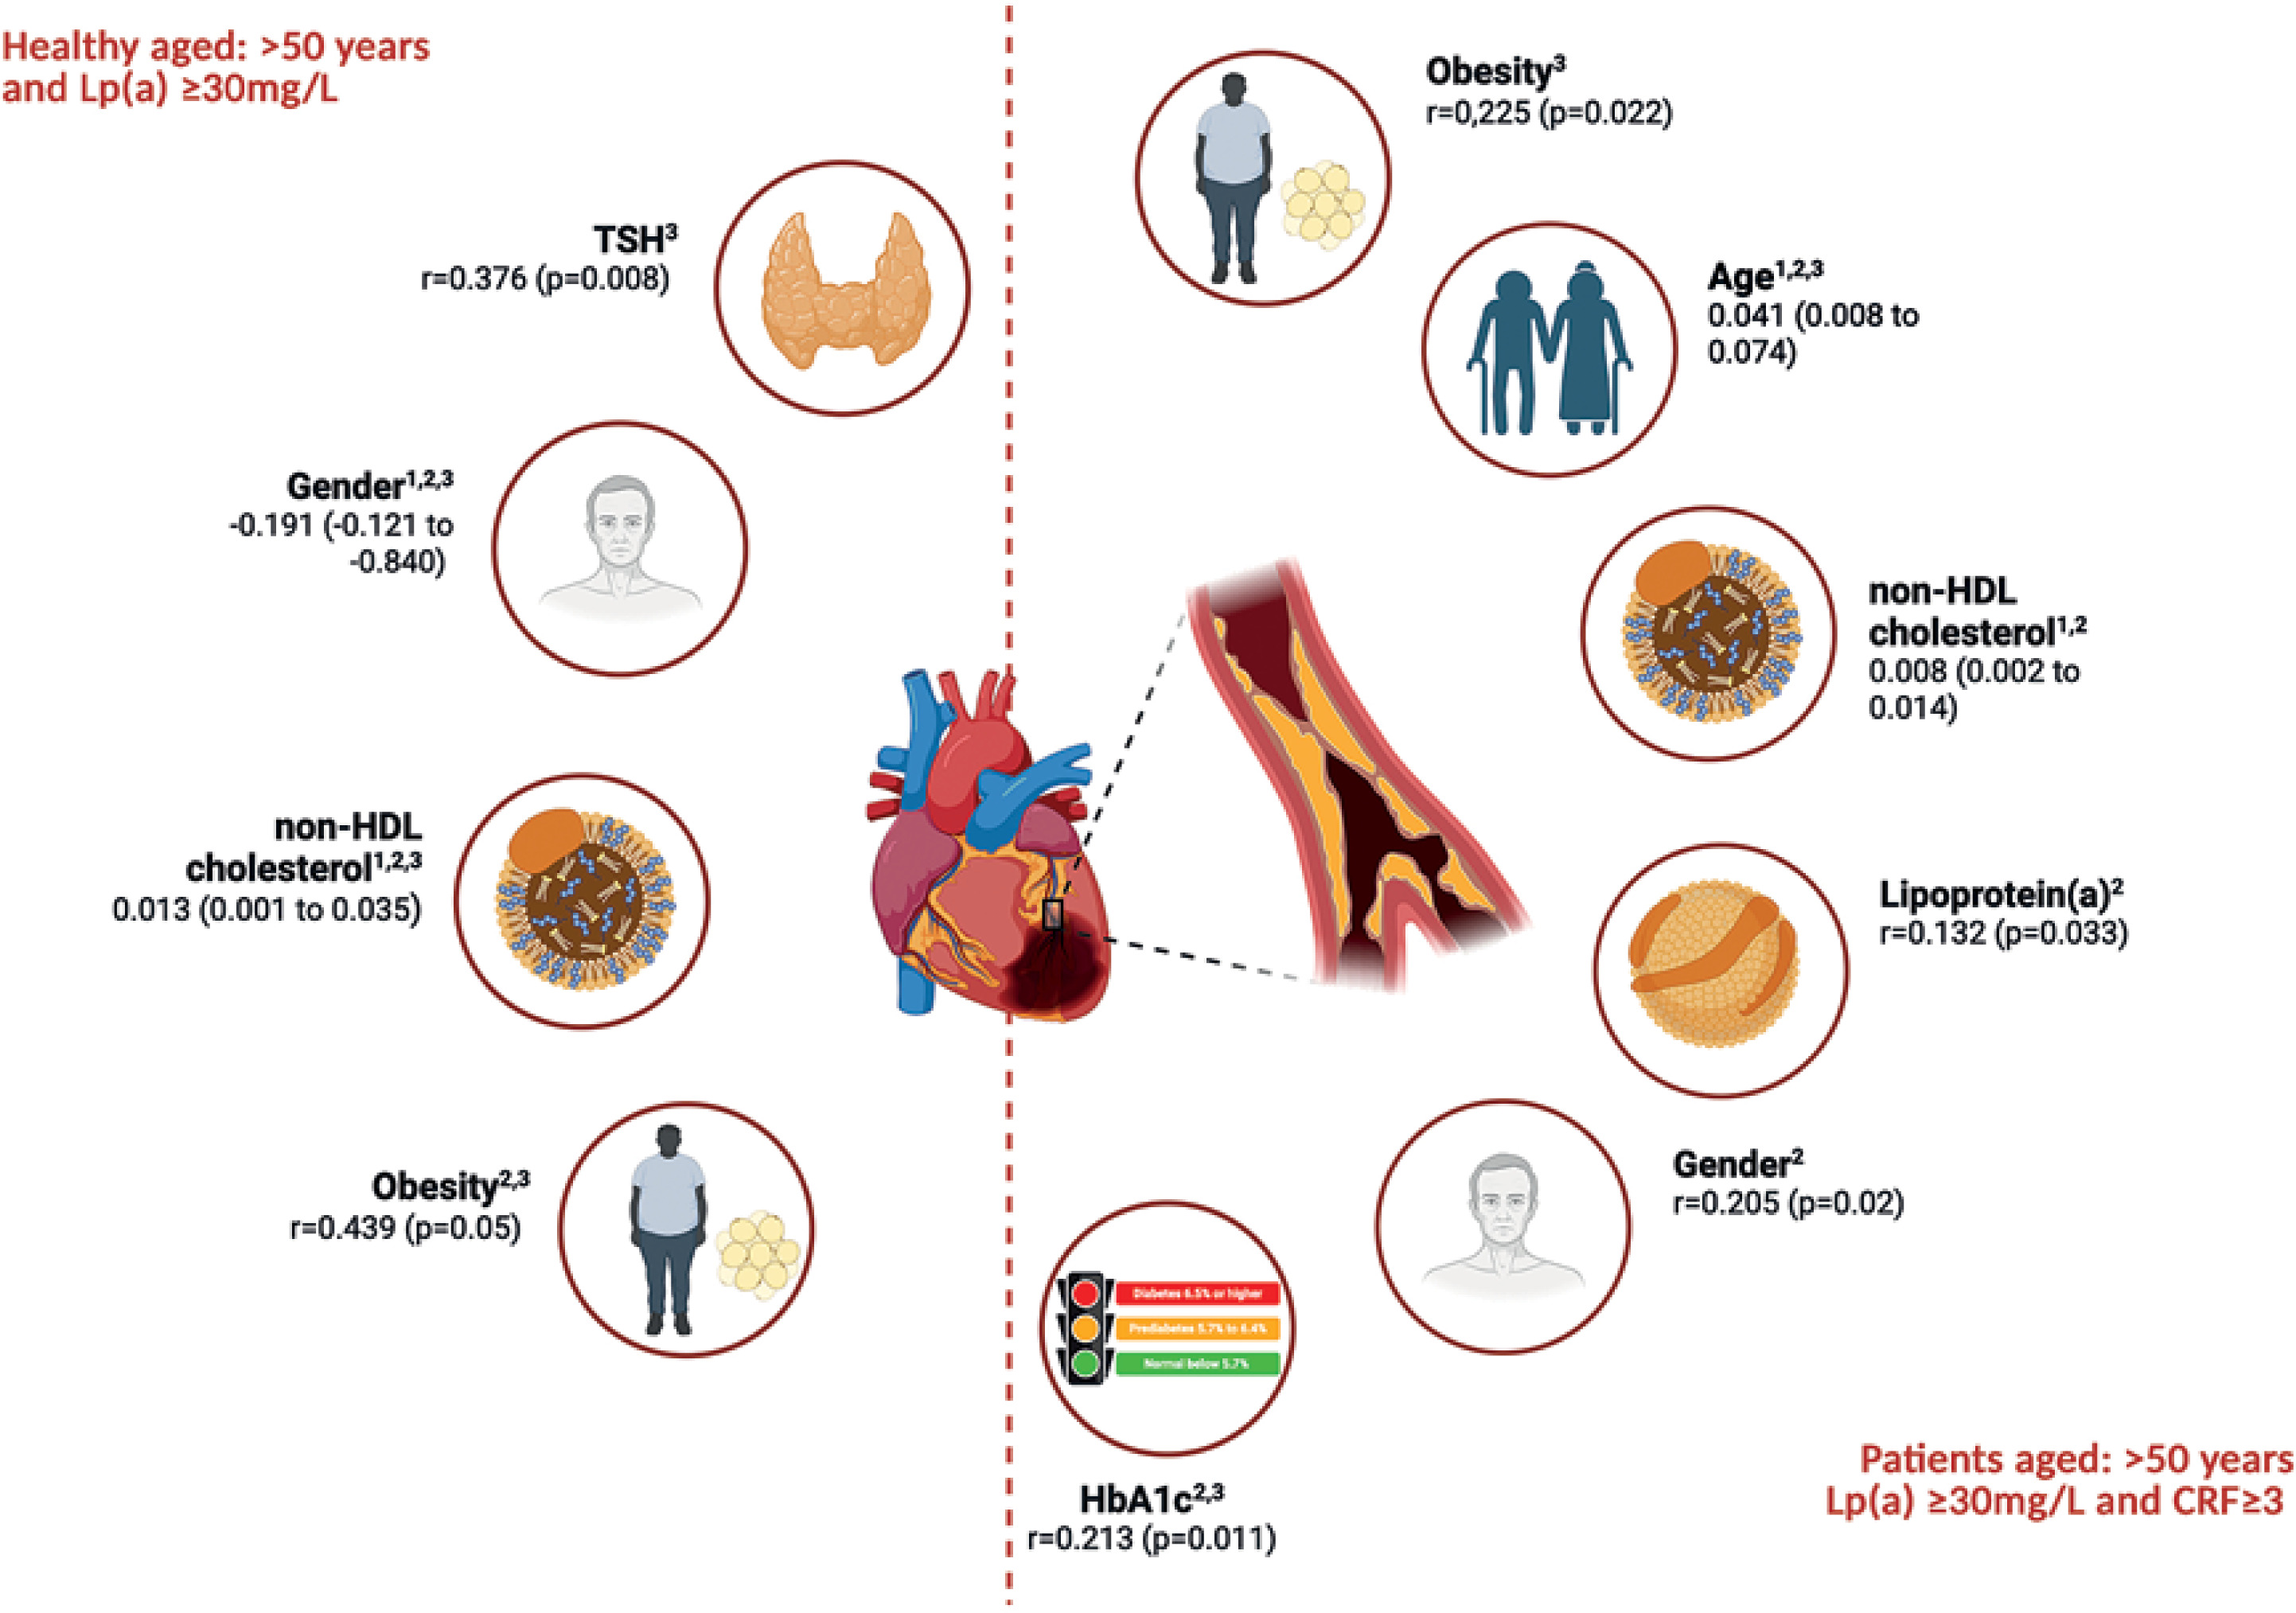
Among healthy individuals, the multivariate regression analysis revealed that non-HDL cholesterol was a significant independent predictor of CAC score (β = 0.013; 95% CI: 0.001–0.035%; p = 0.023). Gender demonstrated a significant inverse association (β = –0.191, p = 0.045), suggesting lower CAC scores in females. In the sub-group of patients, age (β = 0.041; 95% CI: 0.008–0.074%; p = 0.017) and non-HDL cholesterol (β = 0.008; 95% CI: 0.002–0.014%; p = 0.046) were identified as significant predictors of increased calcium scores. No other variables reached statistical significance in the patient group (Table II, Figure 1).
Correlation of CAC score with clinical and laboratory variables
To further explore the relationships between CAC scores and selected clinical or biochemical markers, correlation analyses were performed in both sub-groups (Table III, Figure 1). In the patient group, CAC score showed significant positive correlations with age (r = 0.359, p = 0.001), gender (r = 0.205, p = 0.020), non-HDL-C (r = 0.218, p = 0.025), HbA1c (r = 0.213, p = 0.011), and Lp(a) (r = 0.132, p = 0.033). Among healthy individuals, CAC score correlated significantly with gender (r = –0.343, p = 0.044), indicating lower scores in females as well as with obesity (r = 0.439, p = 0.05) and non-HDL-C (r = 0.554, p = 0.011), with the latter demonstrating a particularly strong association (Table III, Figure 1).
Table III
Correlation of CAC and CRP with demographic and laboratory indices among healthy at risk and patients aged > 50 years and Lp(a) ≥ 30 mg/dl
[i] Healthy – age > 50 years, Lp(a) ≥ 30 mg, Patients – age > 50 years, Lp(a) ≥ 30 mg/l, CRF ≥ 3, Lp(a) - lipoprotein a, non-HDL-C – non-high-density lipoprotein cholesterol, TSH – thyroid stimulus hormone, CAC – coronary artery calcium, hsCRP – high-sensitivity C-reactive protein, TAPSE – tricuspid annulus plane systolic excursion, HbA1c – glycated hemoglobin A1c.
Correlation of CRP with clinical and laboratory variables
CRP level, inflammation biomarker indicating the risk of atheroma plaque formation [22], was significantly correlated with age (r = 0.194, p = 0.043), obesity (r = 0.225, p = 0.022), and HbA1c (r = 0.154, p = 0.005), indicating a trend towards significance with Lp(a) (r = 0.295, p = 0.061) in the patient group. In healthy individuals, significant correlations were observed between CRP and TSH (r = 0.376, p = 0.008) as well as obesity (r = 0.207, p = 0.039), gender (r = 0.225, p = 0.039), and non-HDL-C (r = 0.207, p = 0.033) (Table III, Figure 1). Importantly, no correlation was found between CRP and CAC score in either group, supporting the findings from the multivariate regression analysis, which showed that CRP was not an independent predictor for CAC score changes.
Characteristic of healthy individuals and patients with Lp(a) > 50 mg/dl
In the sub-group of participants with high Lp(a) levels (> 50 mg/dl/125 nmol/l), a total of 227 participants, comprising 200 patients and 27 healthy individuals, were included. The univariate and multivariate models for the entire study population are displayed in Supplementary Table SII.
Patients were significantly older (69.2 ±8.7 vs. 62.3 ±8.9 years, p < 0.001), and the proportion of females in the patient group was lower (68.5% vs. 77.8%, p = 0.021). Lp(a) levels were similar in both groups (88.8 ±32 vs. 87.8 ±21 mg/dl), obesity was more common among patients (31.7% vs. 18.5%, p = 0.001), while BMI and heart rate did not differ significantly between the groups (Table IV).
Table IV
Demographic, laboratory, and imaging indices among healthy individuals and patients aged > 50 years and Lp(a) > 50 mg/dl
[i] Healthy – age > 50 years, Lp(a) > 50 mg, Patients – age > 50 years, Lp(a) > 50 mg/l, CRF ≥ 3, BMI – body mass index, HR – heart rate, AH – arterial hypertension, DM – diabetes mellitus, CAD – coronary artery disease, COPD – chronic obstructive pulmonary disease, hsCRP – high-sensitivity C-reactive protein, Lp(a) – lipoprotein a, TC – total cholesterol, LDL–C – low-density lipoprotein cholesterol, HDL-C – high-density lipoprotein cholesterol, TG – total triglyceride, non-HDL–C – non-high-density lipoprotein cholesterol, HbA1c – glycated hemoglobin A1c, TSH – thyroid stimulus hormone, CAC – coronary artery calcium, LVEF – left ventricle ejection fraction, TAPSE – tricuspid annulus plane systolic excursion.
The burden of CVD comorbidities among patients included arterial hypertension (77.5%), diabetes mellitus (35.0%), dyslipidemia (34.5%), CAD (19.9%), and a history of stroke (7.5%). Statin treatment was reported in 67.4% of patients, whereas combination of lipid-lowering therapy (LLT) was used infrequently (2.2%) (Table IV). In laboratory analyses, patients had significantly better lipid profiles due to baseline treatment (e.g., LDL-C: 105.1 ±45 vs. 154.8 ±34 mg/dl, p < 0.001), and significantly higher glucose and HbA1c levels (p < 0.001 for both). Vitamin D levels were lower in patients (35.2 ±16 vs. 45.3 ±26 nmol/l, p = 0.041). CAC scores were significantly higher in the patient group (328.4 ±572 vs. 53.1 ±116, p < 0.001), with a higher proportion of patients with CAC scores ≥ 100 (14% vs. 7.41%, p = 0.012), and a lower proportion with the “power of zero” (CAC = 0: 62.5% vs. 74.1%, p = 0.001) (Table IV).
Linear regression analysis of healthy individuals and patients with Lp(a) > 50 mg/dl
Among healthy individuals, several factors were significantly associated with CAC scores in univariate analysis (Table V), including gender (β = 0.150, 95% CI: 0.107–0.202%; p < 0.001), obesity (β = 0.123; 95% CI: 0.101–0.204%; p = 0.004), elevated hsCRP (β = 0.176; 95% CI: 0.102–0.252%; p < 0.001), vitamin D levels (β = 1.667; 95% CI: 0.109–0.235%; p < 0.001), non-HDL-C (β = 0.201; 95% CI: 0.108–0.320%; p < 0.001), and Lp(a) (β = 0.159; 95% CI: 0.101–0.268%; p = 0.006). However, in the multivariate model adjusted for potential confounding variables, only two predictors remained statistically significant, including gender (β = 0.106; 95% CI: 0.045–0.203%; p = 0.037) and elevated hsCRP (β = 0.104; 95% CI: 0.033–0.489%; p = 0.013) (Table V, Figure 2). Notably, Lp(a), despite being highly elevated in all individuals in this sub-group by definition, was not an independent predictor of CAC progression after adjustment (β = –0.017, p = 0.337).
Table V
Predictors of increasing calcium scores in linear regression in healthy and patients aged > 50 years and Lp(a) > 50 mg/dl
Figure 2
Independent predictors of atherosclerosis progression in healthy individuals and patients aged > 50 years and Lp(a) > 50 mg/dl based on the data from multivariate linear regression analysis (1), and correlation analyses with CAC score (2) and CRP (3)
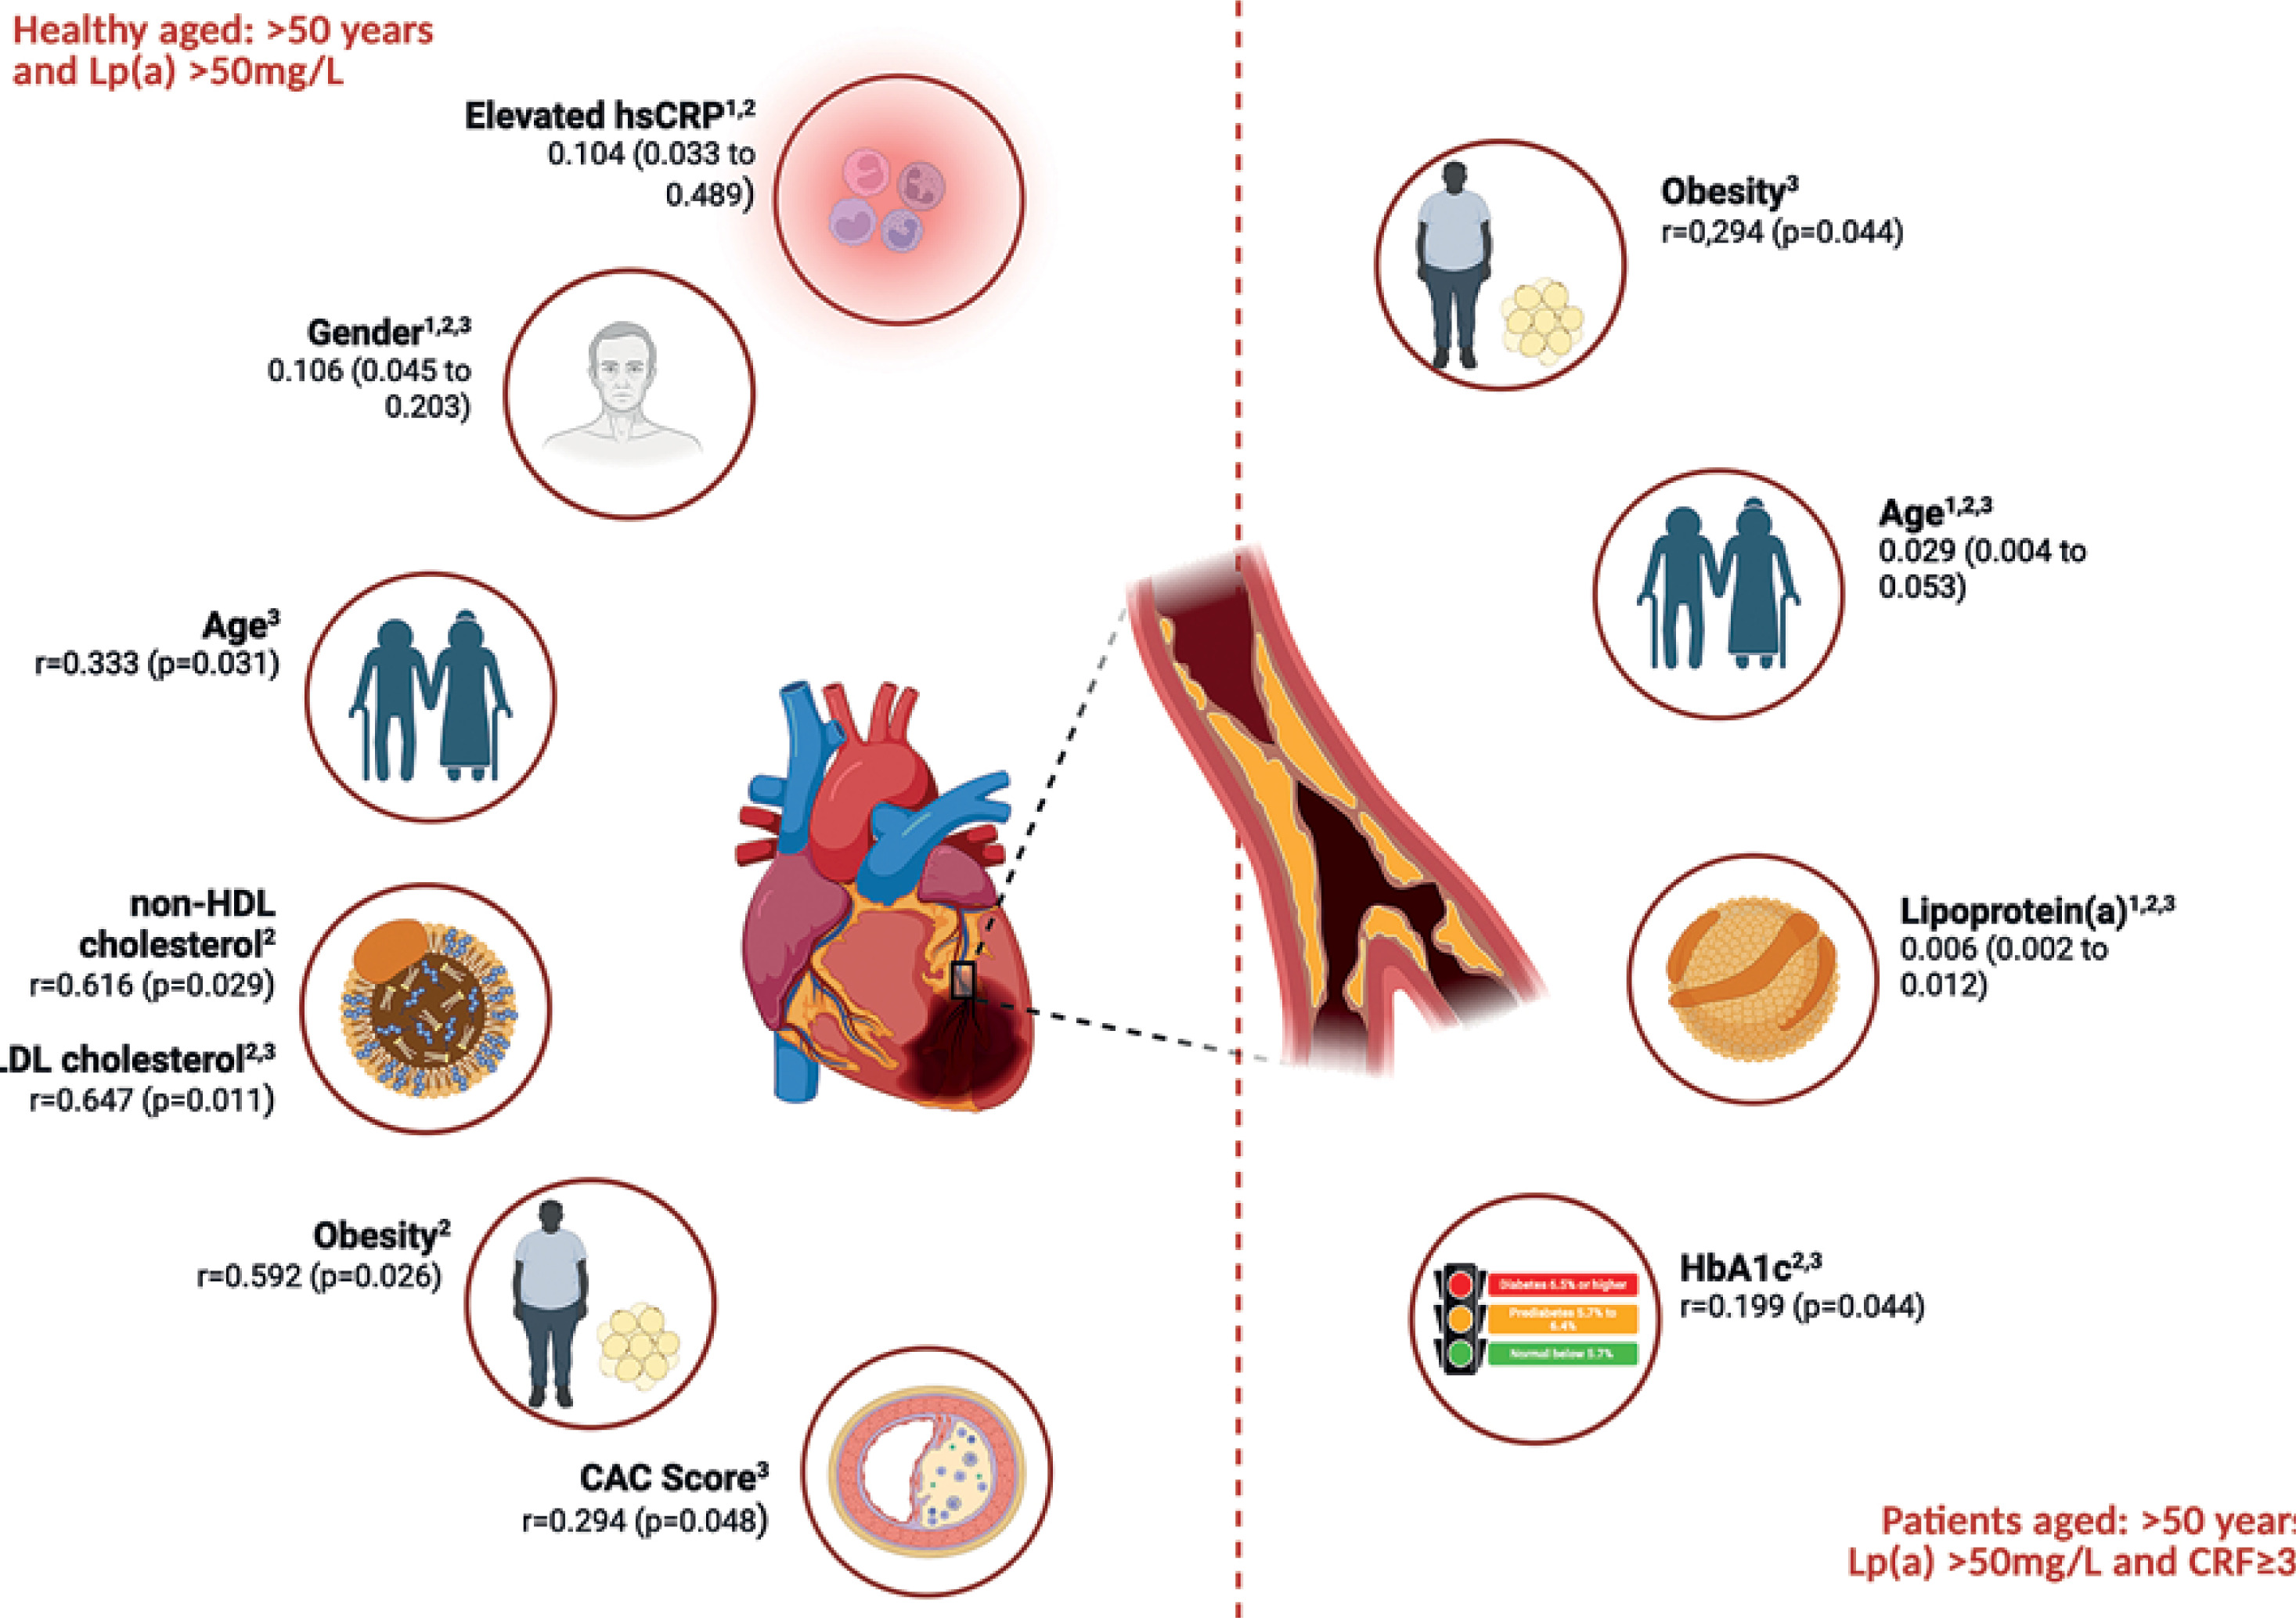
In patients, Lp(a) was a significant predictor of CAC score in both univariate (β = 0.110, p < 0.001) and multivariate models (β = 0.006; 95% CI: 0.002–0.012%; p = 0.041), indicating that Lp(a) > 50 mg/dl independently contributed to calcium score progression in the patient group. Additionally, age remained significant (β = 0.029, p = 0.021), whereas other variables, such as obesity, hsCRP, HbA1c, and non-HDL-C did not show independent associations after adjustment (Table V, Figure 2).
Correlation of CAC score with clinical and laboratory variables
In the correlation analysis among healthy individuals with high Lp(a) levels, CAC was positively associated with obesity (r = 0.592, p = 0.026), LDL-C (r = 0.647, p = 0.011), non-HDL-C (r = 0.616, p = 0.014), and hsCRP (r = 0.294, p = 0.048), while it was negatively associated with gender (r = –0.321, p = 0.045). Among patients, CAC correlated significantly with age (r = 0.418, p < 0.001), HbA1c (r = 0.199, p = 0.044), and Lp(a) (r = 0.319, p = 0.022) (Table VI, Figure 2).
Table VI
Correlation of CAC and CRP with demographic and laboratory indices among healthy at risk and patients aged > 50 years and Lp(a) > 50 mg/dl
CRP correlation with clinical and laboratory variables
In healthy individuals, CRP analysis revealed that it correlated with age (r = 0.333, p = 0.031), gender (r = –0.251, p = 0.048), LDL-C (r = 0.225, p = 0.034), and CAC (r = 0.294, p = 0.048). No correlation was found between CRP and Lp(a) in patients (p = 0.341) (Table VI, Figure 2). In the patient group, CRP significantly correlated with age (r = 0.304, p = 0.032), obesity (r = 0.294, p = 0.044), HbA1c (r = 0.202, p = 0.024), and Lp(a) (r = 0.195, p = 0.038), suggesting a link between inflammation and Lp(a) in individuals at very high-risk of CVD.
Discussion
The primary objective of this study was to investigate additional risk factors and conditions, which contribute to the progression of ASCVD in individuals with elevated Lp(a), and to identify potential protective or mitigating factors, which may decrease its adverse effects. Our results demonstrate that the relationship between Lp(a) and sub-clinical atherosclerosis, as measured by CAC score (and hsCRP), varies substantially according to baseline metabolic health and cardiovascular risk status. In the overall cohort of adults aged over 50 years with Lp(a) ≥ 30 mg/dl, significant univariate associations between Lp(a) and CAC were no longer evident after adjustment for age, non-HDL-C, and other metabolic covariates. This suggests that, at moderately elevated levels, the apparent link between Lp(a) and CAC largely reflects confounding by established cardiometabolic risk factors, rather than an independent causal effect. However, among metabolically healthy individuals without CVD or classical risk factors, CAC burden correlated primarily with inflammatory status (observed in obese individuals) and lipid parameters (non-HDL-C), whereas Lp(a) itself was not an independent determinant. Conversely, in the patient group, Lp(a) correlated significantly with CAC even after multivariable adjustment, alongside other established CVD risk factors, such as non-HDL-C and elevated HbA1c. It is also worth emphasizing the differences in non-modifiable CVD risk factors between the groups, with gender predominating in the healthy cohort and age in the patient group. These findings were confirmed when analyzing healthy individuals and patients aged over 50 years with Lp(a) > 50 mg/dl. Lp(a) was an independent risk factor for atherosclerosis progression only in the patient group. Gender and age as non-modifiable risk factors differentiated the groups, whereas in generally healthy subjects, more classical factors, such as elevated hsCRP and LDL C, significantly increased the risk of atherosclerosis progression.
HsCRP is a well-established biomarker of systemic inflammation, widely used in CVD risk assessment [23]. Several large observational studies have explored whether inflammatory status modifies the cardiovascular risk conferred by elevated Lp(a). Findings from Small et al. [24] and Thomas et al. [25] studies indicate that Lp(a) predicts CVD events independently of hsCRP in both primary and secondary prevention populations. In contrast, Arnold et al. [26], using the BiomarCaRE cohort, found that in individuals without coronary heart disease (CHD) at baseline, the association between Lp(a) and incident CHD was independent of hsCRP, whereas in patients with established CHD, Lp(a) was related to recurrent events only in those with elevated hsCRP, suggesting that inflammation may amplify Lp(a)-mediated risk in secondary prevention. In line with this, data from the MESA (multi-ethnic study of atherosclerosis) study [27] reported that Lp(a)-associated ASCVD risk was more pronounced when hsCRP was concurrently elevated, supporting the “second-hit” hypothesis whereby systemic inflammation potentiates the pathogenic impact of Lp(a). On the contrary, a large meta-analysis by Alebna et al. [28], including over 560,000 participants, showed that elevated Lp(a) increased major adverse cardiovascular event (MACE) risk regardless of hsCRP, underscoring the multifactorial nature of its atherogenic effects. Our analysis in adults over 50 years of age with elevated Lp(a) indicates that Lp(a) was independently associated with atherosclerosis progression (assessed by CAC score) only in the patient group, whereas hsCRP independently increased the risk of atherosclerosis progression in the healthy group only.
Coronary artery calcification is a robust surrogate marker of total atherosclerotic plaque burden, and an established tool for refining CVD risk stratification [29]. In the MESA study [30], both Lp(a) and CAC independently predicted ASCVD events, with the highest risk observed in individuals with both elevated Lp(a) and CAC > 100. Notably, previous analysis of the entire STAR-Lp(a) cohort [31] demonstrated a positive association between Lp(a) concentration and CAC score: per 10 mg/dl (25 nmol/l) increase in Lp(a), CAC score increased by 15.7 (p = 0.006). The present sub-analysis extends these findings by showing that this relationship is not uniform across risk strata; in metabolically healthy individuals, even with high level of Lp(a), the significant association is weak or does not exist after adjusting for age, inflammation, and lipids, whereas in high-risk patients, Lp(a) remains a strong, independent determinant of coronary calcification. Our findings somewhat align with data from the MESA study and the Dallas Heart Study (DHS) [32] as well as emerging evidence from the UK Biobank [17], which demonstrate a general association between elevated Lp(a) concentrations and increased ASCVD risk, although its specific relationship with CAC is less consistent. For example, in the MESA study, elevated Lp(a) was more strongly associated with non-calcified plaque characteristics than with CAC burden, highlighting that calcification may not fully capture the atherogenic effects of Lp(a). Similarly, Sung et al. [33] conducted a large imaging study in asymptomatic adults, and found that Lp(a) ≥ 50 mg/dl was not associated with CAC incidence or progression over time, reinforcing the concept that elevated Lp(a) does not necessarily manifest as increased coronary calcification in low-risk populations. The cohort in our analysis, including cases in secondary prevention, was largely pre-event, with > 60% demonstrating the “power of zero” (CAC = 0) and only 15–25% having CAC > 100.
Further mechanistic insight can be found in the PROSPECT II sub-study by Erlinge et al. [19], which used intracoronary imaging to characterize plaque morphology. This study showed that Lp(a) was not associated with total plaque burden, but was selectively linked to vulnerable, rupture-prone plaques rich in necrotic core and lipid content (i.e., the higher CVD risk, the stranger association). This aligns with the hypothesis that Lp(a) may exert its deleterious effects primarily by promoting plaque instability, rather than calcification per se. The association between Lp(a) and atherosclerosis observed in our data (only in the very high-risk group of patients) may therefore be also explained by several non-atherosclerotic mechanisms through which Lp(a) increases ASCVD risk, including potential pro-thrombotic and pro-platelet effects as well as vascular inflammation mediated by oxidized phospholipids (OxPLs) [34]. OxPLs carried by the apo (a) moiety may be particularly important contributors to the development of non-calcified, high-risk plaques and to acute coronary events [35].
The inflammatory-metabolic modulation of Lp(a) -associated risk observed in our study corresponds to findings from Mohammadnia et al. [36], who in a secondary prevention cohort demonstrated that interleukin-6 (IL-6) amplifies the atherogenic effects of Lp(a) -bound OxPLs. Elevated IL-6 levels were associated with a greater hazard of CVD events, indicating that inflammation acts as a “second hit” required for Lp(a) -driven atherothrombosis. In our cohort, a similar pattern emerged, i.e., Lp(a) was independently associated with CAC only in high-risk patients, whereas in healthy individuals, even in those with very high Lp(a), its effect was attenuated after adjusting for hsCRP and metabolic parameters. This supports the concept that Lp(a) -associated cardiovascular risk is not fixed, but dynamically influenced by inflammatory status and metabolic health.
The potential for lifestyle and behavioral factors to modify Lp(a) -related risk was further illustrated by Razavi et al. [37], who examined over 6,600 asymptomatic individuals, 20% of whom had Lp(a) ≥ 50 mg/dl. They found that an optimal American Heart Association (AHA) Life’s Simple 7 (LS7) cardiovascular health score was associated with a 65% reduction in ASCVD events (HR = 0.35; 95% CI: 0.13–0.99%), regardless of Lp(a) concentration. This supports the growing consensus that elevated Lp(a) does not inevitably lead to clinical disease, and that favorable metabolic, lifestyle, and inflammatory conditions can substantially mitigate its pathogenic potential. Nonetheless, everyone should know own Lp(a) level; for this reason, Lp(a) is now included in the recently released International Lipid Expert Panel SiMple tIps for the heaLthy hEart (ILEP-SMILE) algorithm [38].
From a broader epidemiological perspective, our findings refine the conclusions of Bhatia et al. [39], whose meta-analysis across multiple cardiovascular outcome trials concluded that Lp(a) confers cardiovascular risk independently of LDL-C, justifying the development of targeted therapies. While Bhatia et al. focused on clinical events, such as myocardial infarction and stroke, our study evaluated sub-clinical calcific atherosclerosis, which may represent a late or distinct phase of vascular re-modeling. These findings may also have important clinical implications in the context of the current European Society of Cardiology (ESC) and Polish recommendations [40, 41]. At present, no pharmacologically approved agents are available for routine lowering of Lp(a), although targeted therapies, such as antisense oligonucleotides and small interfering RNA, are employed in advanced stages of clinical development [42, 43]. Consequently, the management of individuals with elevated Lp(a) should focus on aggressive optimization of all other modifiable CVD risk factors, including strict control of blood pressure, LDL-C and non-HDL-C (using high-intensity statins and [upfront] combination therapy as indicated in [44–46]), glycemic status, body weight, and systemic inflammation [41]. Our results reinforce the importance of the following strategy: in metabolically healthy individuals, even those with markedly elevated Lp(a), the absence of additional cardiometabolic stressors appears to substantially attenuate the atherogenic potential of Lp(a), whereas in those with concurrent metabolic or inflammatory risk factors, Lp(a) emerges as an independent driver of coronary artery calcification. These observations underscore the value of early and sustained preventive interventions initiated well before the disease develops overtly, which maintain metabolic balance, promote healthy weight, and suppress low-grade inflammation. Such measures may represent the most effective means currently available to mitigate Lp(a)-related risk, until targeted Lp(a)-lowering therapies become clinically accessible.
One important limitation is the non-randomized, selection-based study design, in which patients with and without cardiovascular risk factors were deliberately recruited into separate groups. While this approach supports hypothesis generation and comparative profiling, it limits causal inference. Therefore, our findings should be interpreted as descriptive and exploratory, rather than definitive proof of risk or protection. The number of participants, especially in the healthy group, may also be considered a limitation.
In conclusion, although Lp(a) is recognized as a strong and independent CVD risk factor in large-scale studies, our findings based on RWE data suggest that its role in promoting vascular calcification is conditional and context-dependent. Among healthy individuals, even with elevated Lp(a), CAC progression was more closely related to traditional risk factors, such as gender, non-HDL cholesterol, obesity, and low-grade inflammation (hsCRP). In this group, Lp(a) was not an independent predictor of calcification and did not correlate with CAC in multivariable analysis. In contrast, among patients, especially in those with Lp(a) > 50 mg/dl, Lp(a) emerged as a significant and independent predictor of coronary calcification, indicating that its pro-atherogenic effects are likely amplified by the presence of additional metabolic or inflammatory disturbances.
These findings support a multifactorial model of atherosclerosis, in which Lp(a) acts as a potentiator of risk in already vulnerable vascular environments, rather than as a dominant, standalone driver of calcification. Taken together, our results highlight the importance of individual cardiovascular risk profiling when interpreting elevated Lp(a) levels. Optimally targeting coexisting modifiable factors, such as lipid abnormalities, inflammation, and glucose metabolism, as early as possible, may offer effective strategies to mitigate the vascular risk posed by high Lp(a) concentration, particularly in primary prevention.