Introduction
A progressive condition, chronic kidney disease (CKD) accounts for a high proportion of deaths worldwide [1]. It is defined as a decline in kidney function, manifested by a glomerular filtration rate (GFR) below 60 ml min–¹ per 1.73 m2 or the presence of kidney injury markers (or both) for a period of at least 3 months [2, 3]. The estimated global incidence of chronic renal failure ranges from 11% to 14% [4]. As the underlying cause of chronic renal failure and uraemia, chronic renal failure accounts for approximately 1.2 million deaths annually [5]. A rapid decline in estimated glomerular filtration rate (eGFRcrea) and an elevated urine albumin-creatinine ratio (UACR) are key indicators of progressive and severe CKD [6], reflecting substantial loss of kidney function. To capture clinically meaningful deterioration, we used two stringent definitions: (1) a decline of ≥ 3 ml/min/1.73 m2/year (Rapid3), indicating sustained and accelerated kidney function loss; and (2) a ≥ 25% drop in eGFRcrea during follow-up with a final eGFRcrea < 60 ml/min/1.73 m2 among individuals initially above 60 ml/min/1.73 m2 (CKDi25), representing a major transition toward advanced CKD stages and increased risk of end-stage renal disease. Observational studies have shown that a variety of factors contribute to CKD, including diabetes mellitus, hypertension, cardiovascular disease, and intestinal flora disorders [7, 8]. Therefore, the identification of additional reliable risk factors is essential for the identification and early prediction of CKD.
Research indicates that an unbalanced oral microbiota (i.e., dysbiosis) may be involved in the onset and development of CKD [9]. The oral cavity serves as one of the most significant interfaces of the body with the environment. The microenvironments of various oral regions harbour distinct microbial compositions, modulated by intricate signalling pathways and influenced by both host and environmental factors [10]. The dynamic oral microbiome cooperates with the host to reflect immune and metabolic information and status through bidirectional communication along the oral cavity and systemic organs [11]. Gut flora may be a key mechanism contributing to the development of CKD, and periodontal microorganisms are involved in the ‘gut-kidney axis’ because they influence the composition of the gut microbiota [12]. For example, research indicates that patients with CKD exhibit increased oral microbial diversity compared to healthy controls, and cross-regional validation has been achieved [13]. Some scholars have modelled the dynamic changes in the oral microbiota of CKD patients through alterations of salivary urinary urea concentrations [14]. There was also a significant difference in the composition of the oral microbiome between patients with CKD on haemodialysis phase 5 and healthy control patients [15]. It is worth noting that these observational studies may be constrained by sample size limitations and possible confounding factors. However, it is unclear whether patients with CKD benefit from controlled interventions with oral microbiota, especially in the general population. Therefore, it is worthwhile to evaluate its potential as a target for preventive interventions in CKD and to investigate its aetiological role in CKD.
Mendelian randomisation (MR) is a proposed methodology grounded in Mendel’s first and second laws of inheritance (namely the laws of segregation and independent assortment). The majority of MR studies employ genetic variants significantly correlated with exposure as instrumental variables (IVs) to evaluate the association between genetic prediction of exposure and outcomes [16]. MR-based study designs allow for the investigation of many exposures that are not amenable to randomized controlled trial (RCT) studies [17]. For example, Mazidi et al. concluded through a MR study that there was no significant association between coffee consumption and renal function or chronic kidney disease [18]. However, the relationship between oral microbiome and CKD, including eGFR, UACR, Rapid3, CKDi25 and dialysis, using the MR method has not yet been investigated. Therefore, in this study, we applied an MR analysis to investigate the causal relationship between 43 oral microbiome and CKD.
This study aimed to better serve patients affected by CKD by overcoming the problem of confounding bias, which is common in conventional observational research, thus offering more robust inferences regarding causality.
Material and methods
Study design
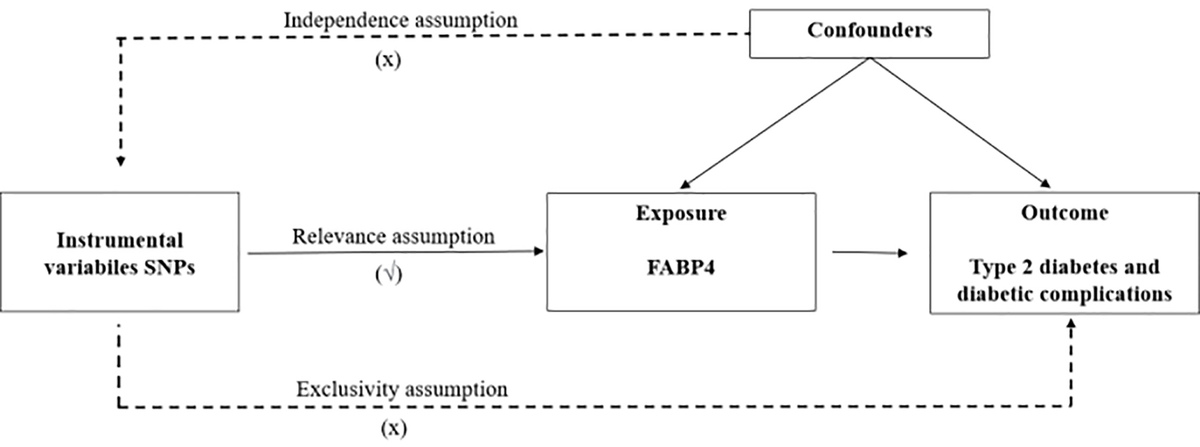
MR analysis employs genetic variants as IVs in an IV analysis framework. The MR analysis has three important assumptions (Figure 1). Firstly, the genetic variants used as IVs must exhibit a robust and consistent relationship with the exposure of interest. Secondly, these genetic variations should remain independent of any confounding factors, ensuring their purity as proxy measures. Lastly, it is assumed that these selected genetic variants influence the risk of the outcome exclusively through the target risk factors, without any interference from alternate pathways. Since the GWAS data included in our research are openly published, no additional ethical approvals were required.
Data source
The genome-wide association studies (GWAS) summary dataset for CKD (GCST008065), eGFR (GCST90103634) and UACR (GCST008794) were obtained from the GWAS Catalog of European ancestry. The GWAS summary of CKDi25 and Rapid3 were obtained from CKDGen Consortium [19]. GWAS data for 43 oral microorganisms were obtained from Stankevic et al. [20]. In brief, saliva samples were collected from 786 participants at the Steno Diabetes Centre in Denmark, followed by DNA extraction and 16S rRNA gene amplicon sequencing, with subsequent taxonomic classification of the sequences. Bacterial taxa present in over 100 participants with a median sequence count exceeding 50 were analysed. To minimise redundancy, filtered taxa were clustered based on similarity, ultimately yielding 43 clusters. Detailed information on the GWAS summary data of the exposures and outcomes is provided in Table I.
Table I
GWAS data for exposure and outcomes
IV selection
MR studies use single nucleotide polymorphisms (SNPs) associated with the exposure as IVs. The IVs included in this study met the following criteria: First, SNPs significantly associated with the oral microbiome in the entire genome were screened using the following criterion: p < 5 × 10⁻⁶ [21]. Following the initial screening, the researchers imposed a minor allele frequency (MAF) threshold of 0.01 on the SNPs of interest. This step aimed to filter out SNPs that were too infrequent in the population, as they may not provide sufficient statistical power for the analysis. Addressing the issue of linkage disequilibrium (LD) among SNPs was the next crucial step. LD, a phenomenon where certain SNPs tend to be inherited together, could introduce bias into the results. Therefore, SNPs with strong LD were excluded from the analysis, using an r2 threshold of less than 0.001 and a clumping distance set at 10,000 kb to ensure independence among the remaining SNPs. Fourth, if there is no corresponding SNP in the obtained GWAS, the proxy SNP with a higher LD relationship with the missing SNP is selected using the criterion that R2 is greater than 0.8 [22]. To further refine the analysis and exclude potential weak instrumental biases between the IVs and exposure factors, the researchers calculated F-values for each SNP in the IVs. The F-value assesses the strength of the IVs by quantifying the proportion of exposure variance explained by the SNPs. The formula used was F = R2 × (N – 2)/(1 – R2), where R2 represents the proportion of exposure variance and N is the sample size. The requirement for a significant F-value was set at > 10 [23], ensuring that only strong IVs were included in the final analysis. Through these rigorous steps, the researchers were able to conduct a comprehensive and reliable MR analysis, shedding light on the complex relationships between SNPs and various health outcomes. Their meticulous approach ensures that the results provide valuable insights into the genetic basis of disease and inform future research and clinical practices.
MR analysis
For features involving multiple IVs, this study employed four widely used MR methods, with the random-effects inverse variance weighted (IVW) approach serving as the primary technique [24], and MR-Egger regression [25], weighted median method (WM) [26], and weighted mode methods [27] as supplementary methods. The IVW method consolidates the Wald ratio estimates of causal effects from multiple variants, assuming all IVs are valid [28]. The implementation of these sophisticated MR techniques was facilitated by the “Two Sample MR” package in R version 4.0.5. This software enabled us to conduct rigorous and reproducible analyses, ensuring the robustness of our results. To enhance the interpretability of our findings, we visualized the MR results using scatter plots and forest plots. These graphical representations allowed us to visually assess the distribution of causal effect estimates across different genetic variants, thus gaining deeper insights into the potential causal relationship between the oral microbiome and CKD.
Sensitivity analysis
A sensitivity analysis was performed to detect potential heterogeneity and horizontal pleiotropy in MR studies. Cochran’s Q test was used to assess heterogeneity among IVs; p > 0.05 indicates low heterogeneity, which means that IV scores were randomly distributed among IVs, indicating that heterogeneity had little effect on the IVW results [29]. Given the possible influence of inherited variation on estimates of the effect size, MR-Egger regression was employed in this study to investigate the existence of horizontal pleiotropy [30, 31]. If the MR-Egger regression interception approaches zero or is statistically insignificant, it means no pleiotropic effect exists. Furthermore, the MR-PRESSO method was employed to identify potential outliers (i.e., SNPs with p < 0.05) and reassess causality after excluding these outliers to correct for horizontal pleiotropy [31]. Funnel plots and leave-one-out plots were used to estimate the consistency and stability of the results.
Results
IV selection
In this study, 267 IVs related to 43 Phylum Firmicutes were screened. All F-values are greater than 10. When MR analyses were performed with the 6 CKD indicators as outcomes, all were matched to information in the summary data. All SNPs in outcomes summary data are shown in Supplementary Table SI.
Causal association between oral microbiome and CKD
The results showed that Veillonella species was causally associated with CKD (OR = 0.96, 95% CI (0.93–0.99)); Order Fusobacteriales (OR = 1.01, 95% CI (1–1.01)) and Rothia species (OR = 0.99, 95% CI (0.99–1)) were causally associated with UACR; Order Bacteroidales (OR = 0.97, 95% CI (0.94–1)) and Species micronuciformis (OR = 0.95, 95% CI (0.91–0.99)) were causally associated with CKDi25; and Streptococcus species was causally associated with dialysis (OR = 0.82, 95% CI (0.69–0.97)) (Table II). The scatter plots and forest plots of positive results are shown in Figures 2 and 3. The scatter plot shows that the risk of developing CKDi25 decreases with increasing levels of Order Bacteroidales and Species micronuciformis; the risk of CKD, UACR and dialysis decreases with increasing levels of Veillonella species, Rothia species and Streptococcus species, respectively; and the risk of UACR was elevated with increasing levels of Order Fusobacteriales (Figure 2). Similarly, forest plot composite lines for Veillonella species, Rothia species, Order Bacteroidales, Species micronuciformis, and Streptococcus species are located to the left of zero, suggesting a significant negative causal relationship between these oral microorganisms and the outcome. Furthermore, the forest plot composite line for Order Fusobacteriales lies to the right of 0, indicating a significant positive causal relationship with UACR (Figure 3). However, no causal association between other oral microorganisms and CKD were found using IVW and the other three methods (MR-Egger, WM, and weighted mode) (Supplementary Table SII).
Table II
Relationship between oral microbiota and CKD (positive results)
Sensitivity analysis
Furthermore, MR-Egger regression emphasizes the effect of horizontal pleiotropy on oral microorganisms, and MR-Egger regression in the present research indicates that this analysis is unaffected by horizontal pleiotropy (Tables III and Supplementary Table SIII). The reliability of intravenous dosing outcomes is demonstrated by Cochran’s Q test and funnel plot, which indicate low heterogeneity among oral microbial intravenous dosages (Table III and Supplementary Figure S1). Moreover, MR-PRESSO analyses showed no outliers (Supplementary Table SIV). Additionally, the funnel plot indicates no observable level of directionality in terms of results (Supplementary Figure S1). Furthermore, the sensitivity analysis plot demonstrates that none of the SNPs are potentially confounding the causal relationship, thereby lending credibility to our conclusions (Supplementary Figure S2).
Table III
Tests for horizontal pleiotropy and heterogeneity (positive results)
CKD – chronic kidney disease, UACR – urinary albumin-to-creatinine ratio.
Discussion
We found that high levels of Order Bacteroidales and Species micronuciformis were negatively associated with CKDi25, Order Fusobacteriales was positively associated with UACR, while high levels of Veillonella species, Rothia species, and Streptococcus species were negatively associated with CKD, UACR and dialysis, respectively. This study not only deepens our understanding of the pathogenesis of CKD, but also provides new targets for precision medicine, promotes the development of preventive and therapeutic strategies for related diseases, and facilitates interdisciplinary collaboration and research.
Veillonella is a common genus of parasitic bacteria found in the human oral, respiratory and digestive tracts. Some studies have suggested that Veillonella may be beneficial to oral health by converting acidic products produced by other bacteria into less acidic products that help slow down the rate of tooth decay [32]. MR findings suggest that Veillonella strains may act as a protective factor against CKD. We suggest that this is related to the anti-inflammatory and immunomodulatory effects of Veillonella spp. On the one hand, short-chain fatty acids, such as butyrate, produced by Veillonella spp. can inhibit the production of pro-inflammatory cytokines and attenuate the inflammatory response of CKD; on the other hand, Veillonella spp. may regulate the balance of T-cell subpopulations and promote the differentiation of anti-inflammatory Treg cells [33], thus reducing autoimmune responses and protecting the kidneys from damage. Similarly, it has been shown that CKD patients have a significantly lower number of Veronica spp. in the oral cavity compared to controls [34]. However, the exact mechanism still needs to be further investigated. Although the clinical study reported an enrichment of Neisseria in patients with CKD [34], our MR analysis failed to uncover evidence of causality. This discrepancy may reflect reverse causality, wherein CKD-associated alterations in the oral environment facilitate Neisseria colonisation. In contrast, the protective association with Veillonella warrants further investigation as a potential mediator of systemic oral health.
Fusobacteriales are Gram-negative anaerobic bacteria commonly found in the oral and gut microbiota [35], with some species linked to periodontal and intestinal inflammatory diseases [36]. Although no direct association with UACR has been established, our MR analysis suggests that Fusobacteriales may increase UACR risk. Potential mechanisms include induction of systemic inflammation via pro-inflammatory molecules such as LPS [37], leading to glomerular injury, and bacterial metabolites that promote renal oxidative stress and apoptosis, potentially impairing kidney function. Rothia spp. are a common group of oral bacteria that are usually considered harmless commensals [38]. MR results suggest that Rothia spp. may be a protective factor for the UACR. However, there is a lack of in-depth research on the specific mechanism of the relationship between Rothia species and kidney health. We speculate that, on one hand, Rothia spp. may protect the kidney by inhibiting the inflammatory response and reducing urinary albumin excretion; on the other hand, Rothia spp. may improve renal function by regulating the metabolic status of the host [39]. Future studies may need to further explore how Rothia species affect renal function and UACR levels.
Bacteroidales is an important order of bacteria in the gut microbial community that includes a wide variety of bacteria associated with gut health and disease [40]. Species micronuciformis may be one of the bacteria in this order. Studies have shown that Bacteroidia as a protective effect is most variable in patients with stage 4-5 CKD [41]. In the current study, these two microbes were found to be protective factors for CKDi25, a specific type or stage of CKD. This could mean that these bacteria improve kidney function by modulating inflammatory responses and metabolism (e.g., secretion of short-chain fatty acids for anti-inflammatory and immunomodulatory purposes; by influencing glycaemic control and lipid metabolism, thereby improving renal function) [42], or they may indirectly affect kidney health by modulating the gut microbial community (i.e., the gut–kidney axis) [43]. Streptococcus species are common in the oral and intestinal microbiota, including a wide range of bacteria that are both beneficial and harmful to humans. The present MR study suggests that Streptococcus species may be a protective factor for dialysis. This may indicate that these bacteria have some protective effect on renal function or that they are able to attenuate certain adverse effects during dialysis. However, it is important to note that some Streptococcus species may also cause infections and other health problems [44]. Therefore, the potential risks and benefits of Streptococcus species need to be carefully considered in further research and application as a protective factor in dialysis.
We posit that the causal link between oral microbiome and CKD aids in identifying low-risk subjects and facilitates early detection and surveillance. Good oral hygiene and regular dental care can mitigate harmful oral microorganism buildup, potentially slowing CKD progression [45]. However, there are some limitations in this study that are of concern and may affect the interpretation of the results. The use of aggregated statistical data instead of person-level data limits the capacity for detailed analysis, such as distinguishing between stages of kidney disease or examining non-linear relationships. The analysis is further limited by the genus-level resolution of the exposure dataset, which precludes exploration of causal relationships between specific oral microbiome species and CKD. In addition, the GWAS data employed in this study predominantly comprise European populations, which may introduce confounding effects from population stratification, thereby limiting the generalisability of the results to other racial groups. Finally, while this research explored potential causal relationships between the oral microbiome and CKD, it did not investigate in depth the specific mediators through which such relationships might operate. Future MR studies should address these limitations in order to more fully understand the causal relationship between the oral microbiome and CKD.
In conclusion, we performed MR analysis of the putative causal relationship between oral microbiome and CKD. These findings highlight the strong association between oral microbiome and CKD.