Introduction
Hypertension is an independent risk factor for several clinical diseases and a controllable indicator of disease-related mortality [1]. Therefore, it has been listed as a global prevention target by the World Health Organization [2]. The number of people with hypertension worldwide is estimated to exceed 1.5 billion by 2025 [3]. Hypertensive renal damage (HRD) is a serious complication of hypertension. Long-term hypertension leads to renal vascular endothelial injury, glomerulosclerosis, and podocyte foot process effacement, resulting in renal fibrosis and increased risk of end-stage renal failure (ESRD) [4–6]. Therefore, it is important to effectively control HRD to delay its progression. Currently, angiotensin-converting enzyme inhibitors (ACEI), calcium channel blockers (CCBs), and diuretics are the main drugs used in the clinical treatment of hypertension [7, 8]. However, these drugs often have use-limiting side effects, including dry cough, lower limb edema, and enhanced sympathetic activity [9]. In addition, their effectiveness is limited. A data survey from Eastern European countries showed that after long-term antihypertensive treatment (including two or more antihypertensive drugs), only 30.8% of patients experienced effective hypertension control [10].
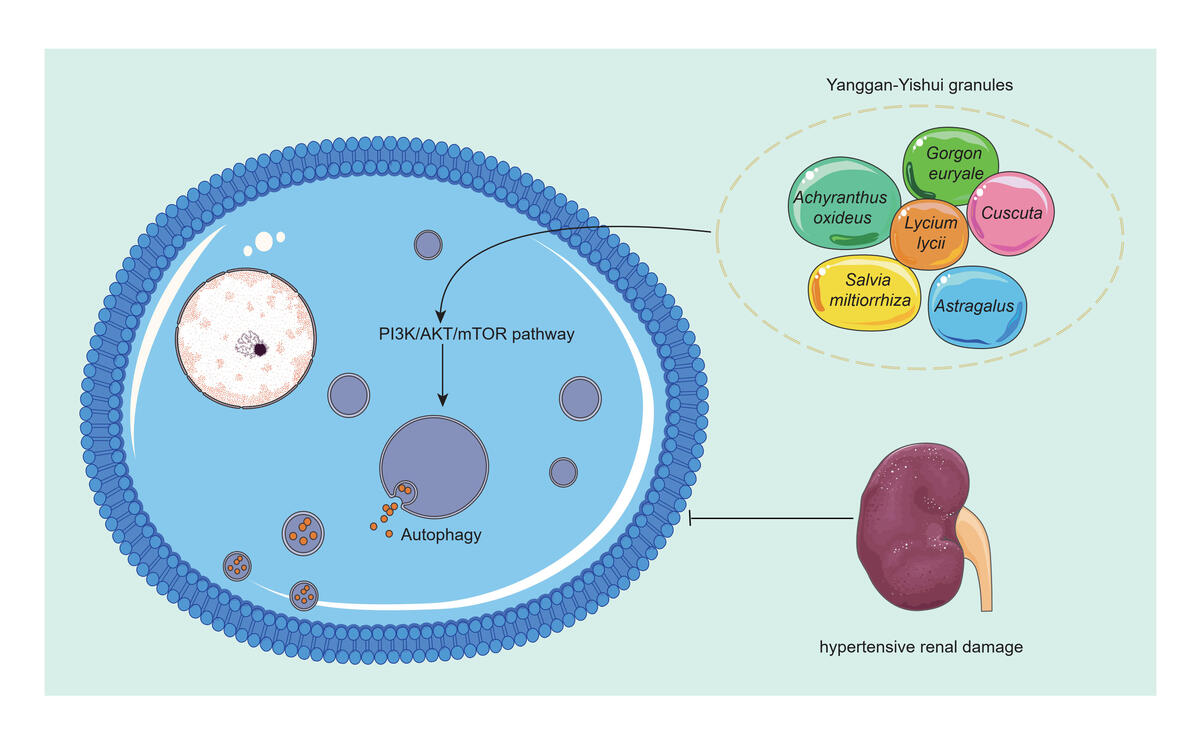
Owing to its long history and theoretical basis, traditional Chinese medicine (TCM) has played a significant role in the treatment of many diseases [11] including hypertension [12, 13]. Yanggan-Yishui granules (YGYSG) were developed by Professor Zhou Yixuan, a renowned TCM practitioner in Anhui Province. These granules have been used clinically for over 20 years and have shown a remarkable effect on hypertensive kidney injury [14]. Clinical studies have demonstrated that YGYSG can improve patient symptoms, reduce the excretion of urinary microalbumin associated with early hypertensive renal damage, and enhance antihypertensive effects while reducing multiple cardiovascular risk factors [15, 16]. Existing research indicates that YGYSG exerts renal protective effects by inhibiting the AngⅡ/TRPC6/NF-κB pathway, thereby treating early hypertensive renal damage [17]. Additionally, YGYSG regulates the levels of TGF-β, PIK, and PKB in renal tissues, inhibiting early renal damage caused by hypertension [18]. YGYSG is composed of six Chinese herbs: Salvia miltiorrhiza, Lycium lycii, Astragalus, Achyranthus oxideus, Gorgon euryale, and Cuscuta. Studies have found that S. miltiorrhiza can regulate autophagy in podocytes through the phosphoinositide 3-kinase (PI3K)/protein kinase B (AKT)/mammalian target of rapamycin (mTOR) signaling pathway [19] and that Astragalus also exerts its effects by regulating inflammation and autophagy [20].
Autophagy is a biological process through which cells maintain the stability of their internal environment by degrading discarded organelles. Under physiological conditions, autophagy protects renal cells and participates in the regulation of kidney diseases [21, 22]. However, in long-term hypertension, excessive autophagy damages renal podocytes and blood vessels, resulting in podocyte death and accelerating the development of HRD [23, 24]. Therefore, identifying and regulating autophagy-related targets and signaling pathways in renal podocytes is key to effective disease therapy. Currently, activation of the renin-angiotensin-aldosterone system (RAAS) is considered the key pathogenesis of HRD. In the state of hypertension, the RAAS is activated and induces angiotensin II (Ang II) to increase blood pressure. Ang II expression is particularly evident in the kidneys; if its expression is abnormal, renal podocytes can easily be damaged [25, 26]. Autophagy is closely related to Ang II activity in the kidney, and it has been found that Ang II increase can upregulate the expression of autophagy in the kidney [27]. However, the underlying mechanism requires further investigation.
In this study, we identified possible targets and signaling pathways of YGYSG’s modulation of the autophagy pathway through network pharmacological analysis. We then verified these findings using molecular docking technology and in vitro experiments. This provides evidence for the use of YGYSG in the treatment of HRD.
Material and methods
Screening of YGYSG, HRD, and autophagy targets
The drug composition of YGYSG was determined using the Traditional Chinese Medicine Systems Pharmacology Database (TCMSP) platform (https://lsp.nwu.edu.cn/tcmsp.php) [28], and screening criteria were set as oral availability (OB) ≥ 30% and drug-likeness (DL) ≥ 0.18; after obtaining the active ingredients, single drug targets were searched by drug MOL.ID number [29]. HRD and autophagy targets were obtained from GeneCards (https://www.genecards.org/) and OMIM (https://www.omim.org/) databases, respectively. The keywords ‘hypertensive renal damage and autophagy’ were entered into a disease database for retrieval, and the targets obtained from the two databases were combined. Finally, target names were converted using the UniProt database (https://www.uniprot.org). The Venny website (https://bioinfogp.cnb.csic.es/tools/venny/) provides access to the active ingredients in medicines, HRD, and common autophagy targets. These proteins can be used as key targets of YGYSG to treat HRD via the modulation of autophagy.
Construction and analysis of the protein interaction network (PPI) in the treatment of HRD using YGYSG
The common protein-protein interaction (PPI) network of YGYSG, HRD, and the autophagy pathway was constructed using the STRING platform (https://string-db.org/) and the species was set as Homo sapiens. To ensure the reliability of the study, the confidence level was set to 0.9, and the other parameters were set to their default values. Cytoscape (version 3.9.0) software was used to import the TSV files and map the protein interaction network. A topological analysis was performed on the network. The degree value represents the size and color of the target. Component-target, core component-target-disease, and YGYSG core target pathway networks were constructed.
Gene Ontology (GO) and Kyoto Encyclopedia of Genes and Genomes (KEGG) enrichment analysis
GO and KEGG analyses were performed using the Metascape (https://metascape.org/) database, with the screening criterion set at p < 0.05. The Microscopic Letter platform (http://www.bioinformatics.com.cn/) was used to generate visual images.
Active ingredients-target molecular docking
For key component selection and molecular docking, the core targets of molecular docking small-molecule composition were identified using the TCMSP (https://old.tcmsp-e.com/) database and macromolecular proteins using the AlphaFold database (https://alphafold.ebi.ac=/). The protein crystal structure was dehydrated and hydrogenated using AutodockTools, and the receptor structure was prepared. OpenBabel and AutoDock were used to split the small-molecule library. Docking simulations were performed using Autodock software, and the results were imported into PyMOL for visualization.
Drugs and reagents
YGYSG was provided by the Pharmacy Department of the First Affiliated Hospital of the Anhui University of Chinese Medicine. Salvia miltiorrhiza, Lycium lycii, Astragalus, Achyranthus oxideus, Gorgon euryale, and Cuscuta are Chinese herbal medicines. The granules were ground into an ultrafine powder and dissolved in a normal saline solution (PSS) to prepare a 100% stock solution (i.e., 1.0 g of powder per mL of PSS). The positive control drug benazepril (10 mg) was provided by the Pharmacy Department of the First Affiliated Hospital of Anhui University of Chinese Medicine. Ang II (5 mg) was purchased from Anhui Yingmai Biological Co. Ltd (Anhui, China). Fetal bovine serum (FBS) and HyClone High Sugar Dulbecco’s Modified Eagle’s Medium (DMEM) were purchased from Gibco (Grand Island, NY, USA). The Cell Counting Kit-8 (CCK-8) kit was purchased from Dojindo (Tokyo, Japan), and 0.25% trypsin-ethylenediaminetetraacetic acid (EDTA), penicillin-streptomycin solution, radioimmunoprecipitation assay (RIPA) lysate (09271919023), and anti-beclin-1 antibody (ab62472) were purchased from Abcam (Cambridge, UK). Anti-P62 (18420-1-AP), anti-LC3 (2775S), anti-Mtor (2972s), anti-Akt (4691S), and anti-PI3K (bsm-33219M) antibodies were purchased from Cell Signaling Technology (Danvers, MA, USA). The qPCR and gDNA remover RT Master Mix (RK20403) were obtained from AbClonal (Wuhan, China), and 3-methyladenine (3-MA) was provided by Anhui (China).
Experimental animals
Thirty male Sprague Dawley (SD) rats weighing 200–250 g were obtained from the Experimental Center of the Anhui University of Chinese Medicine. All rats were provided with food and drinking water once a day and maintained at a constant temperature of 22 ±2°C and a humidity of 55–60%. This study was approved by the Experimental Animal Ethics Committee of Anhui University of Traditional Chinese Medicine (AHUCM-rats-2021135).
Rat groups and preparation of YGYSG medicated serum
The rats were randomly divided into YGYS-high (YGYS-H), -medium (YGYS-M), and -low (YGYS-L) dose groups (n ≤ 10), a positive control group (n ≤ 10), and a blank group (n ≤ 10). The YGYS-H, YGYS-M, and YGYS-L groups were administered daily doses of 0.64 g/ml, 0.32 g/ml, and 0.16 g/ml YGYS, respectively. Rats in the positive drug group were given 0.18 mg/ml of benazepril daily via oral gavage for 2 weeks. Animals in the control group received saline in the same manner and on the same schedule. One hour after the last gavage, all animals were anesthetized using an intraperitoneal injection of 3.5% pentobarbital sodium (10 ml/kg) after fasting for 24 h. Blood samples from the abdominal aorta were collected at room temperature for 2 h, and the complement was inactivated at 56°C for 30 min. Bacteria were removed by filtration twice with a 0.22 µm microporous membrane, and blood samples were then packaged, sealed, and stored in the refrigerator at –80°C for later use.
Cell culture
MPC-5 renal podocytes were purchased from Yingmai Technology Co. Ltd. (Hefei, China). The cells were cultured in a complete medium consisting of high glucose DMEM, 10% FBS, and 1% penicillin-streptomycin in an incubator with 5% CO2 at 37°C. When 70–80% of the cells were fused, 0.25% EDTA/trypsin solution was added to digest the cells. After digestion, DMEM containing 10% FBS was added to terminate digestion for subculturing.
CCK-8 assay
MPC-5 cells were seeded into 96-well plates at a density of 1 × 10⁴ cells/ml, with six wells per group. Upon reaching 70% confluence, cells were cultured for 12 h without serum to synchronize. Except for the control group, serum media containing YGYS-L, YGYS-M, and YGYS-H at concentrations of 5%, 10%, 15%, and 20% were added for 24 h. After incubation, 10 µl of CCK-8 solution was added to each well according to the manufacturer’s instructions, followed by incubation for 1 h. The absorbance of each well was measured at 490 nm.
Transmission electron microscopy (TEM)
Three groups of cells were selected for electron microscopy: blank, model, and optimal YGYSG concentration. MPC-5 cells were collected and placed in 1.5 ml of electron microscope fixative and stored in a refrigerator at 4°C for 6 h. The electron microscope-fixing solution was removed, 1.5 ml of PBS was added and the sample was allowed to soak for 1 h. Dehydration using ethanol was performed as follows at room temperature: 30% ethanol (1.5 ml, 10 min), 50% ethanol (1.5 ml, 10 min), 70% ethanol and saturated uranium dioxyacetate (1.5 ml, 3 h), 80% ethanol (1.5 ml, 10 min), 95% ethanol (1.5 ml, 15 min), and 100% ethanol (1.5 ml, 50 min); this was repeated twice. Finally, 1.5 ml propylene was added to the sample and allowed to stand for 30 min. Finally, the sample was sliced using an ultramicrotome to a thickness of 60–80 nm for observation.
Western blotting
Total protein was extracted using RIPA lysis buffer. The proteins were quantified using the bicinchoninic acid method. Sodium dodecyl sulfate-polyacrylamide gel electrophoresis (SDS-PAGE) protein loading buffer 5X was added to the collected protein samples at a ratio of 1 : 4. A boiling water bath was used for 15 min to completely denature the proteins. After the sample cooled to room temperature, it was directly sampled into an SDS-PAGE gel sampling hole. We then added 5–10 µl to each well. Electrophoresis was carried out at 80 V for approximately 1 h. The membrane was then incubated with primary antibodies at 4°C overnight. The primary antibodies used were as follows: p62 (1 : 50 000), beclin-1 (1 : 1000), LC3 (1 : 1000), PI3K (1 : 1000), AKT (1 : 1000), mTOR (1 : 1000), and β-actin (1 : 1000).
Reverse transcription quantitative polymerase chain reaction (RT-qPCR)
For RNA extraction, the cell precipitate was collected and 1 ml of TRIzol was added for cracking. After complete cracking, the cells were centrifuged at 12 000 rpm at 4°C for 15 min, and the supernatant was discarded. Pre-cooled 75 ethanol (1 ml) was added (anhydrous ethanol was diluted with diethyl pyrocarbonate-treated [DEPC] water). The solutions were centrifuged at 12 000 rpm at 4°C for 5 min, and the supernatant was discarded. RNA was dried at room temperature, precipitated with 20–50 µl of DEPC water, and stored at –80°C for later use. For the reaction, the mixture was gently mixed and centrifuged in a 0.2 ml EP tube. The samples were heated at 42°C for 2 min and immediately bathed in ice for 1 min. The EP tubes were then added to the PCR apparatus for the RT reaction. Lastly, the above reaction solution was removed and stored at –80°C for later use.
Statistical analysis
Data were analyzed using GraphPad Prism (version 8.0.2) and SPSS (version 26.0) software. Data were expressed as mean ± standard deviation (mean ± SD). One-way analysis of variance was used for comparisons between groups, and the least significant difference (LSD) t-test was used for paired comparisons between groups. Statistical significance was set at p < 0.05.
Results
YGYSG core components act on targets of hypertensive kidney injury via the autophagy pathway
The workflow of the experiment is illustrated in Figure 1. A total of 129 effective components were obtained by retrieving the drug ingredients using the TCMSP database and setting oral bioavailability (OB) ≥ 30% and drug-likeness (DL) ≥ 0.18 as likeness conditions. Of these, 57 were S. miltiorrhiza, 34 were Lycium lycii, 15 were Astragalus likeness, 16 were Achyranthes sinensis, 2 were Gorgon euryale, and 10 were Cuscuta (Figure 2). By combining the GeneCards and OMIM database results, 7097 disease targets were obtained after removing duplicates, including 7074 and 96 targets from the GeneCards and OMIM databases, respectively. By searching for ‘autophagy,’ 3076 targets were obtained in the GeneCards database, 29 targets were obtained in the OMIM database, and 3076 autophagy genes were obtained after combining duplicate values. By screening the intersecting targets of YGYSG, autophagy, and HRD, 118 intersecting targets were identified (Figure 3 A). Ten core compounds of YGYSG used in the treatment of HRD were identified by degree screening (Table I): quercetin, kaempferol, beta-sitosterol, stigmasterol, luteolin, isorhamnetin, tanshinone IIa, 7-O-methylisomucronulatol, baicalein, and formononetin. By referring to target mapping in TCMSP, 118 protein names were translated into official names in the UniProt database (Table II), and drug-composition-target and drug-composition-target-disease networks were constructed (Figure 3 B).
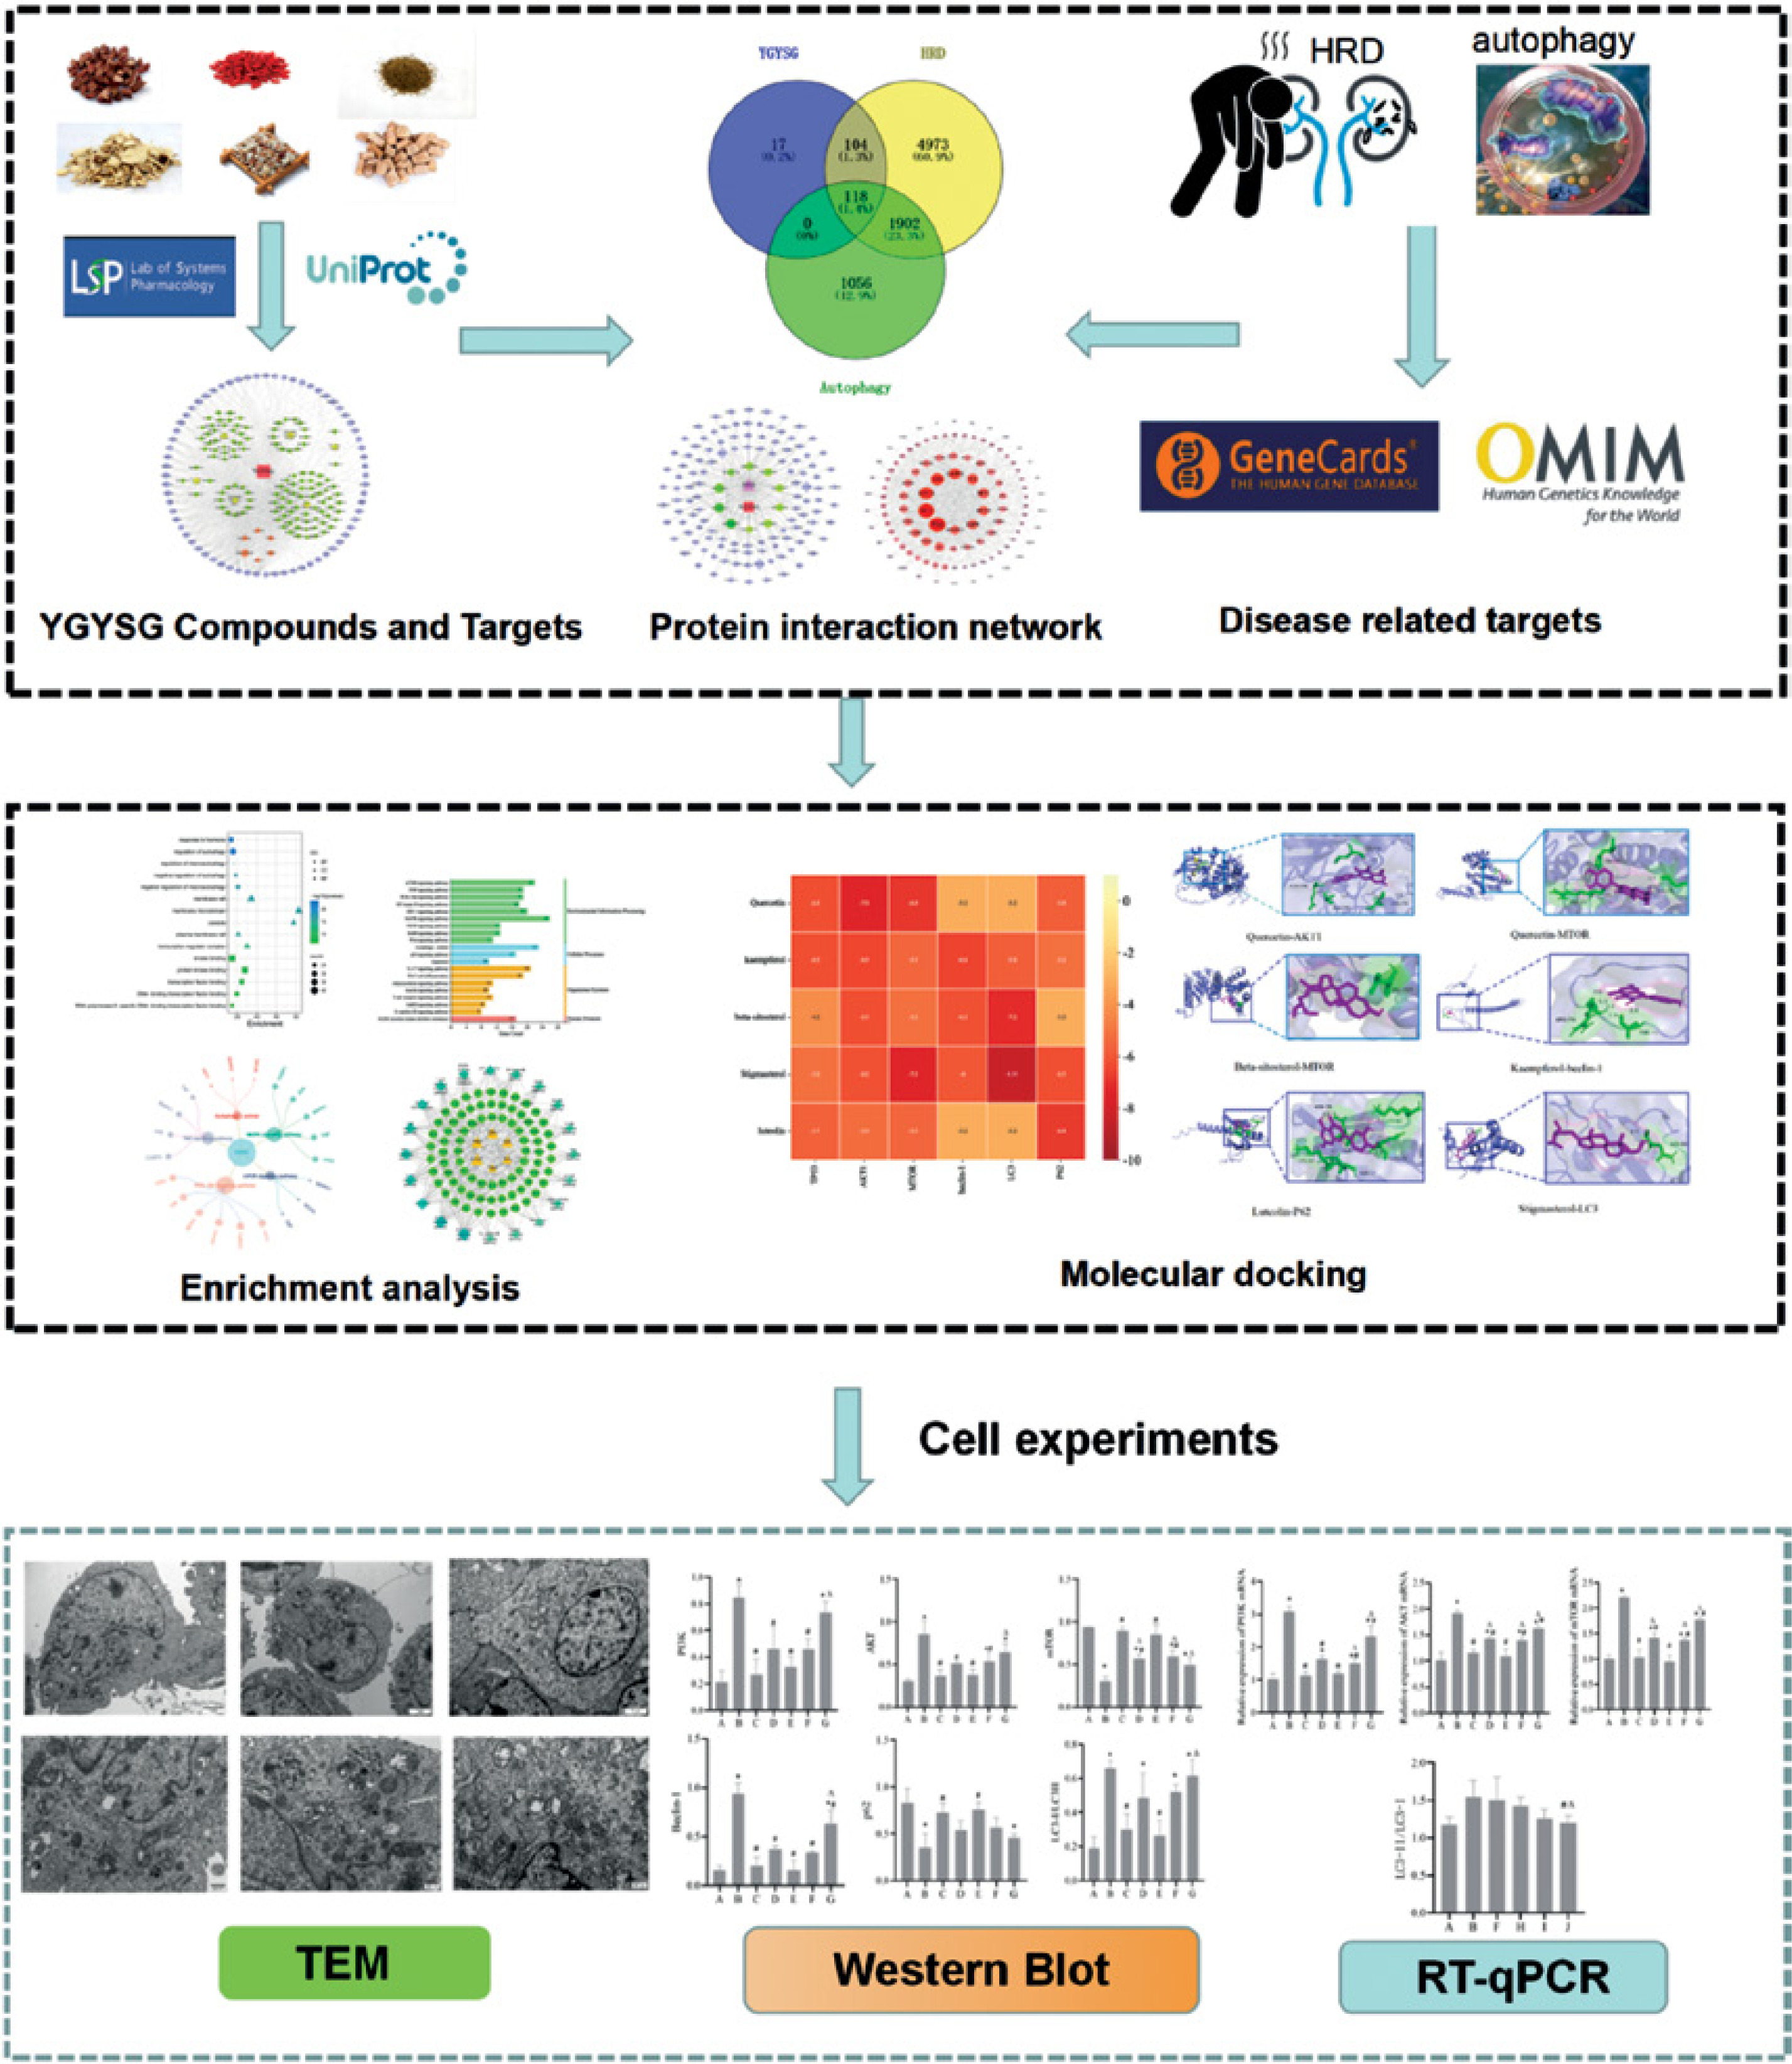
Figure 2
Construction of Yanggan-Yishui granules (YGYSG) component target network; the blue circle, green hexagon, pink hexagon, yellow diamond, and dark red squares represent drug target, drug component, drug common component, and traditional Chinese medicine, and YGYSG, respectively
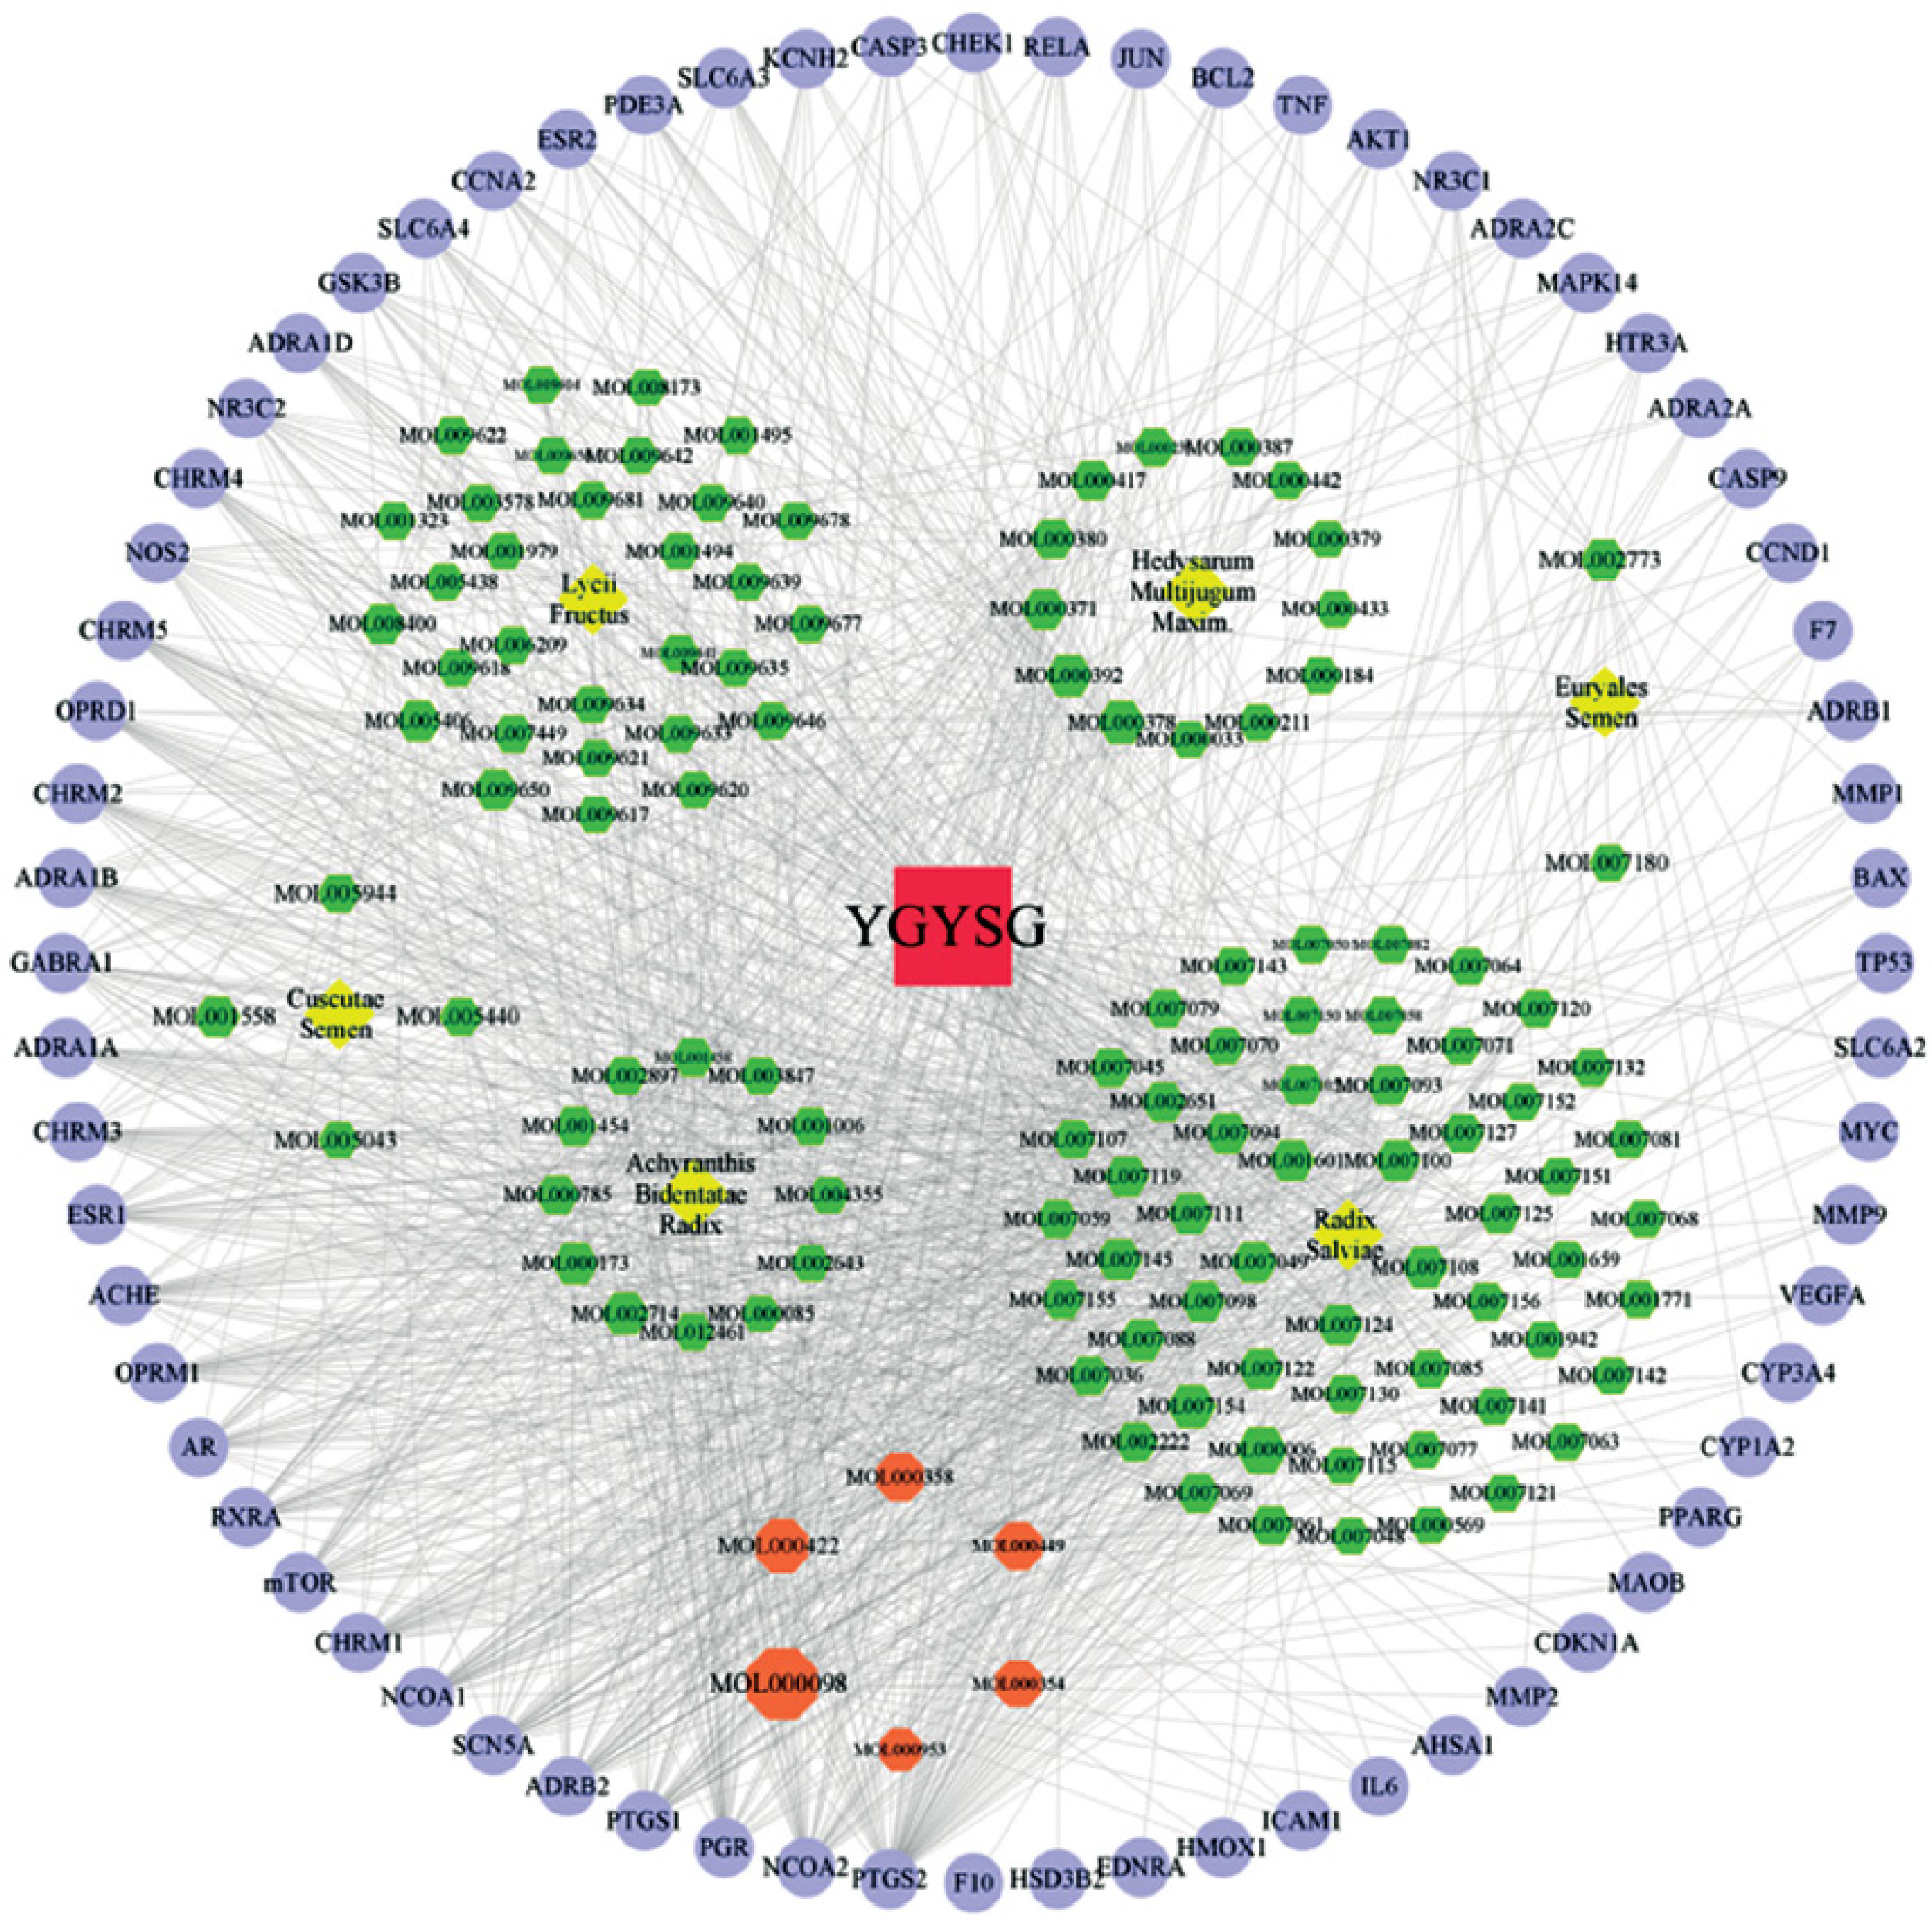
Figure 3
A – Wayne diagram of the intersection of Yanggan-Yishui granules (YGYSG), hypertensive renal damage (HRD), and autophagy; B – YGYSG core component target disease network construction; the blue diamond, green hexagon, red square, and purple triangle represent intersection targets, core components, drugs, and diseases, respectively
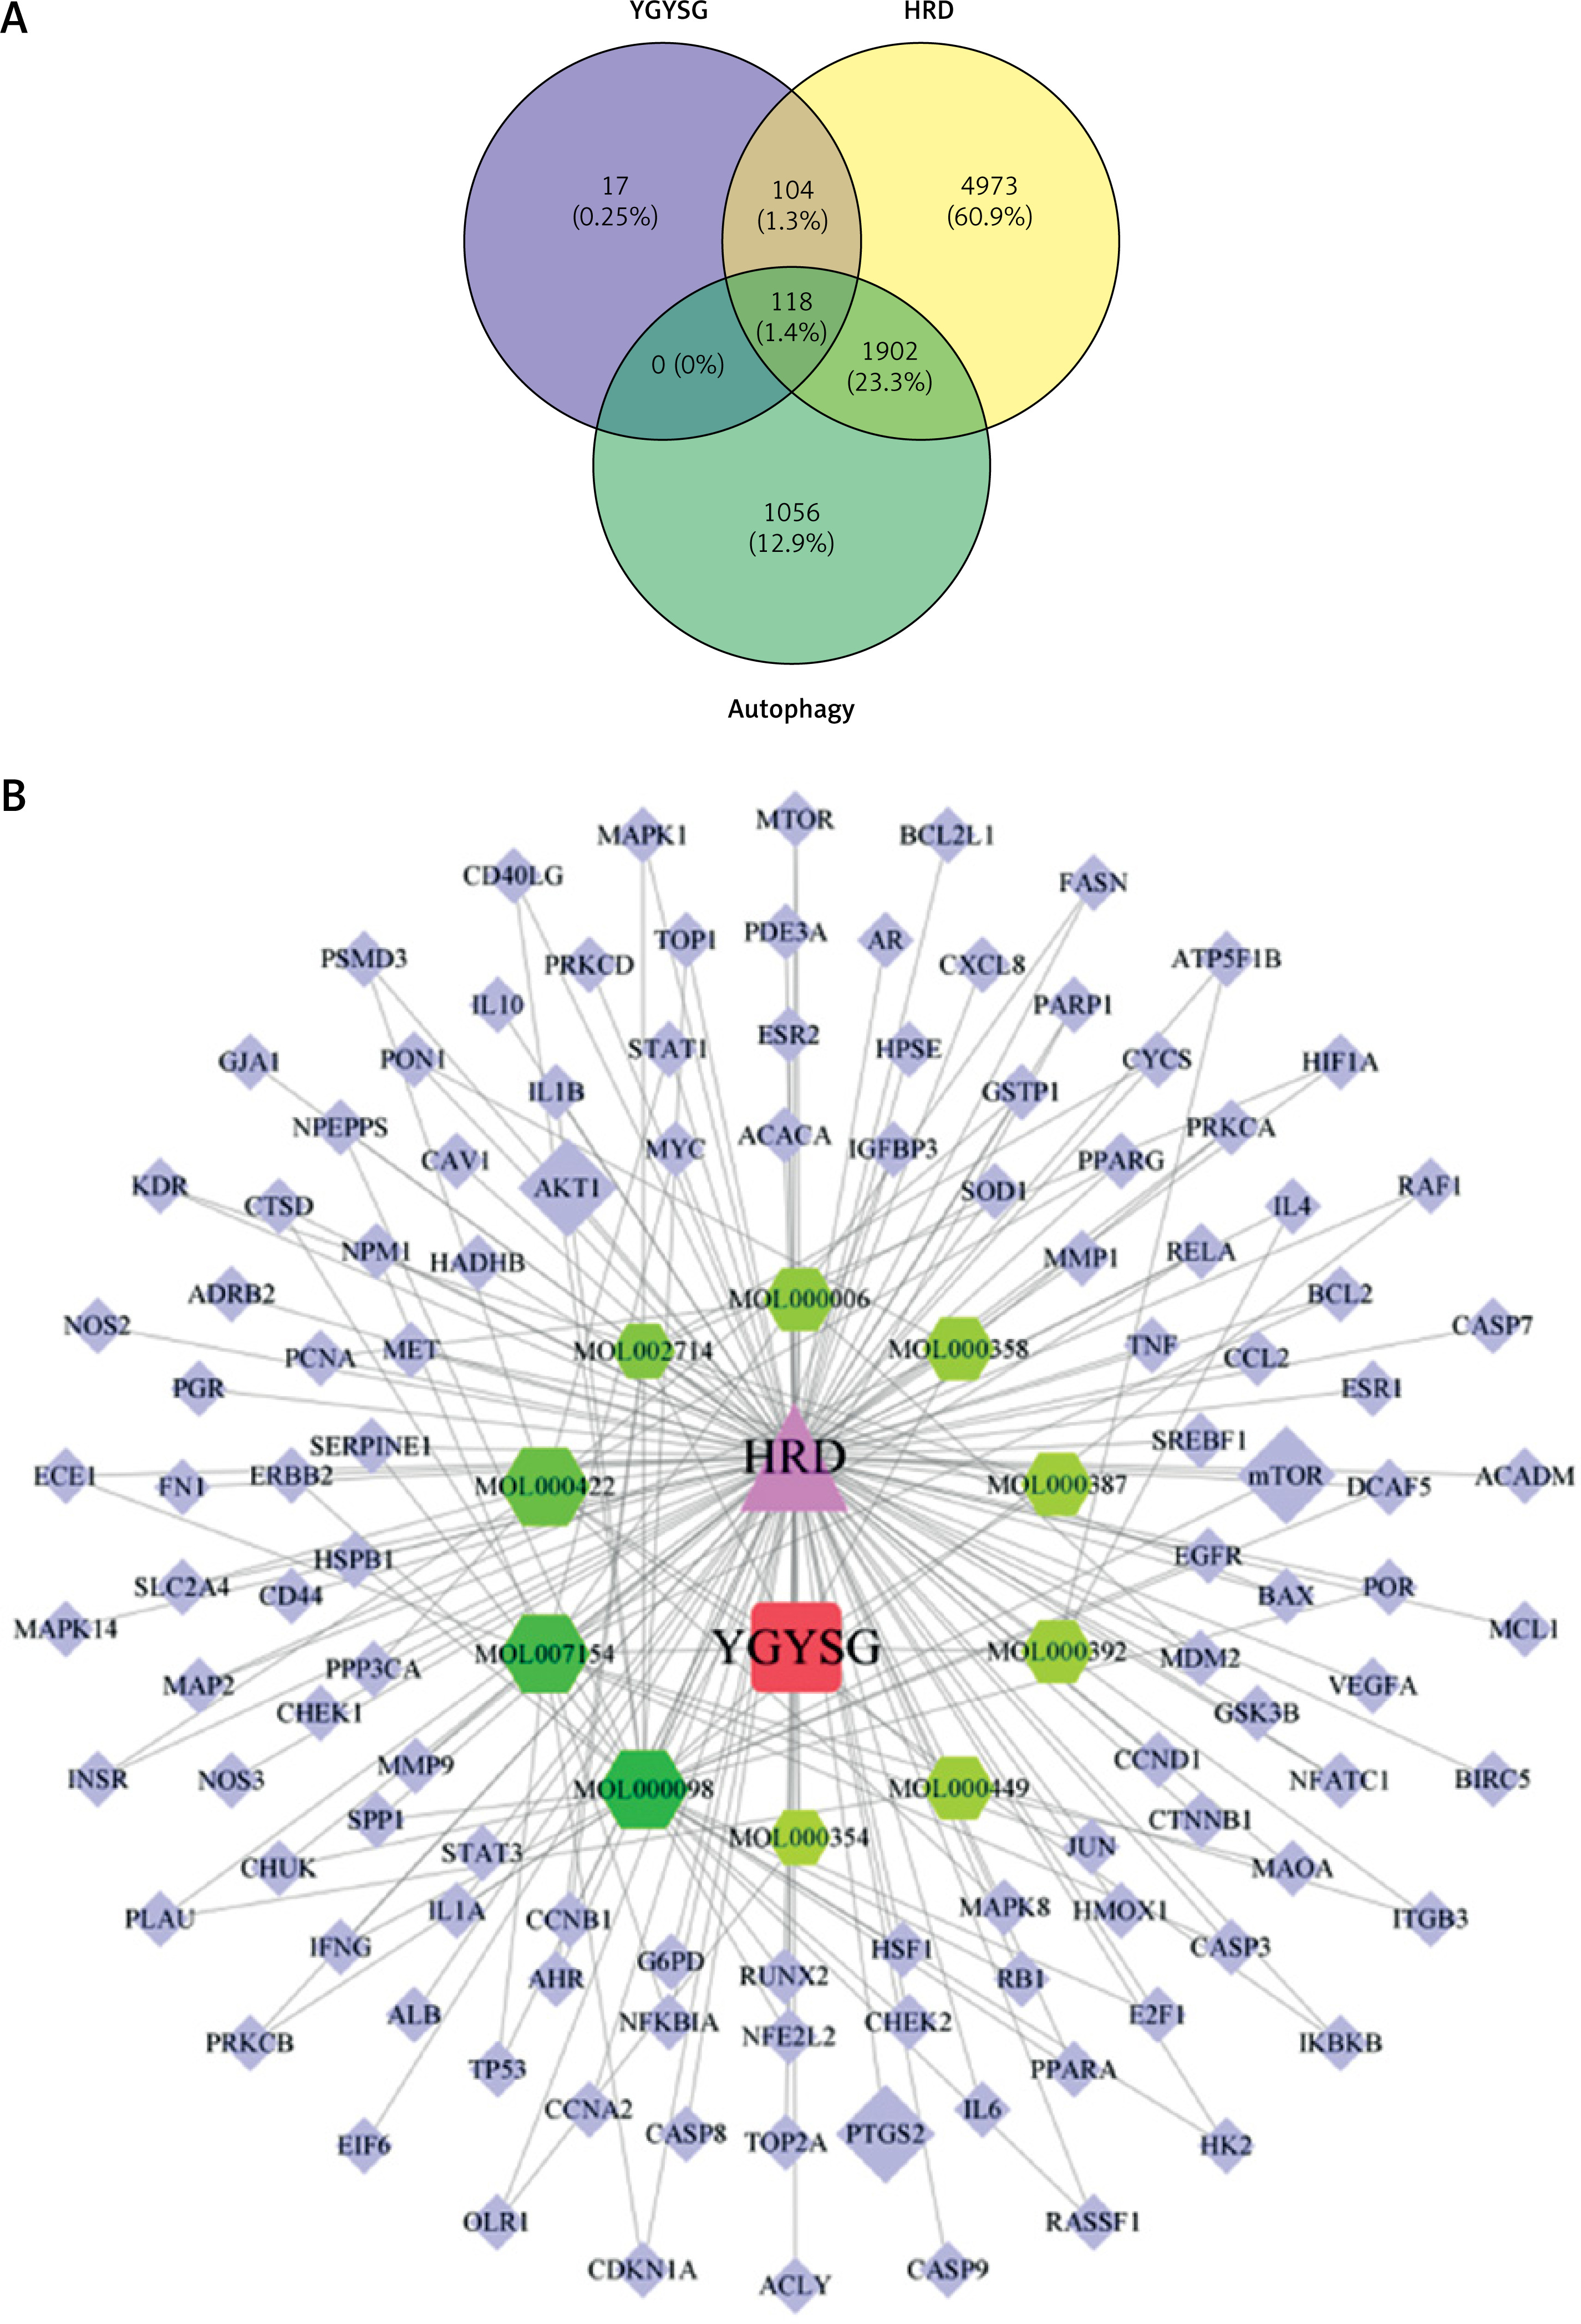
Table I
Ten core compounds of YGYSG in HRD treatment. YGYSG: Yanggan-Yishui granules; HRD: hypertensive renal damage
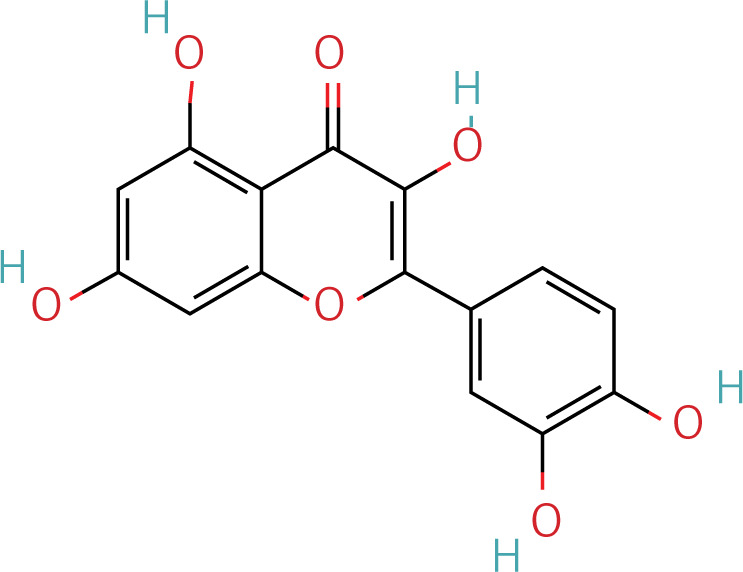
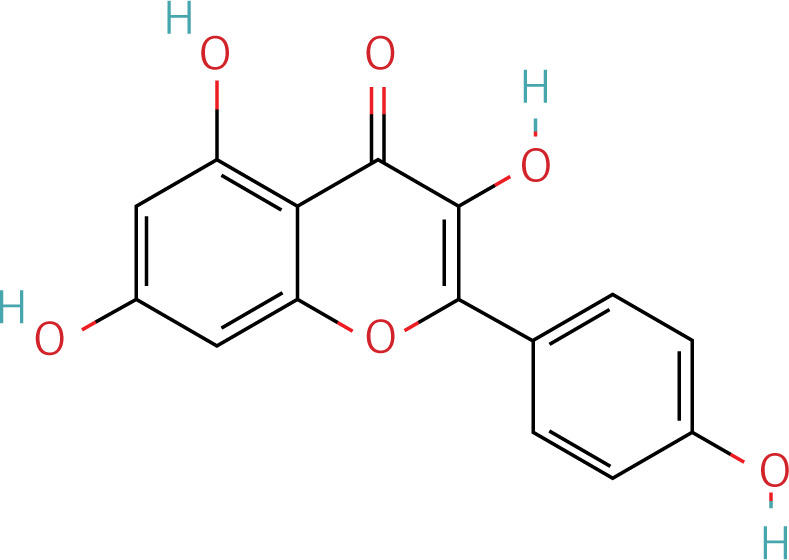
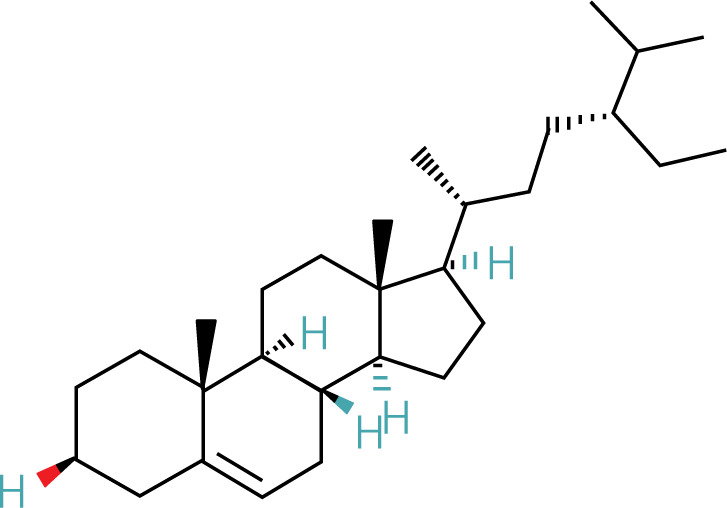
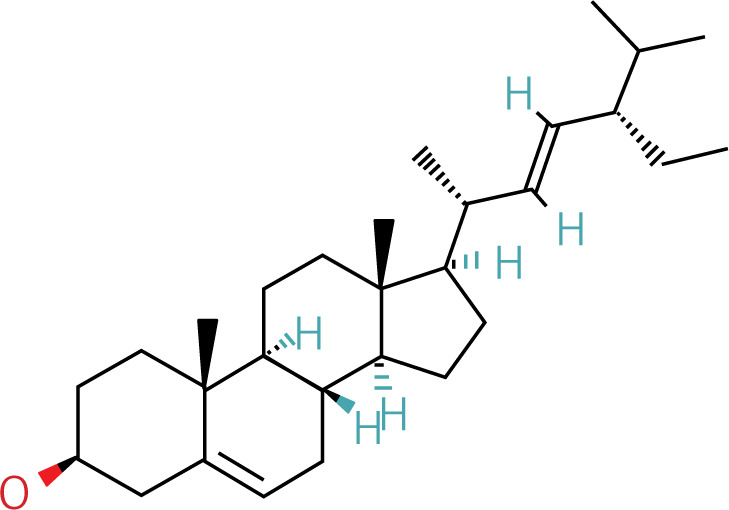
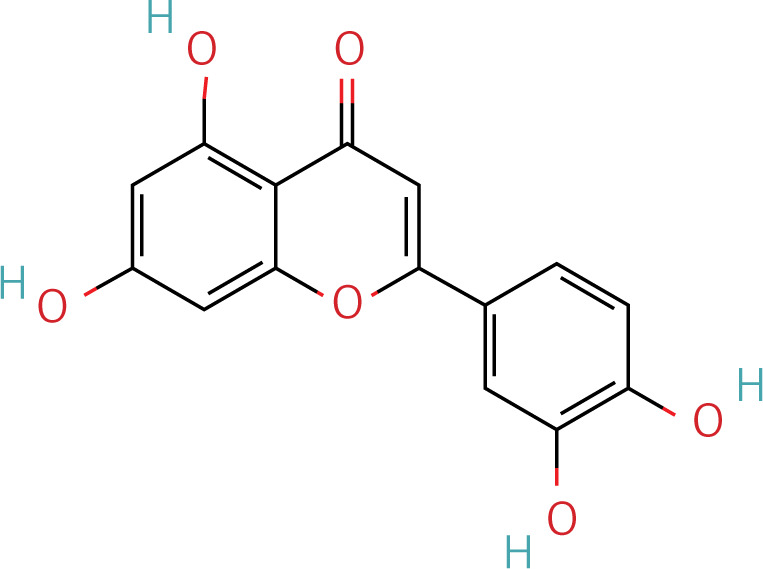
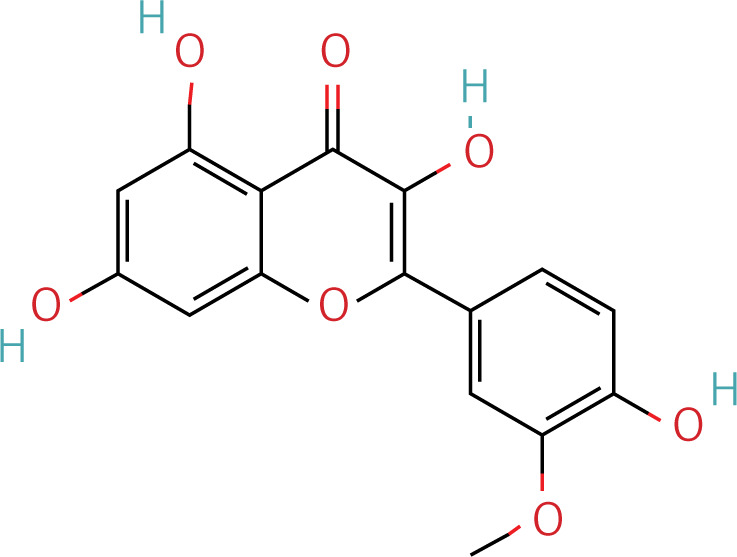
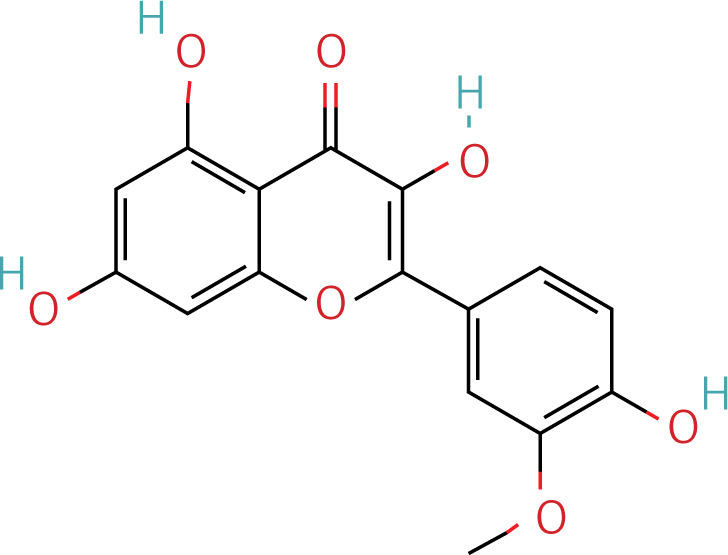
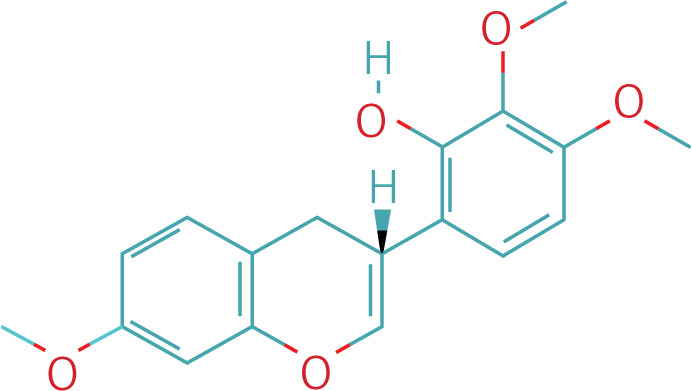
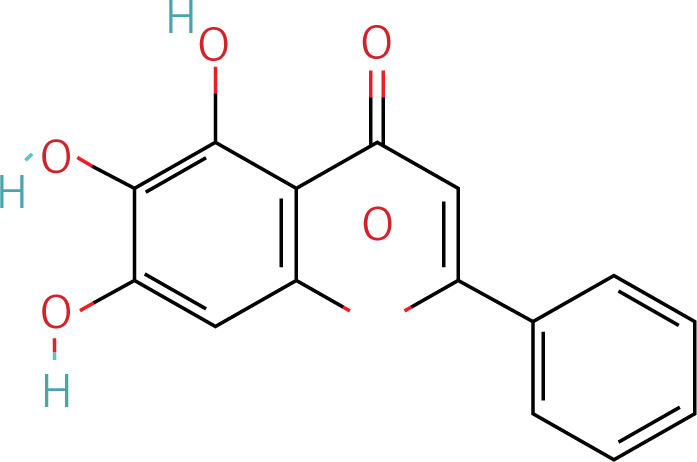
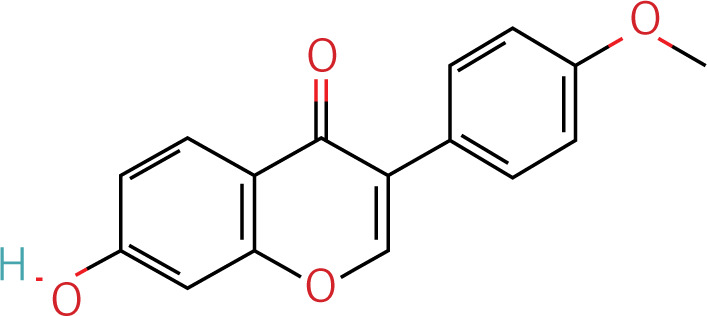
Table II
Target information of HRD treated by YGYSG through the autophagy pathway
Protein interaction analysis of YGYSG in the treatment of HRD through the autophagy pathway
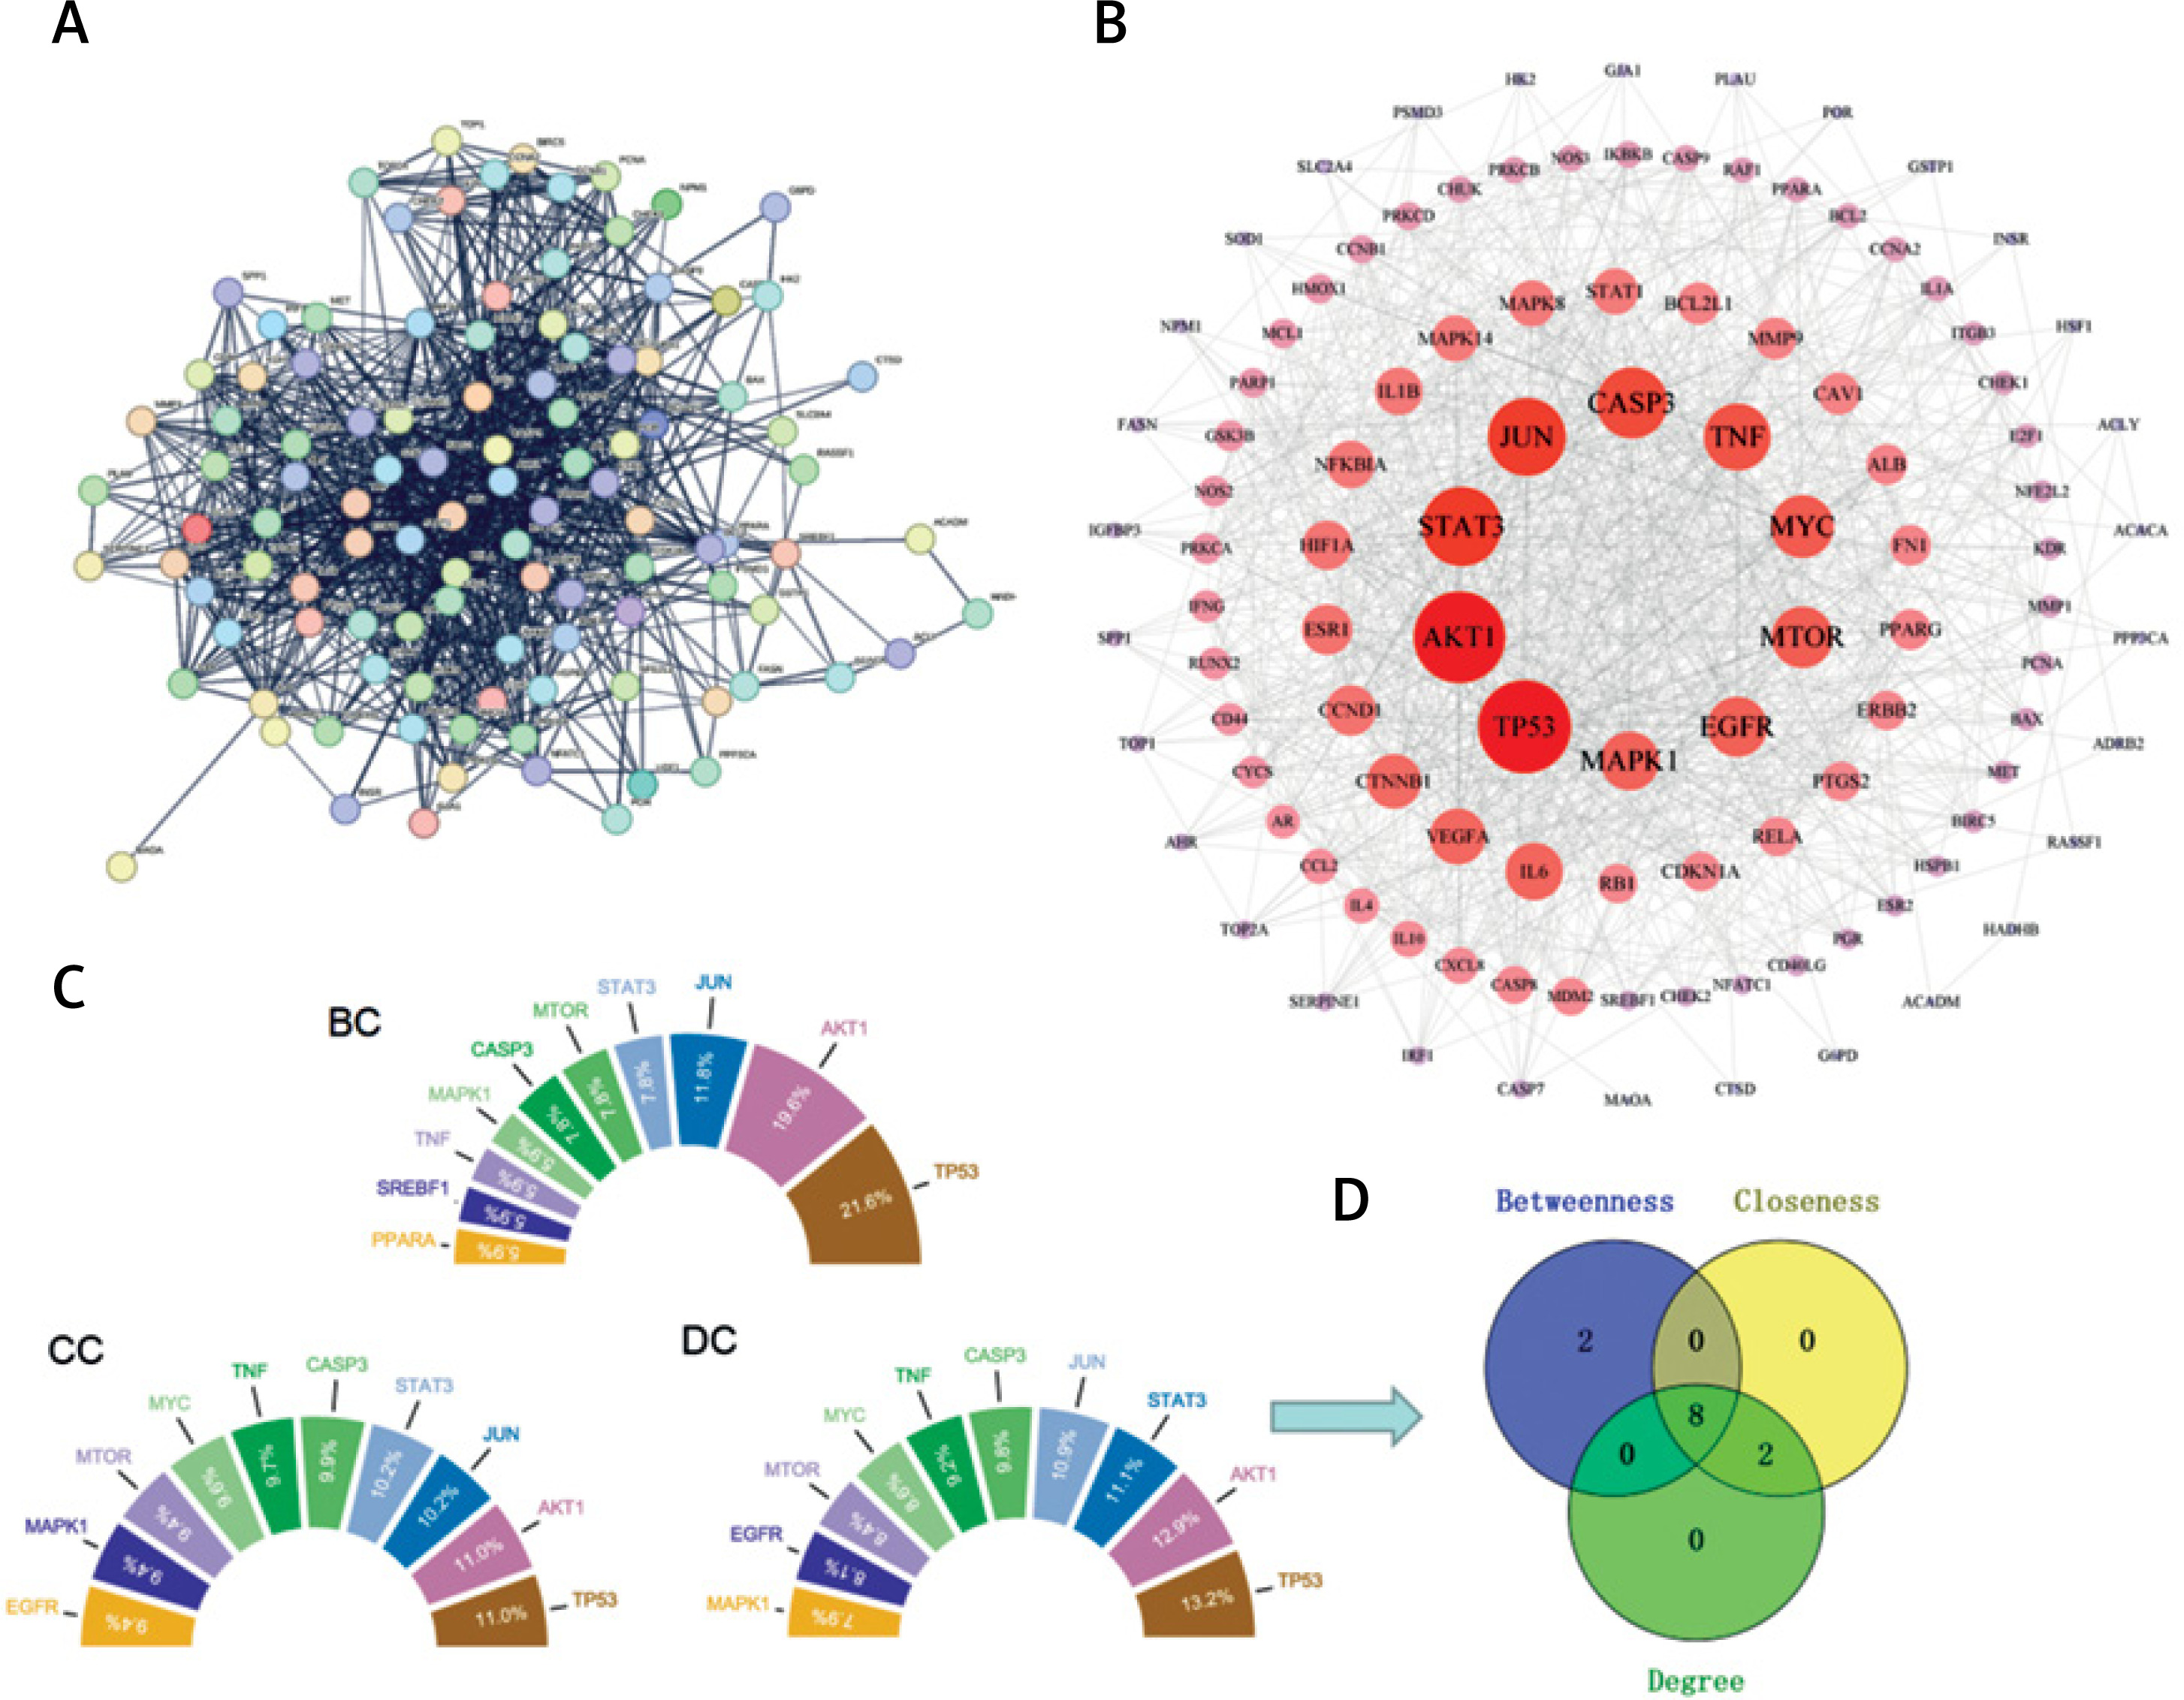
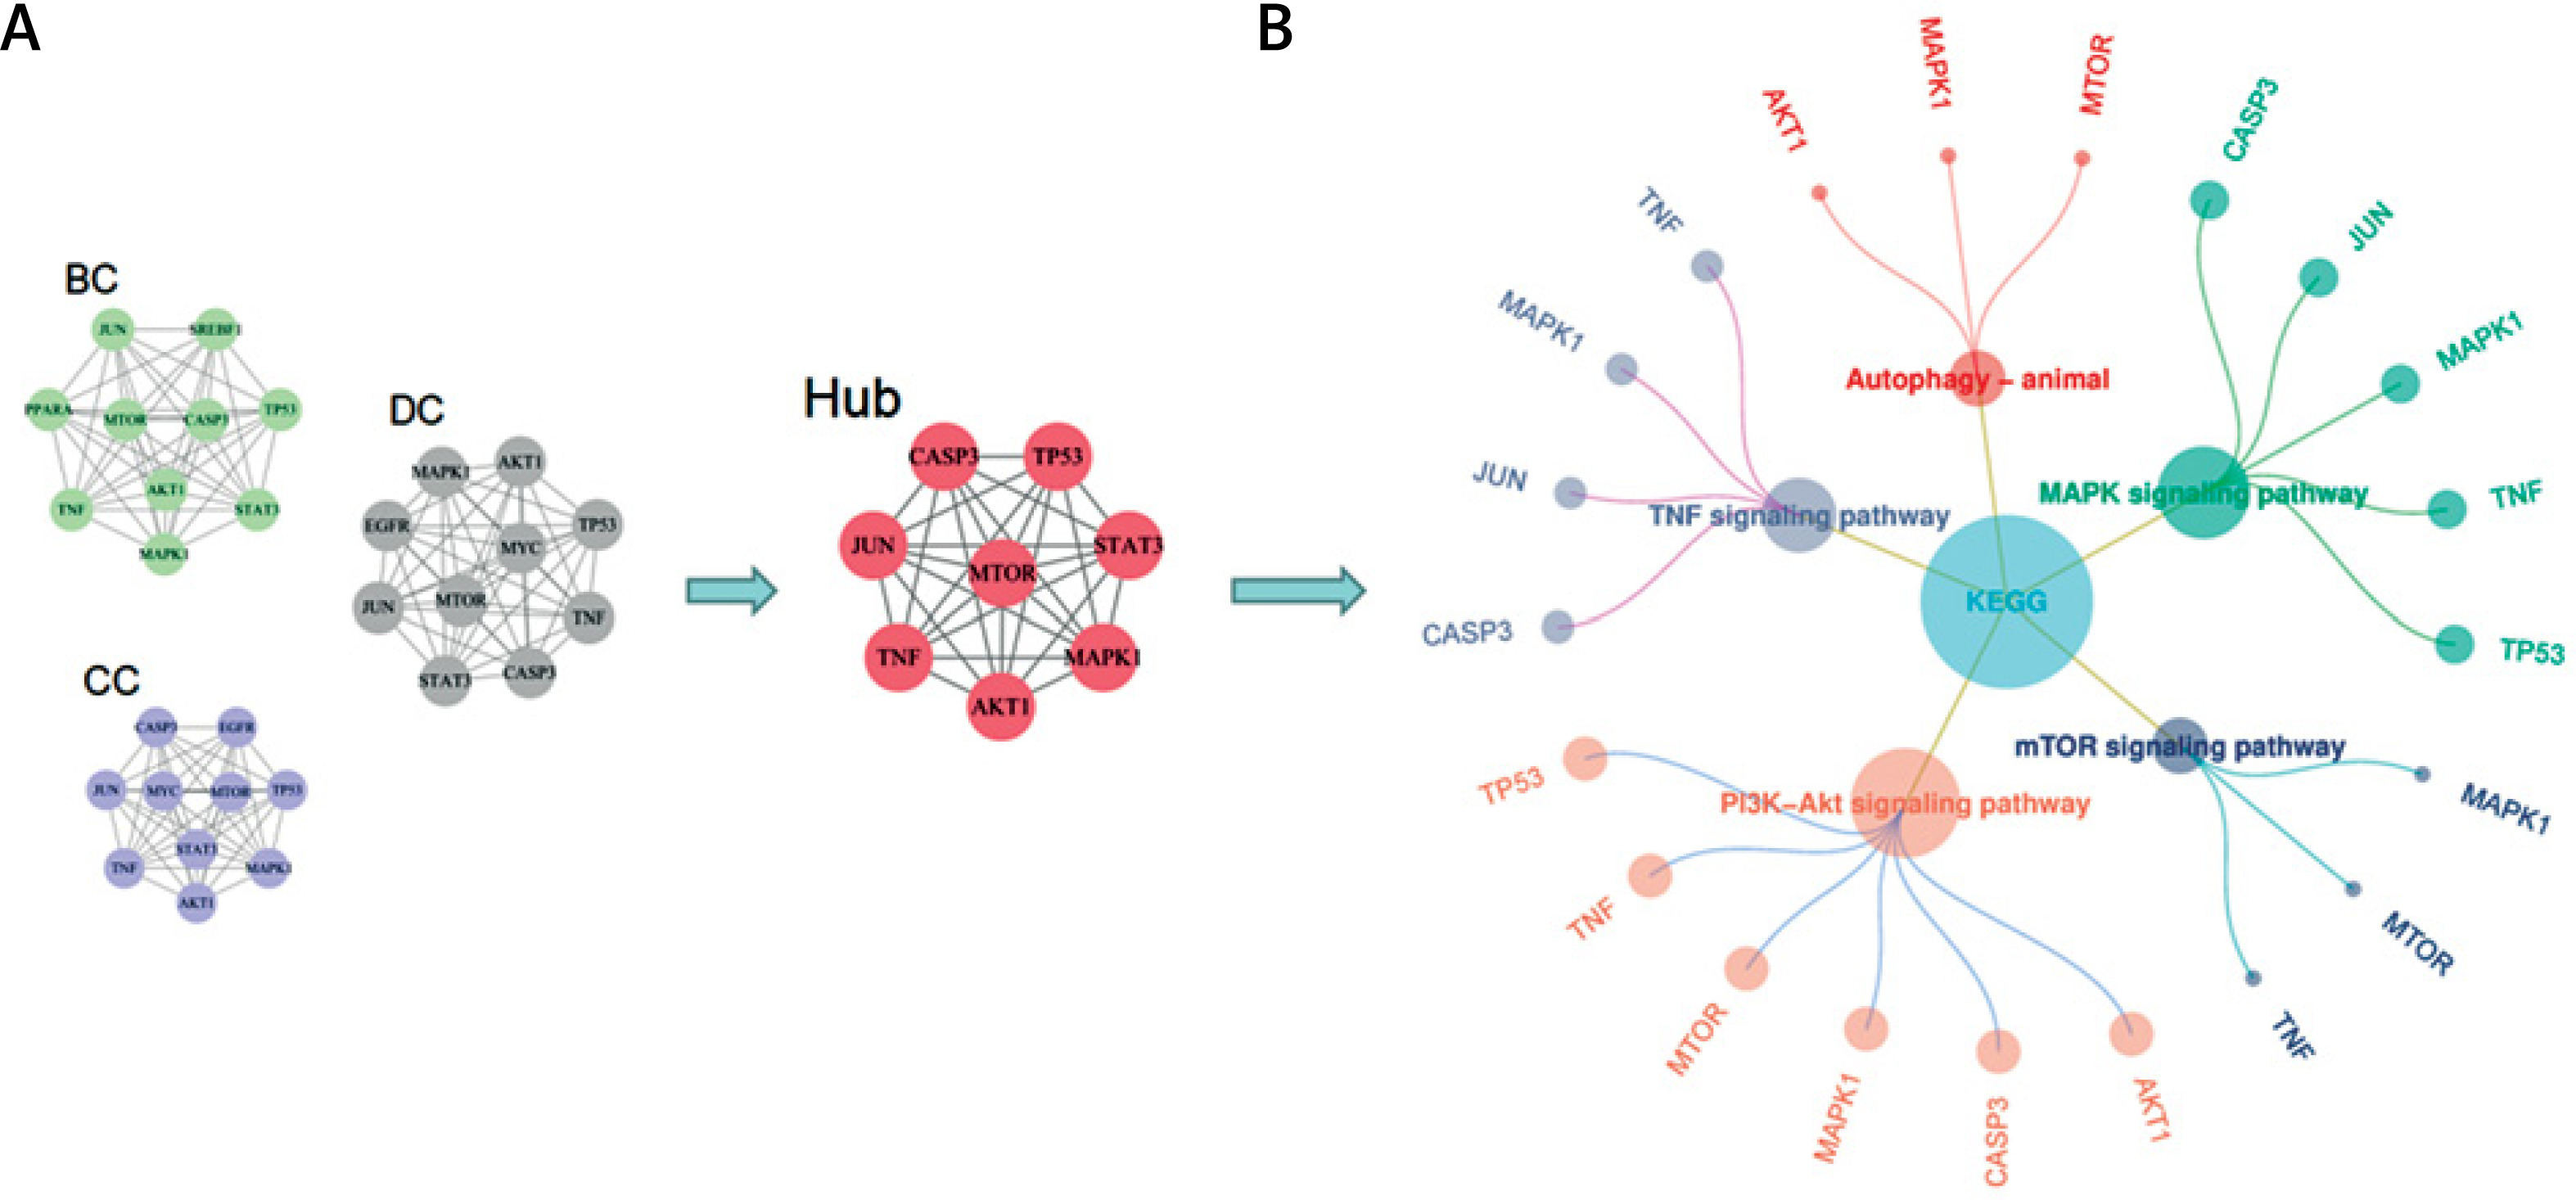
Protein interactions were predicted using the STRING database (https://string-db.org/). A total of 118 common targets obtained from the Venn diagram were imported into the database. The PPI network was constructed using Cytoscape software with 108 nodes and 982 edges (Figures 4 A, B). Finally, core targets were screened through the cytoHubba plugin; betweenness (BC), closeness (CC), and degree (DC) medians were used as screening criteria (Figure 4 C). The key core targets identified were as follows: cellular tumor antigen p53 (TP53), RAC-alpha serine/threonine-protein kinase (AKT1), signal transducer and activator of transcription 3 (STAT3), transcription factor AP-1 (JUN), caspase-3 (CASP3), tumor necrosis factor (TNF), serine/threonine-protein kinase mTOR (MTOR), and epidermal growth factor receptor (MAPK1 mitogen-activated protein kinase 1, EGFR) (Figure 4 D).
Figure 4
A – STRING PPI network obtained from the database; the highest protein interaction score was set as 0.9. B – In the PPI network constructed by Cytoscape software, the size of the circle and the shade of red were positively correlated with the degree value. C – According to the cytoHubba plugin, BC ≥ 0.011 (median), CC ≥ 0.495 (median), and DC ≥ 32 (median) should be screened. The sector area of each target in the figure was positively correlated with the percentage. D – Wayne diagram of intersection targets of BC, CC, and DC modules
Enrichment analysis of YGYSG treatment of HRD through the autophagy pathway
For an enrichment analysis using the Metascape website, 118 intersection targets were imported. The results showed that 1747 targets related to biological processes (BP), 90 targets related to cell components (CC), and 141 targets related to molecular functions (MF) were selected (Figure 5 A). A total of 190 KEGG samples were obtained, most of which were primarily involved in the biological processes of hormones, nitrogen compounds, autophagy, kinase binding, protein kinase binding, and transcription factor binding (Figure 5 B). KEGG analysis results mainly involved the PI3K/AKT, mTOR, HIF-1, IL-17, MAPK, VEGF, autophagy-animal, T cell receptor, and NF-kappaB signaling pathways, and a drug-target-pathway network was simultaneously constructed (Figure 5 C). We further analyzed the enrichment pathways of the eight core targets (Figure 6 A). The results showed that the targets were mainly enriched in the PI3K/AKT, autophagy-animal, mTOR, MAPK, and TNF signaling pathways, among which the PI3K/AKT signaling pathway was the most significant (Figure 6 B). Therefore, the PI3K/AKT signaling pathway was selected for further experiments.
Figure 5
A – Gene Ontology (GO) analysis B – Kyoto Encyclopedia of Genes and Genomes (KEGG) analysis; C – Drug target-pathway network
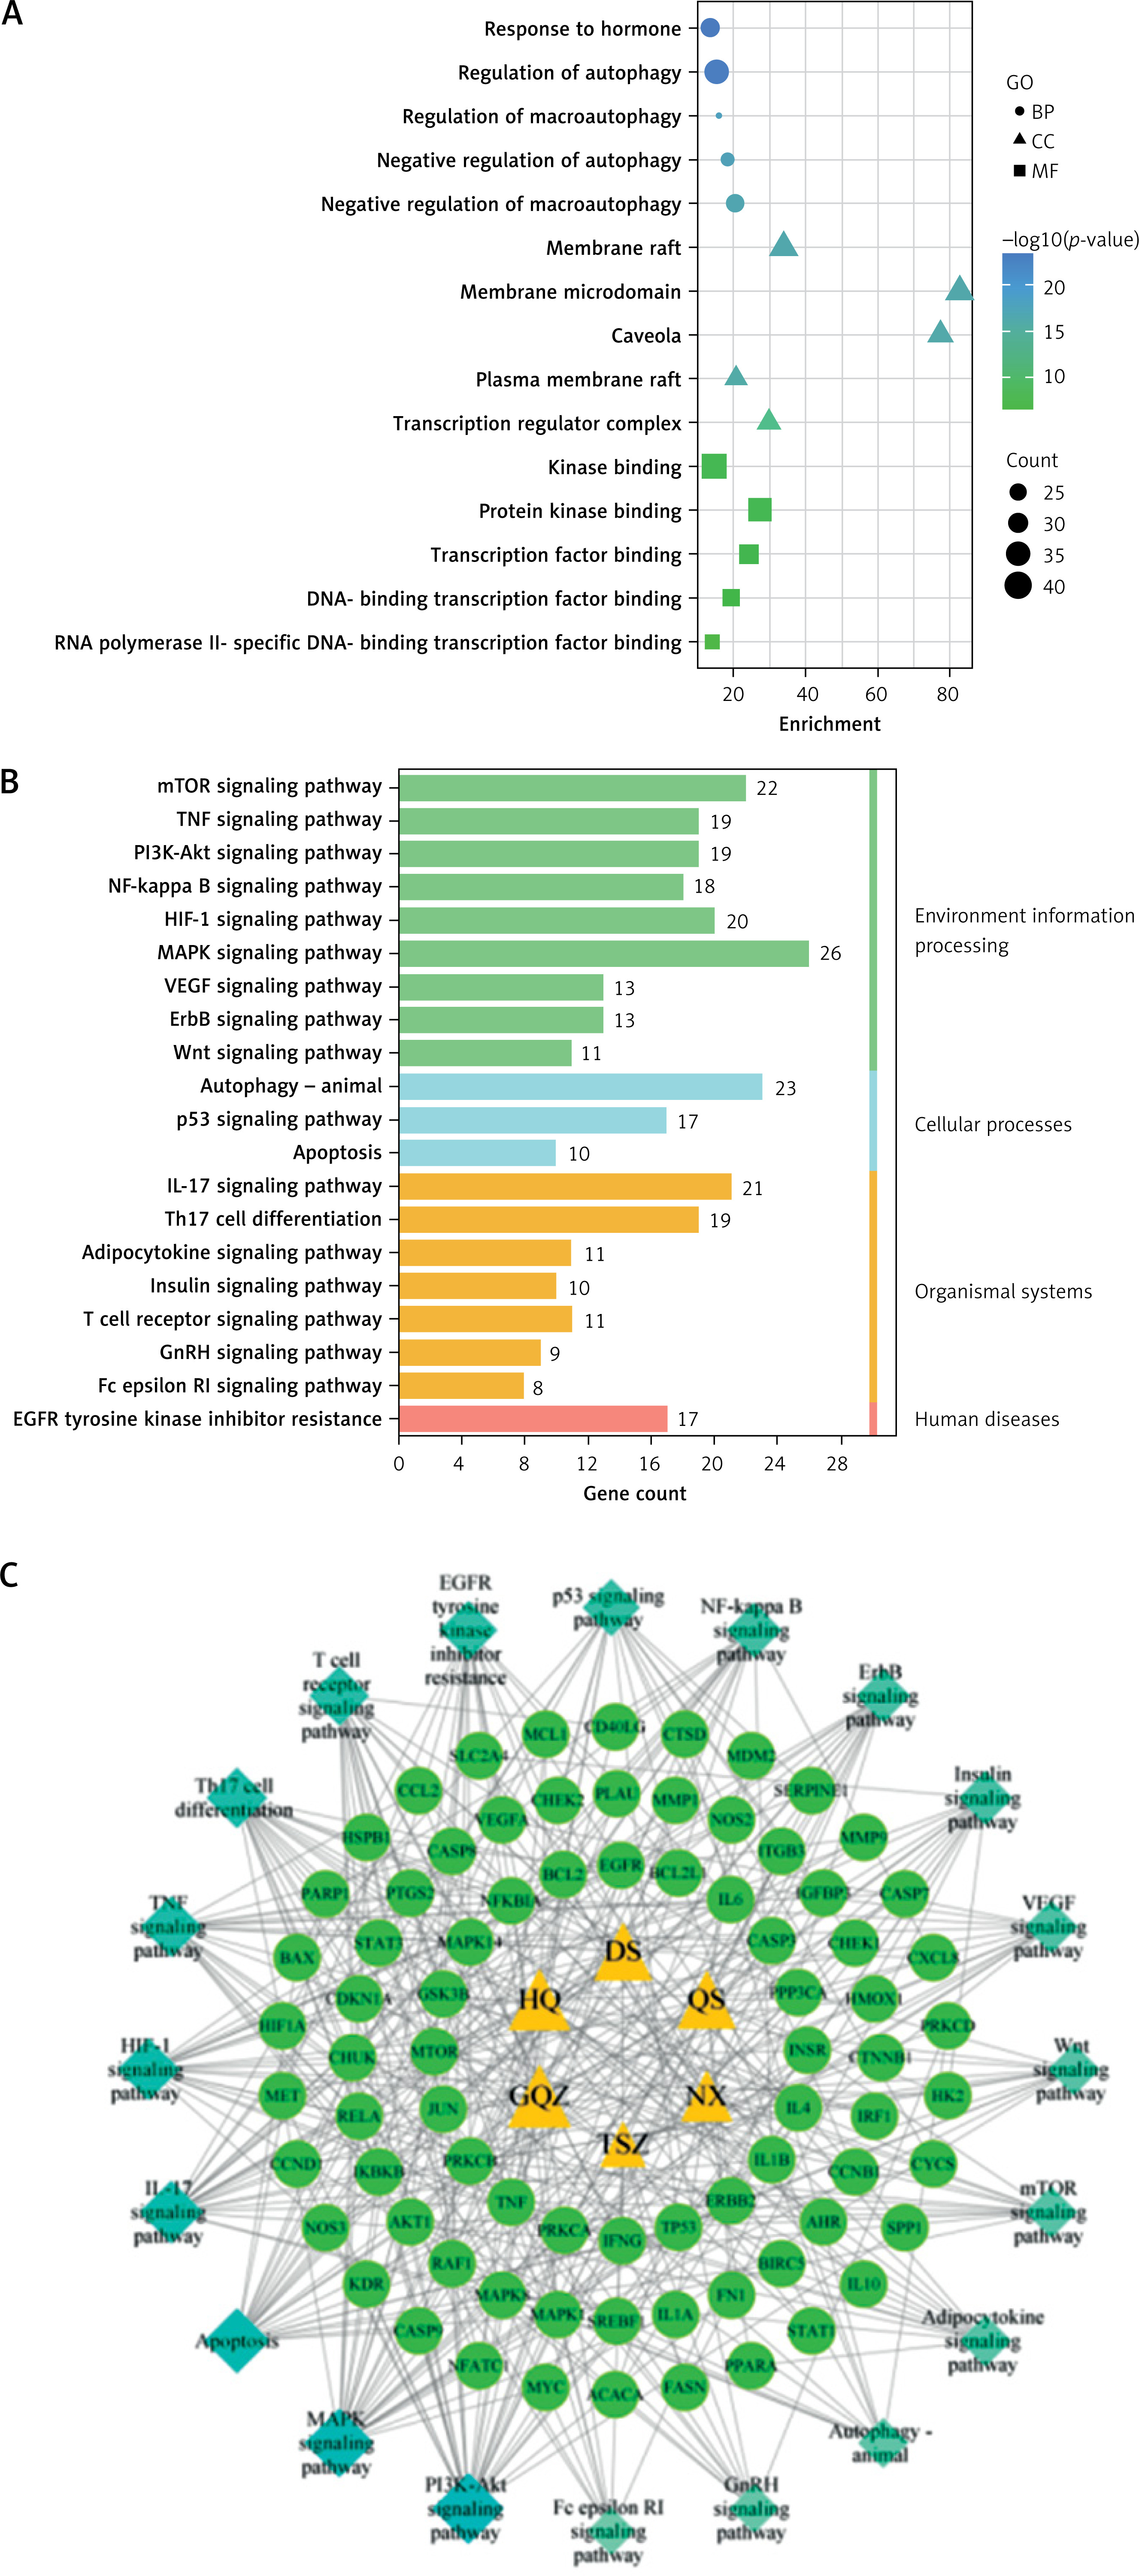
Figure 6
A – Three topology modules selected by the cytoHubba plugin (2.1.2). Betweenness (BC), closeness (CC), and degree (DC) protein interaction networks were constructed by Cytoscape software, and core interaction networks were constructed according to the eight core targets. B – Significant signal pathway obtained from core target enrichment. At the same time, a three-layer circular network diagram was constructed. Different colors represent different signal pathways and enrichment targets, respectively, and node size represents the number of enriched targets
Molecular docking
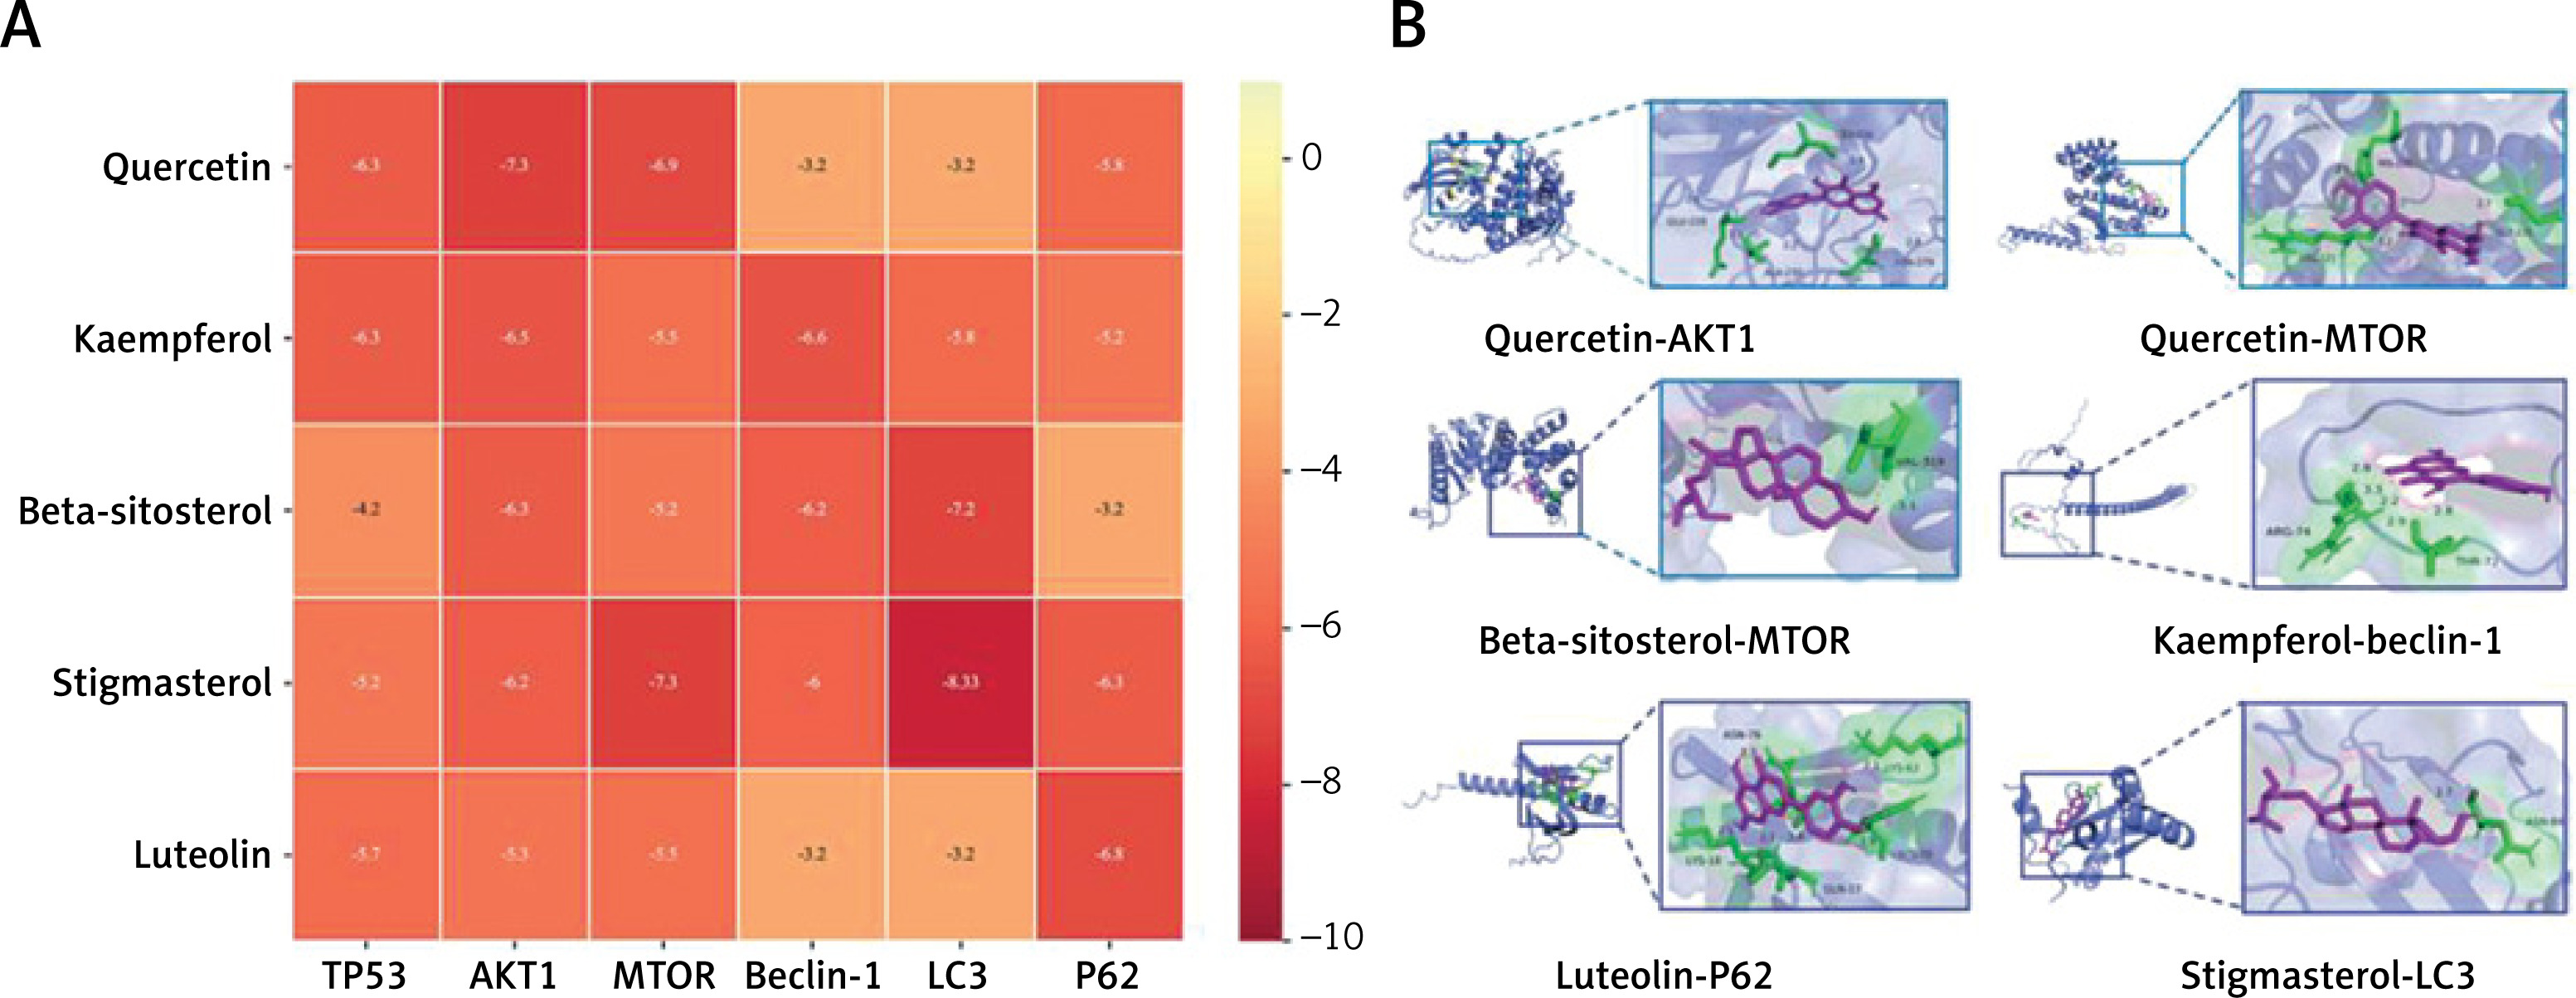
Molecular docking simulations demonstrated the affinity of core components for core targets. The top five core components of the molecular docking small-molecule selection were quercetin, kaempferol, beta-sitosterol, stigmasterol, and luteolin, whereas the core targets TP53, AKT1, mTOR, and autophagy-related proteins beclin-1, LC3, and P62 ranked at the top in the macromolecular selection topology (Figure 7 A). Quercetin, kaempferol, beta-sitosterol, stigmasterol, and luteolin exhibited good binding energies for TP53, AKT1, mTOR, beclin-1, LC3, and P62. The six groups of visual displays with the best docking results were selected (Figure 7 B).
Optimal serum concentration of YGYSG
We studied the effect of different concentrations of YGYSG-medicated serum on the viability of MPC-5 cells. Cells were treated with low, medium, and high doses of YGYS-medicated serum at concentrations of 5, 10, 15, and 20% for 12, 24, and 48 h, and a CCK-8 assay was performed to calculate cell viability. Default cell viability in the control group was 100%. In the YGYS-L group, cell viability at 5% concentration after 24 h was significantly higher than that in the control group (p < 0.01, Figure 8 A). In YGYS-M, the cell viability at 5% YGYS drug-containing serum for 12, 24, and 48 h, 10% YGYS drug-containing serum for 24 and 48 h, and 15% YGYS drug-containing serum for 24 h was significantly higher than that of the control group (p < 0.01, Figure 8 B). In addition, compared to the 20% YGYS drug-containing serum, the 5% YGYS drug-containing serum showed significantly higher cell viability after 24 h of treatment (p < 0.05, Figure 8 B). In the YGYS-H group, compared to the control group, the 15% YGYSG drug-containing serum showed significantly higher cell viability after 48 h of treatment (p < 0.01, Figure 8 C). Therefore, MPC-5 cells were treated with 5% concentration of YGYS-M for 24 h for TEM. Western blotting and RT-qPCR experiments employed 5% YGYS-L treatment of MPC-5 cells for 24 h, 5% YGYS-M treatment of MPC-5 cells for 24 h, and 15% YGYS-H treatment of MPC-5 cells for 48 h (Table III).
Figure 8
Effect of different concentrations of YGYSG medicated serum on the viability of MPC5 cells assessed using the CCK-8 assay. Cells were treated with YGYS-L (A), YGYS-M (B) and YGYS-H (C) at concentrations of 5%, 10%, 15%, and 20% for 12, 24, and 48 h. Compared with control group, **p < 0.01, ***p < 0.001, ****p < 0.0001; compared with 20%, #p < 0.05
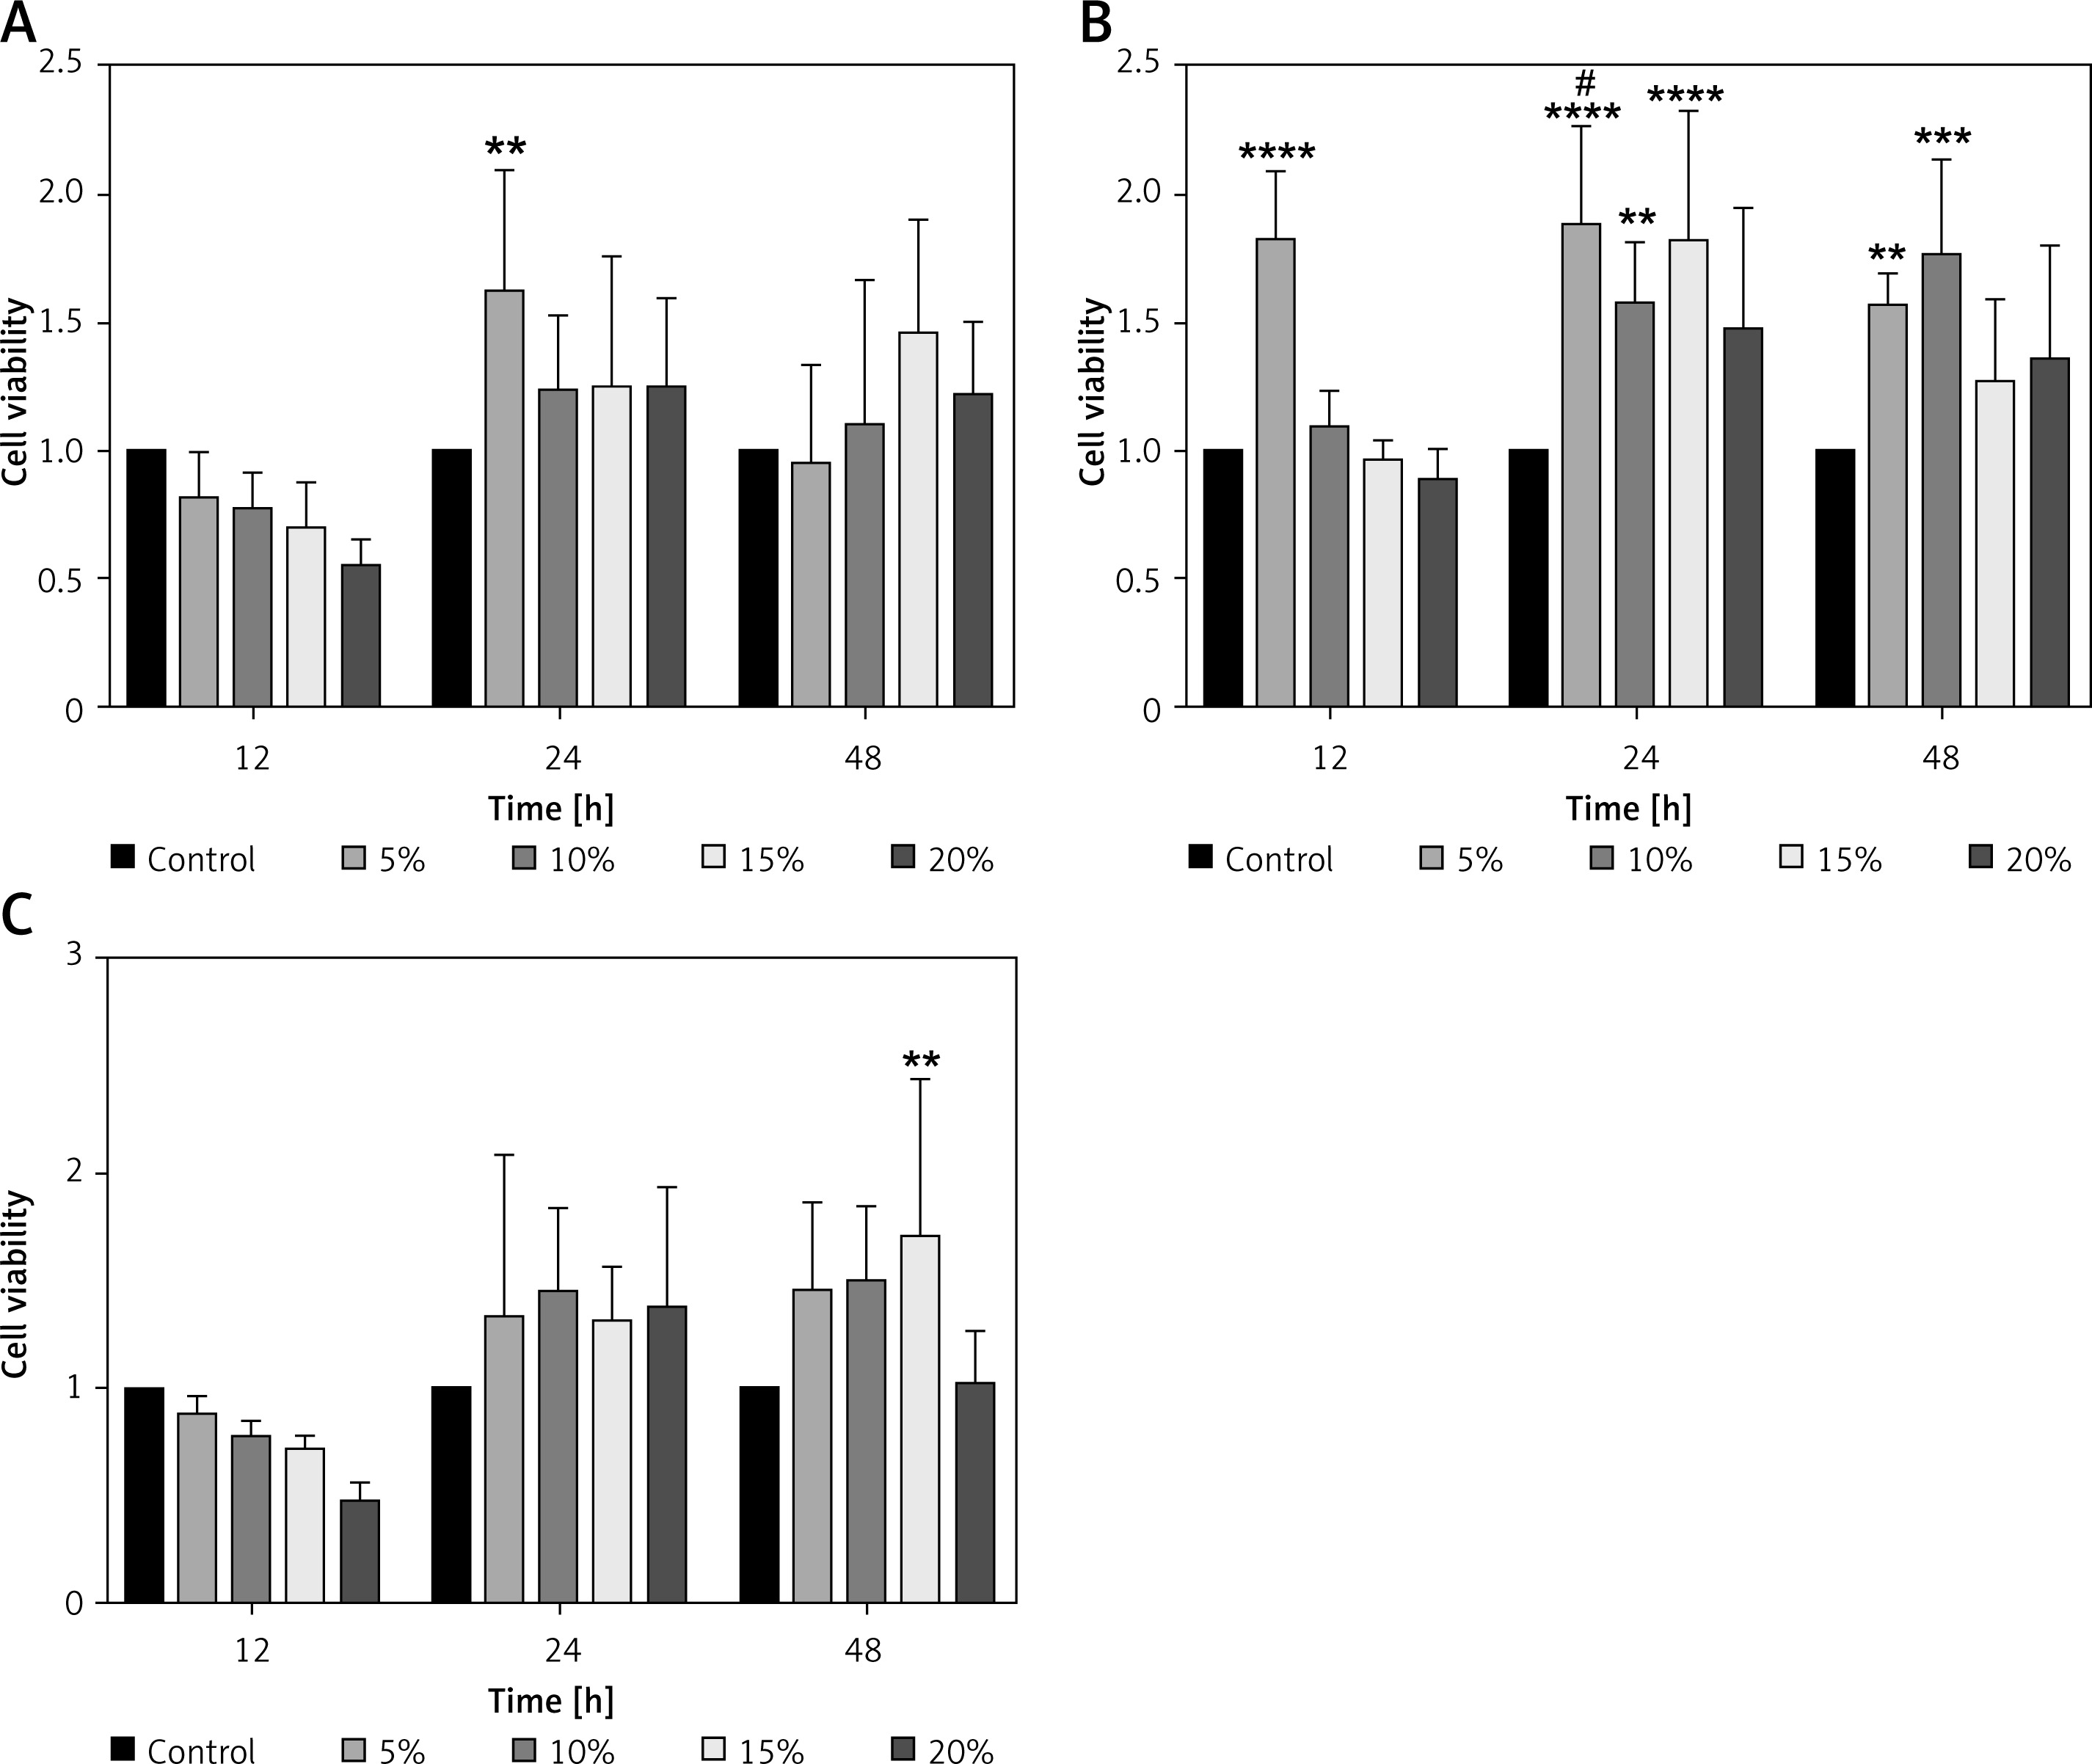
Table III
Effects of different concentrations of drug-containing serum at different time points on the activity of MPC-5 cells (± S)
| Groups | Serum concentration | Time | ||
|---|---|---|---|---|
| 12 h | 24 h | 48 h | ||
| YGYS-L | 5% | 0.82 ±0.16 | 1.63 ±0.42* | 0.96 ±0.34 |
| 10% | 0.78 ±0.12 | 1.24 ±0.26 | 1.10 ±0.51 | |
| 15% | 0.72 ±0.15 | 1.25 ±0.46 | 1.47 ±0.40 | |
| 20% | 0.56 ±0.09 | 1.25 ±0.31 | 1.23 ±0.25 | |
| YGYS-M | 5% | 1.83 ±0.23* | 1.89 ±0.35*# | 1.58 ±0.11* |
| 10% | 1.20 ±0.13 | 1.58 ±0.21* | 1.77 ±0.33* | |
| 15% | 0.97 ±0.07 | 1.81 ±0.47* | 1.28 ±0.29 | |
| 20% | 0.90 ±0.10 | 1.48 ±0.43 | 1.36 ±0.40 | |
| YGYS-H | 5% | 0.89 ±0.06 | 1.34 ±0.69 | 1.46 ±0.38 |
| 10% | 0.78 ±0.58 | 1.45 ±0.35 | 1.50 ±0.31 | |
| 15% | 0.72 ±0.05 | 1.33 ±0.23 | 1.71 ±0.66* | |
| 20% | 0.47 ±0.09 | 1.38 ±0.51 | 1.03 ±0.21 | |
YGYSG medicated serum inhibited autophagy of MPC-5 cells
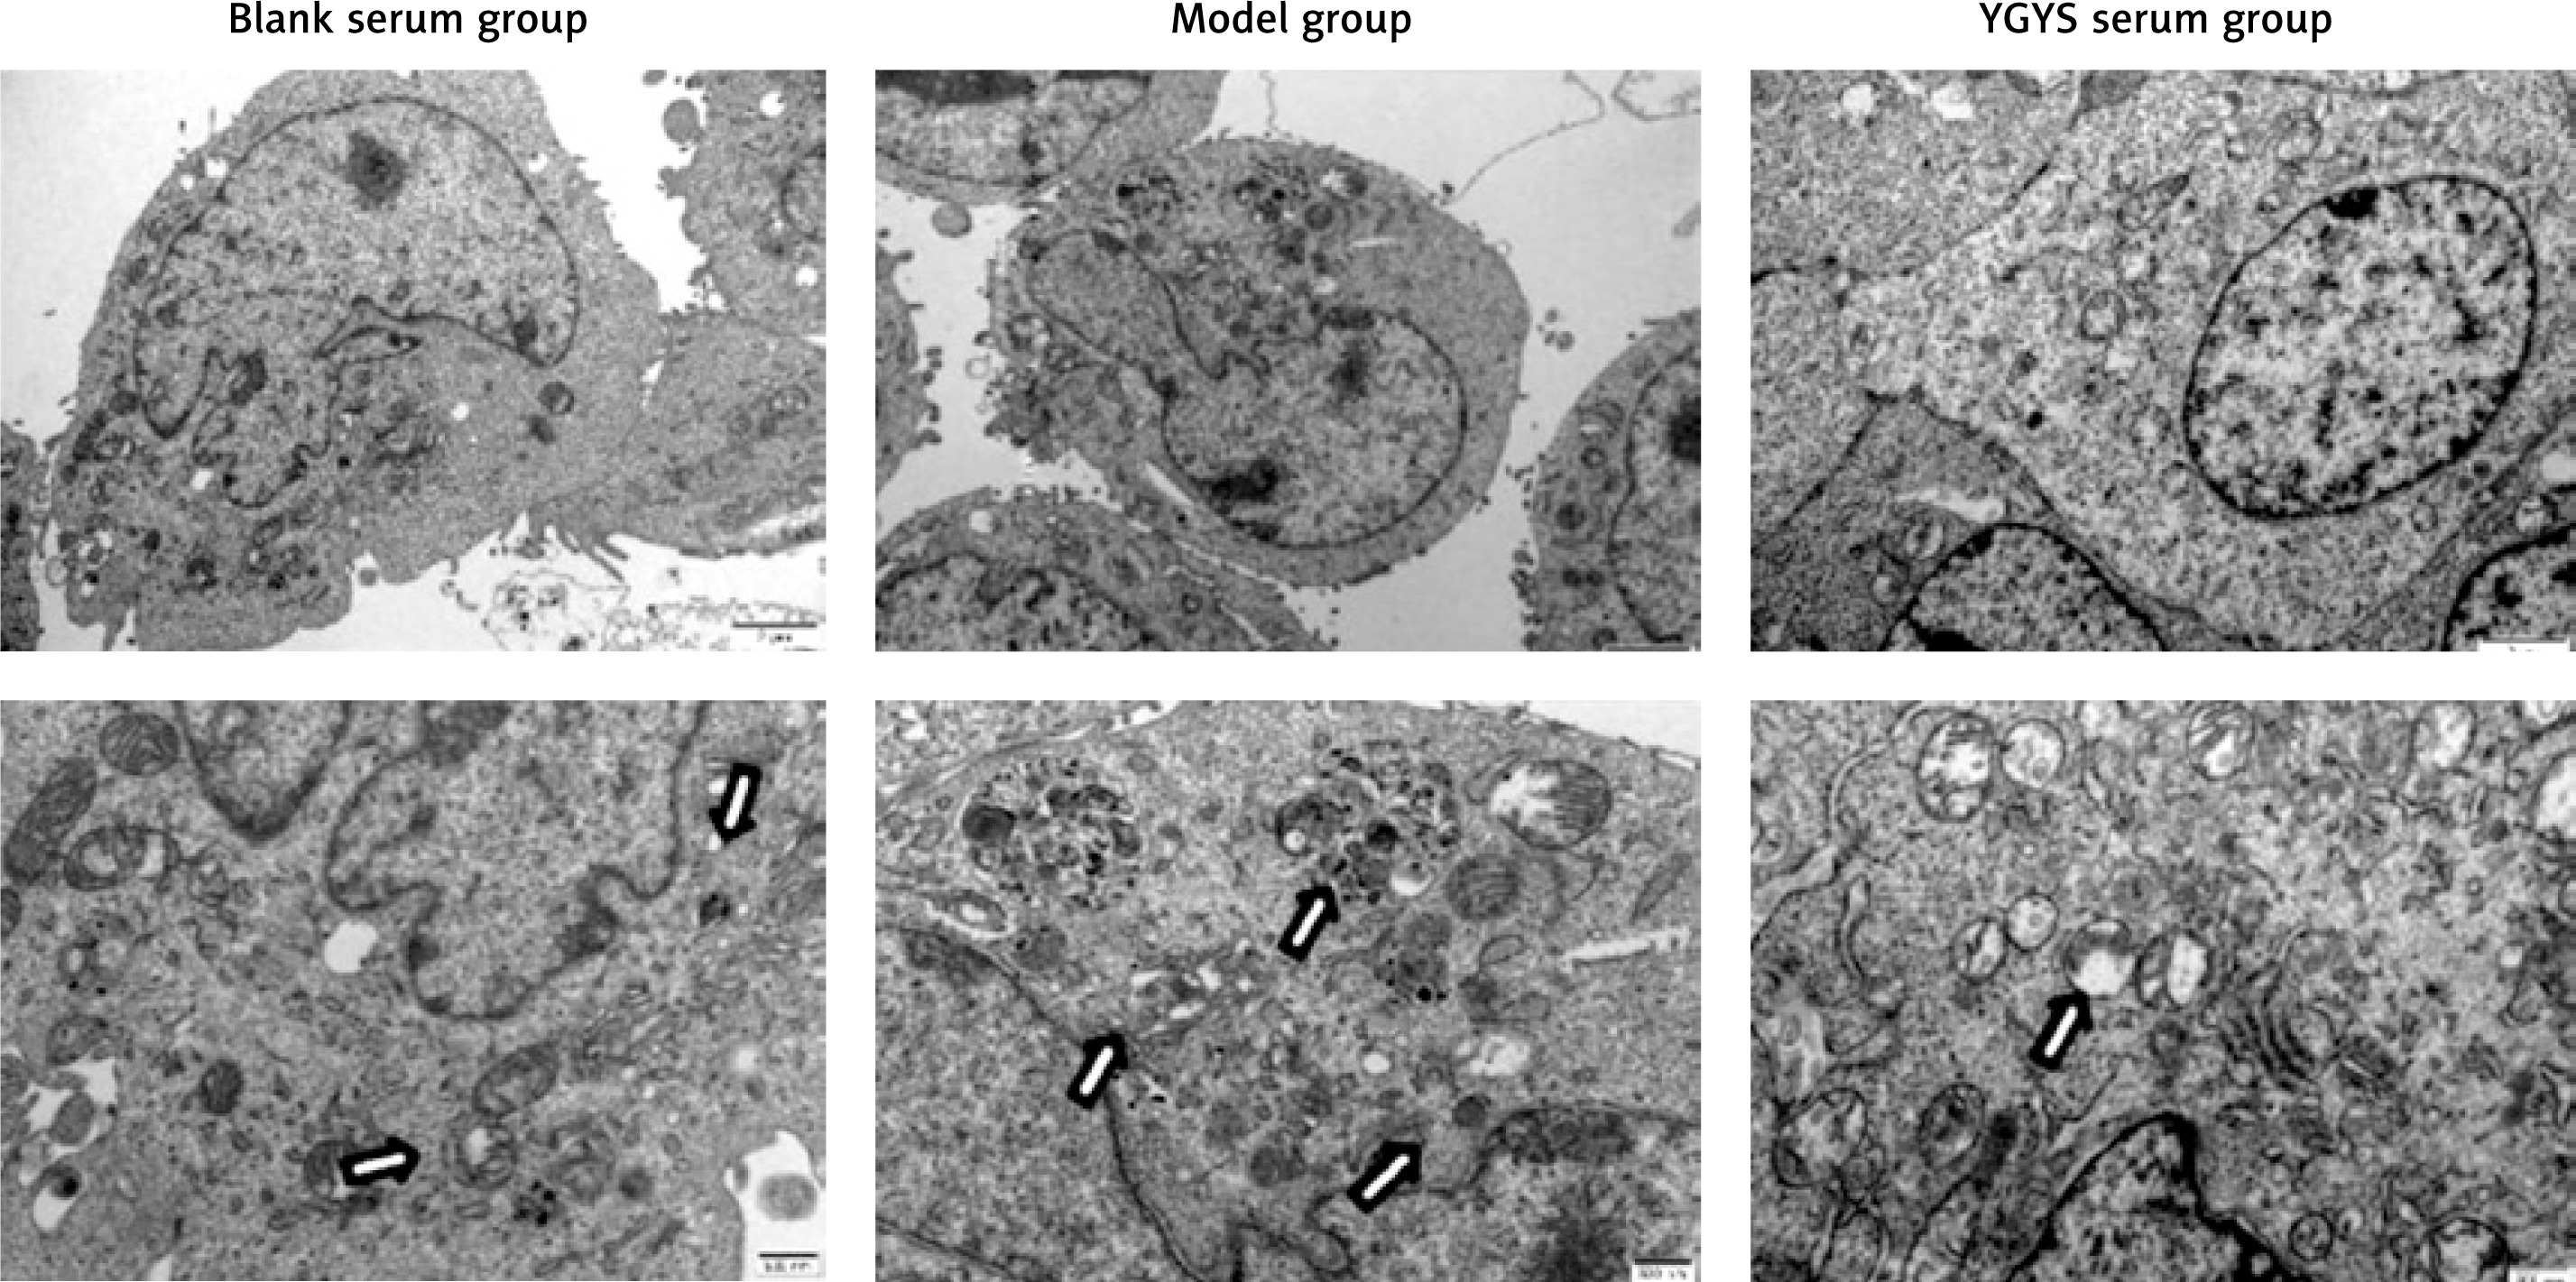
We studied the presence of autophagic vacuoles using TEM. TEM observations showed that autophagosomes in the normal group had a normal morphology and organelle structure. Ang II-stimulated podocytes showed over-expanded autophagosomes, the number of which increased greatly, and the structure of the organelles was destroyed. The organelles of YGYSG-treated cells appeared intact, the autophagosomes were smaller in shape and significantly reduced in number, and the double-layer membrane structure of the autophagosomes was complete (Figure 9). These morphological changes indicated that YGYSG inhibited autophagy in renal podocytes.
YGYSG inhibits autophagy of MPC-5 cells through the PI3K/AKT/mTOR signaling pathway
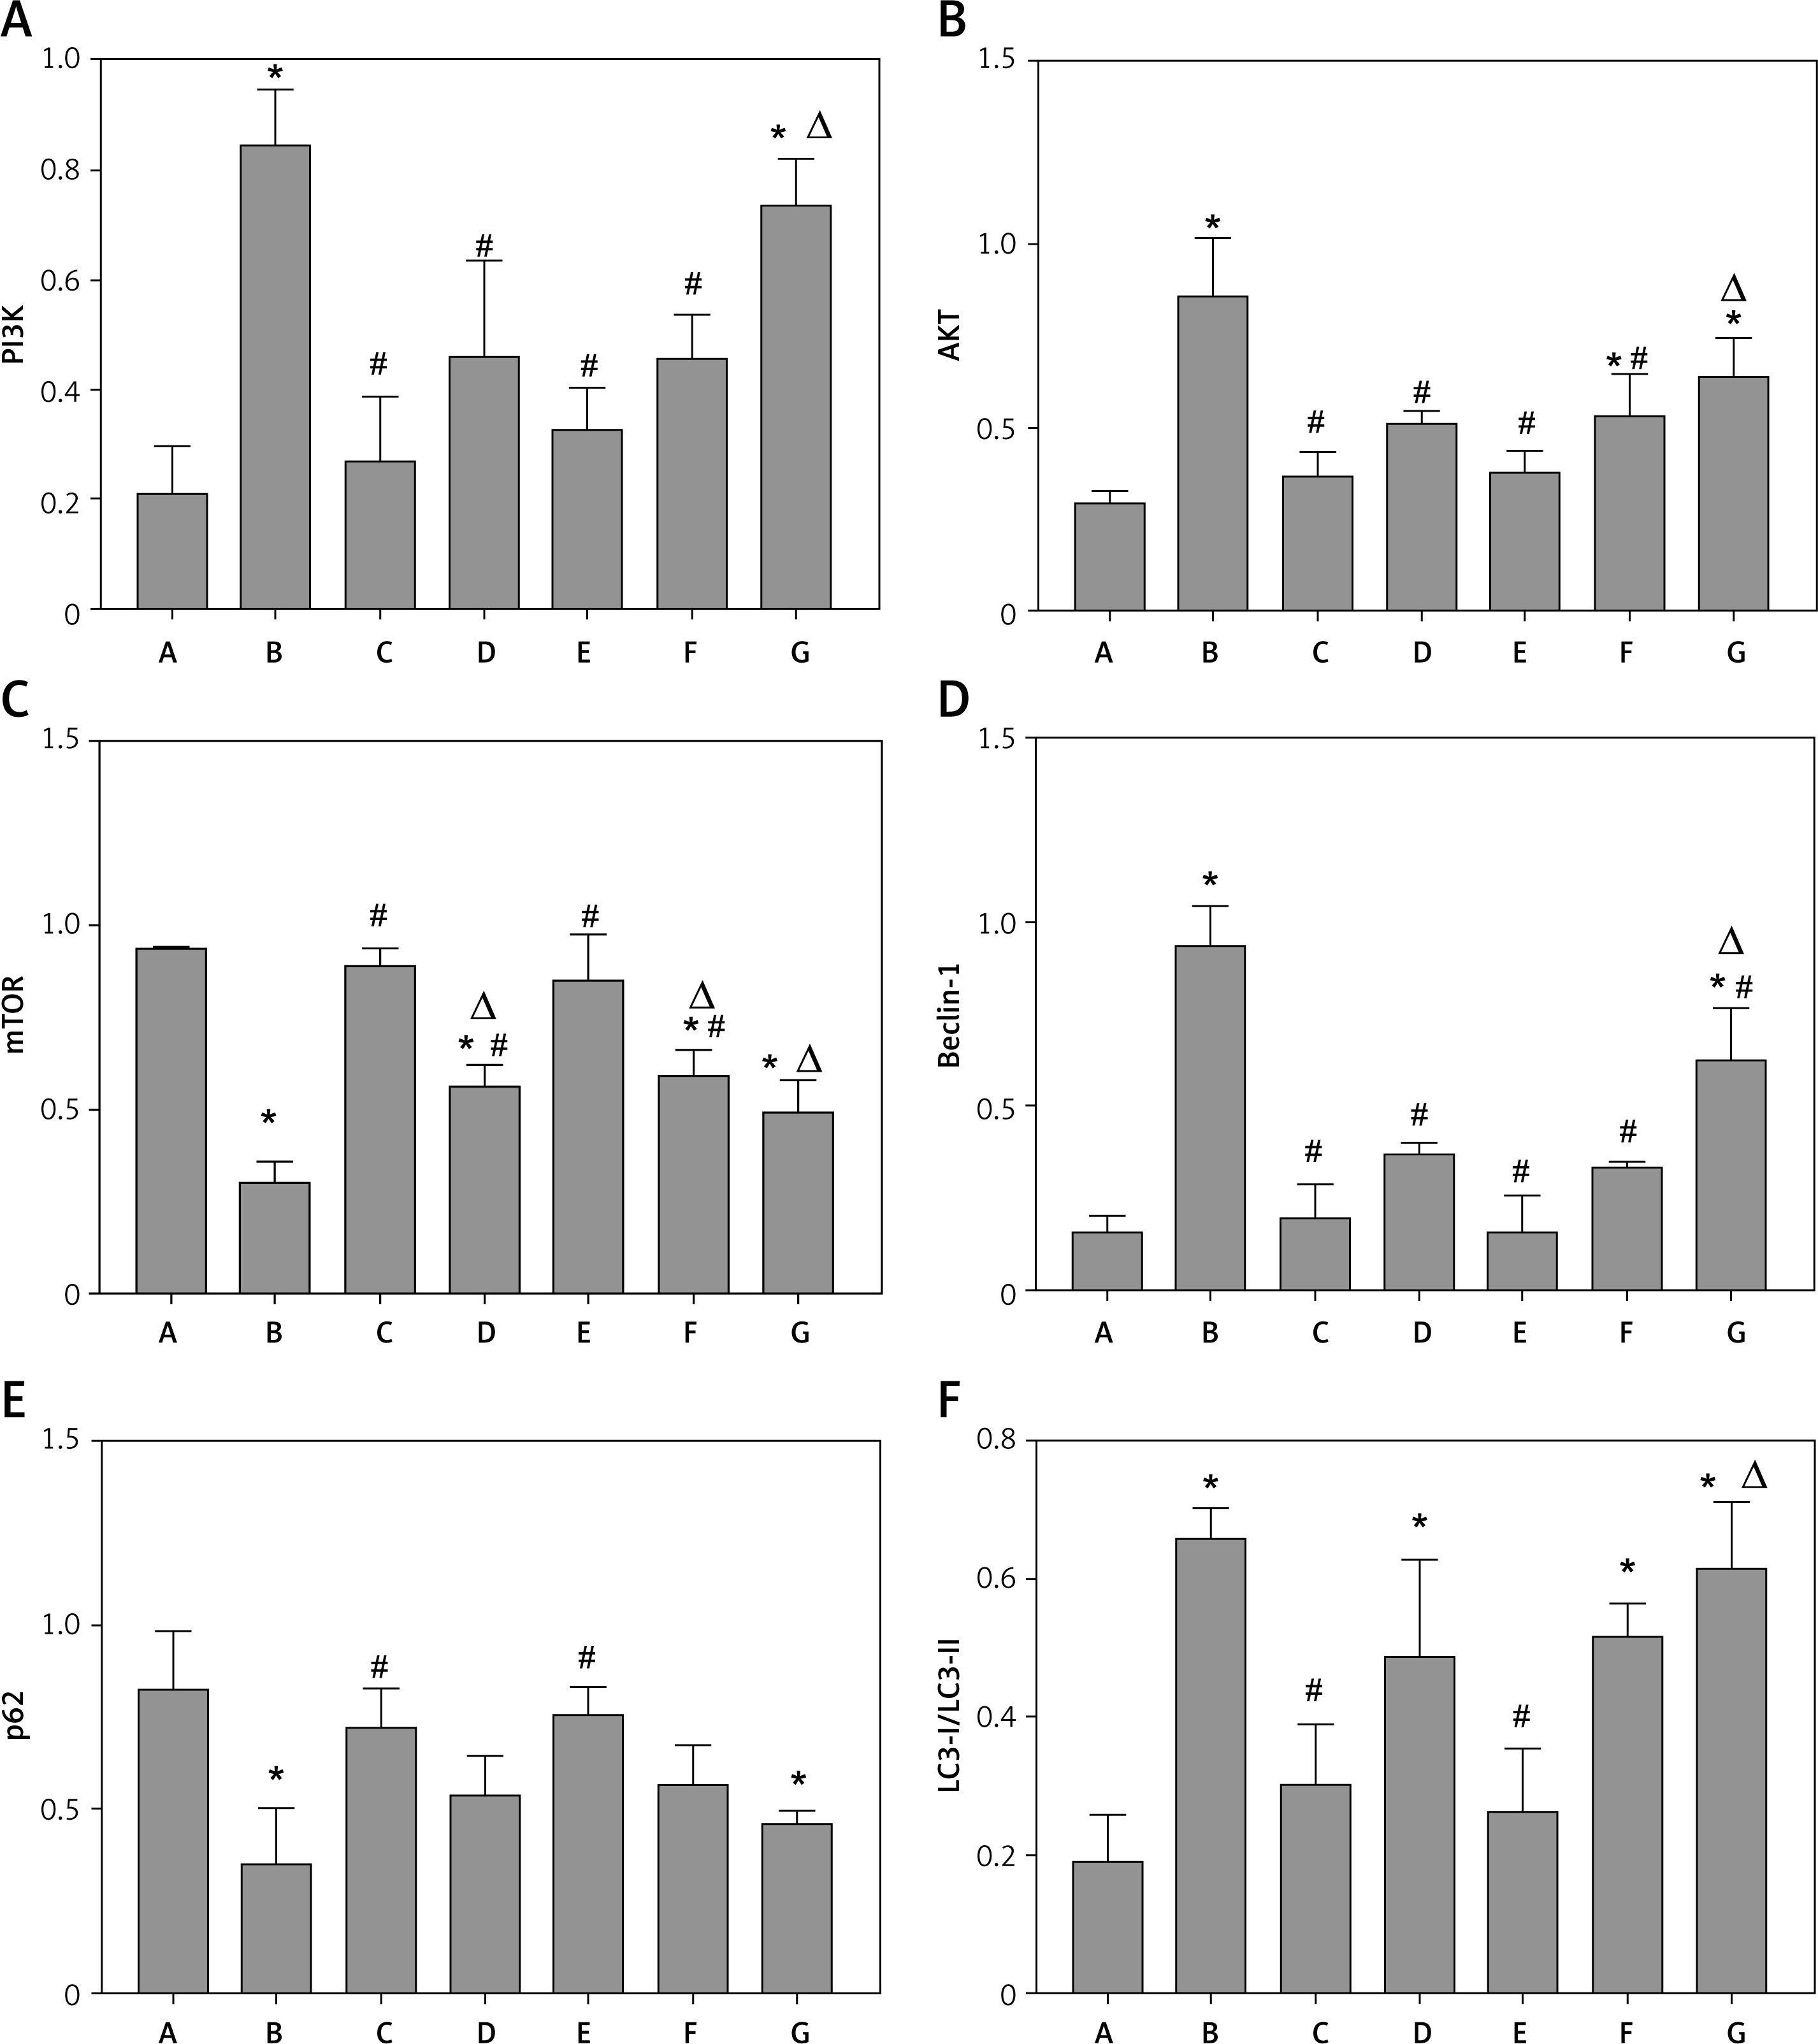
To explore the precise role of YGYSG-medicated serum in Ang II-induced autophagy of MPC-5 cells, western blotting and RT-qPCR were employed to measure the levels of PI3K/AKT/mTOR signaling pathway and autophagy-related markers. The results showed that, compared with the control group, the protein expression of PI3K, AKT, and beclin-1 in the model and YGYS-L groups was elevated (p < 0.05, Figures 10, 11) and the protein expression of LC3-II/LC3-I in the model, benazepril, YGYS-M, and YGYS-L groups was elevated (p < 0.05, Figures 10, 11). The expression of mTOR and p62 proteins in the model and YGYS-L groups was lower than that of the control group (p < 0.05, Figures 10, 11). Compared to the model group, the protein expression of PI3K, AKT, and beclin-1 in the 3-MA, benazepril, YGYS-H, and YGYS-M groups was downregulated (p < 0.05, Figures 10, 11), whereas the protein expression of mTOR in the 3-MA, benazepril, YGYS-H, and YGYS-M groups was upregulated (p < 0.05, Figures 10, 11). The protein expression of p62 in the 3-MA and YGYS-H groups was elevated, whereas that of LC3-II/LC3-I in the 3-MA and YGYS-H groups was decreased (p < 0.05, Figures 10, 11). Furthermore, the expression of mTOR protein was downregulated in the benazepril, YGYS-H, and YGYS-M groups, whereas the expression of PI3K, AKT, beclin-1, and LC3-II/LC3-I in the YGYS-L group was higher (p < 0.05, Figures 10, 11) than that in the 3-MA group.
Figure 10
Protein expression of PI3K, AKT, mTOR, beclin-1, LC3-II/LC3-I, p62 in each group. A – Control group; B – Model group; C – 3-MA group; D – Benazepril group; E – YGYS-H group; F – YGYS-M group; G – YGYS-L group. Compared with control group, *p < 0.05; compared with model group, #p < 0.05; compared with 3-MA groups, Δp < 0.05
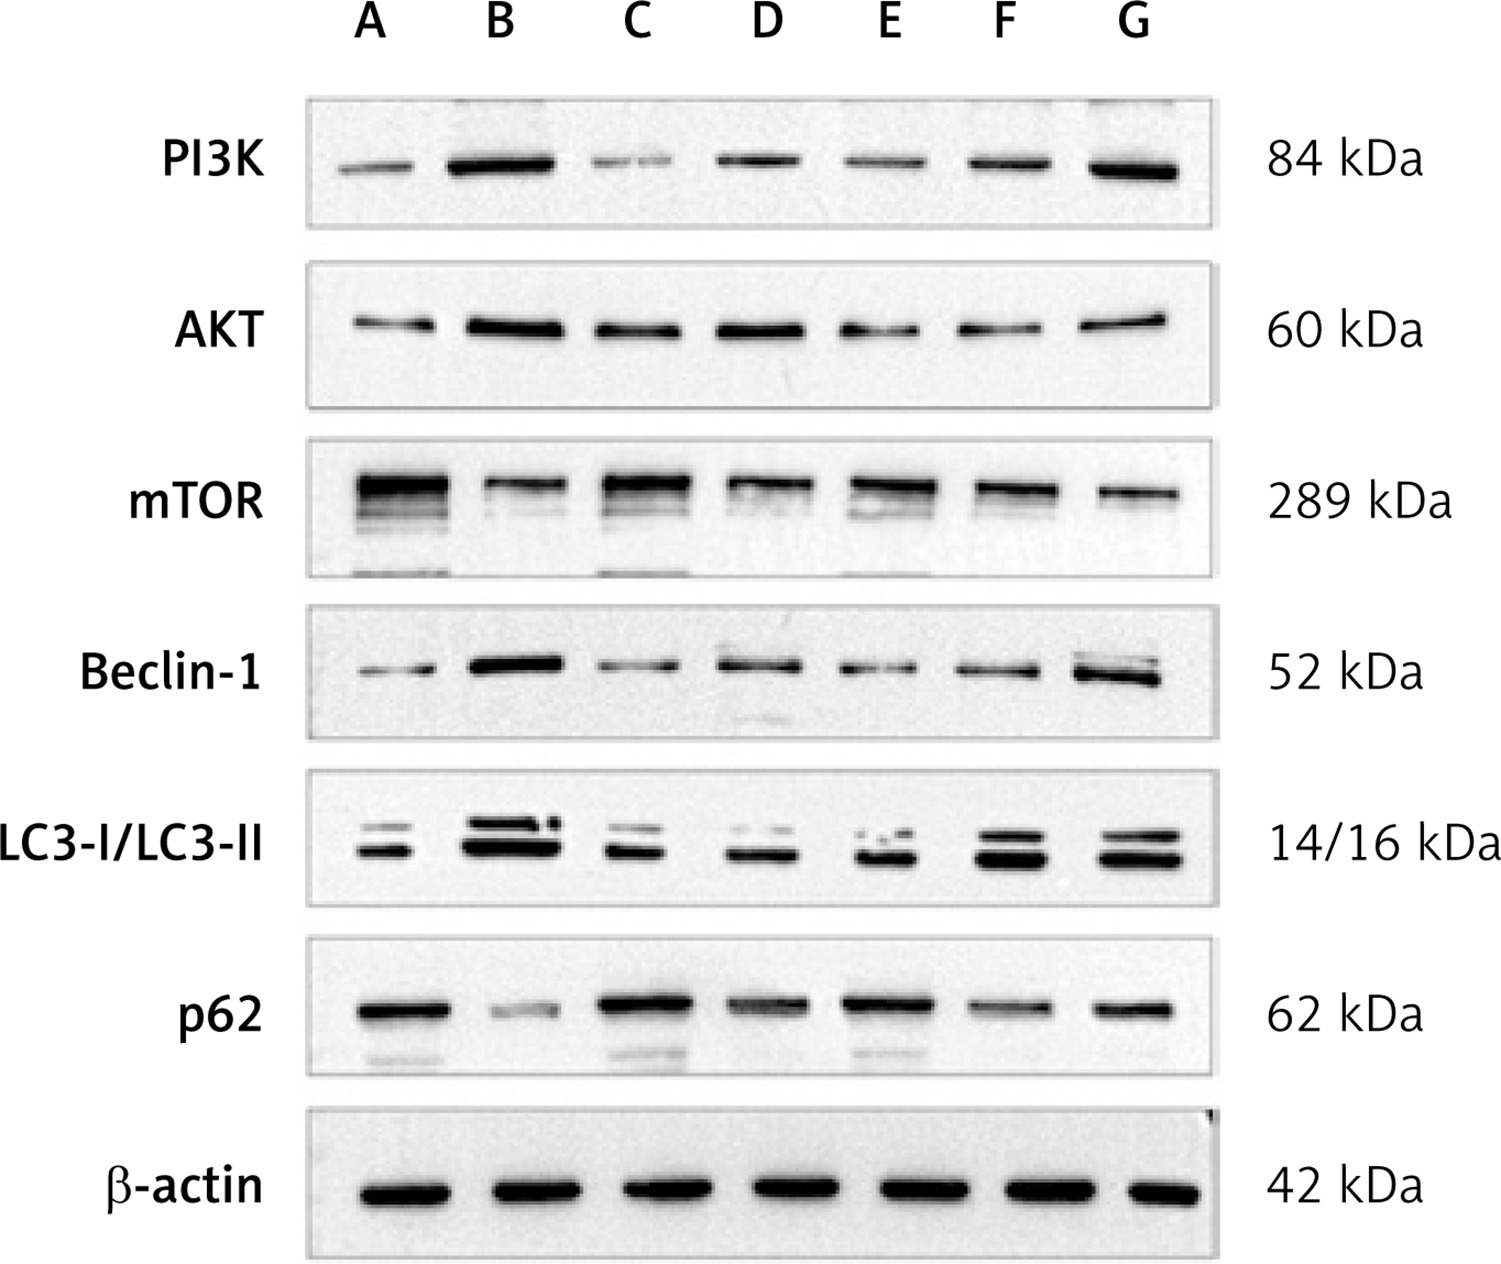
Figure 11
Quantitative analysis of protein expression of PI3K (A), AKT (B), mTOR (C), beclin-1 (D), p62 (E), and LC3-I/LC3-II (F), in each group. A – Control group; B – Model group; C – 3-MA group; D – Benazepril group; E – YGYS-H group; F – YGYS-M group; G – YGYS-L group. Compared with control group, *p < 0.05; compared with model group, #p < 0.05; compared with 3-MA groups, Δp < 0.05
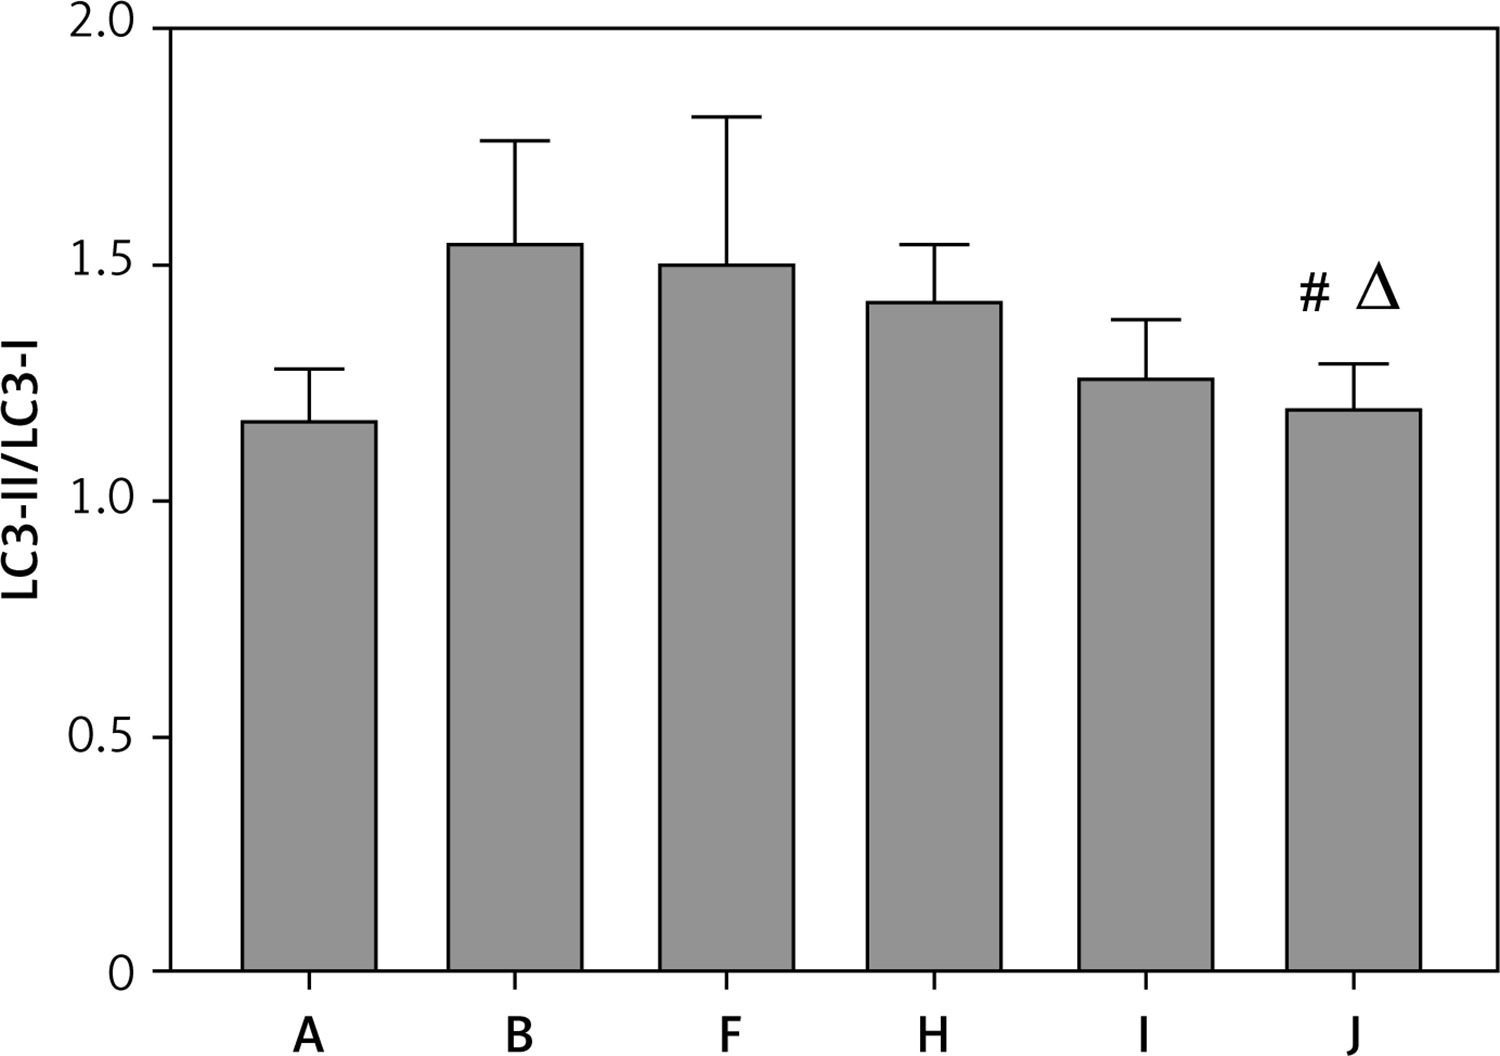
The RT-qPCR results showed that, compared to the control group, PI3K, AKT, and mTOR mRNA expression in the model, benazepril, YGYS-M, and YGYS-L groups was elevated (p < 0.05, Figure 12). Compared with the model group, PI3K, AKT, and mTOR mRNA expression in the 3-MA, benazepril, YGYS-H, YGYS-M, and YGYS-L groups was lower (p < 0.05, Figure 12). Compared to the 3-MA group, AKT and mTOR mRNA expression in the benazepril, YGYS-M, and YGYS-L groups was elevated (p < 0.05, Figure 12), and PI3K mRNA expression in the YGYS-M and YGYS-L groups was elevated (p < 0.05, Figure 12). To clarify the relationship between YGYS-containing serum and autophagy, we conducted a response experiment. The results showed that the protein expression level of LC3-II/LC3-I in the YGYS-M + 3-MA (25 mM) group was significantly lower than that in the model group (p < 0.05, Figures 13, 14). Compared to the YGYS-M group, the protein expression level of LC3-II/LC3-I in the YGYS-M + 3-MA (25 mM) group was significantly lower (p < 0.05, Figures 13, 14). These results indicated that YGYSG and autophagy have a synergistic relationship in MPC-5 cells, and YGYSG may inhibit autophagic activity by activating the PI3K/AKT/mTOR signaling pathway.
Figure 12
mRNA expression of PI3K (A), AKT (B), mTOR (C) in each group. A – Control group; B – Model group; C – 3-MA group; D – Benazepril group; E – YGYS-H group; F – YGYS-M group; G – YGYS-L group. Compared with control group, *p < 0.05; compared with model group, #p < 0.05; compared with 3-MA groups, Δp < 0.05
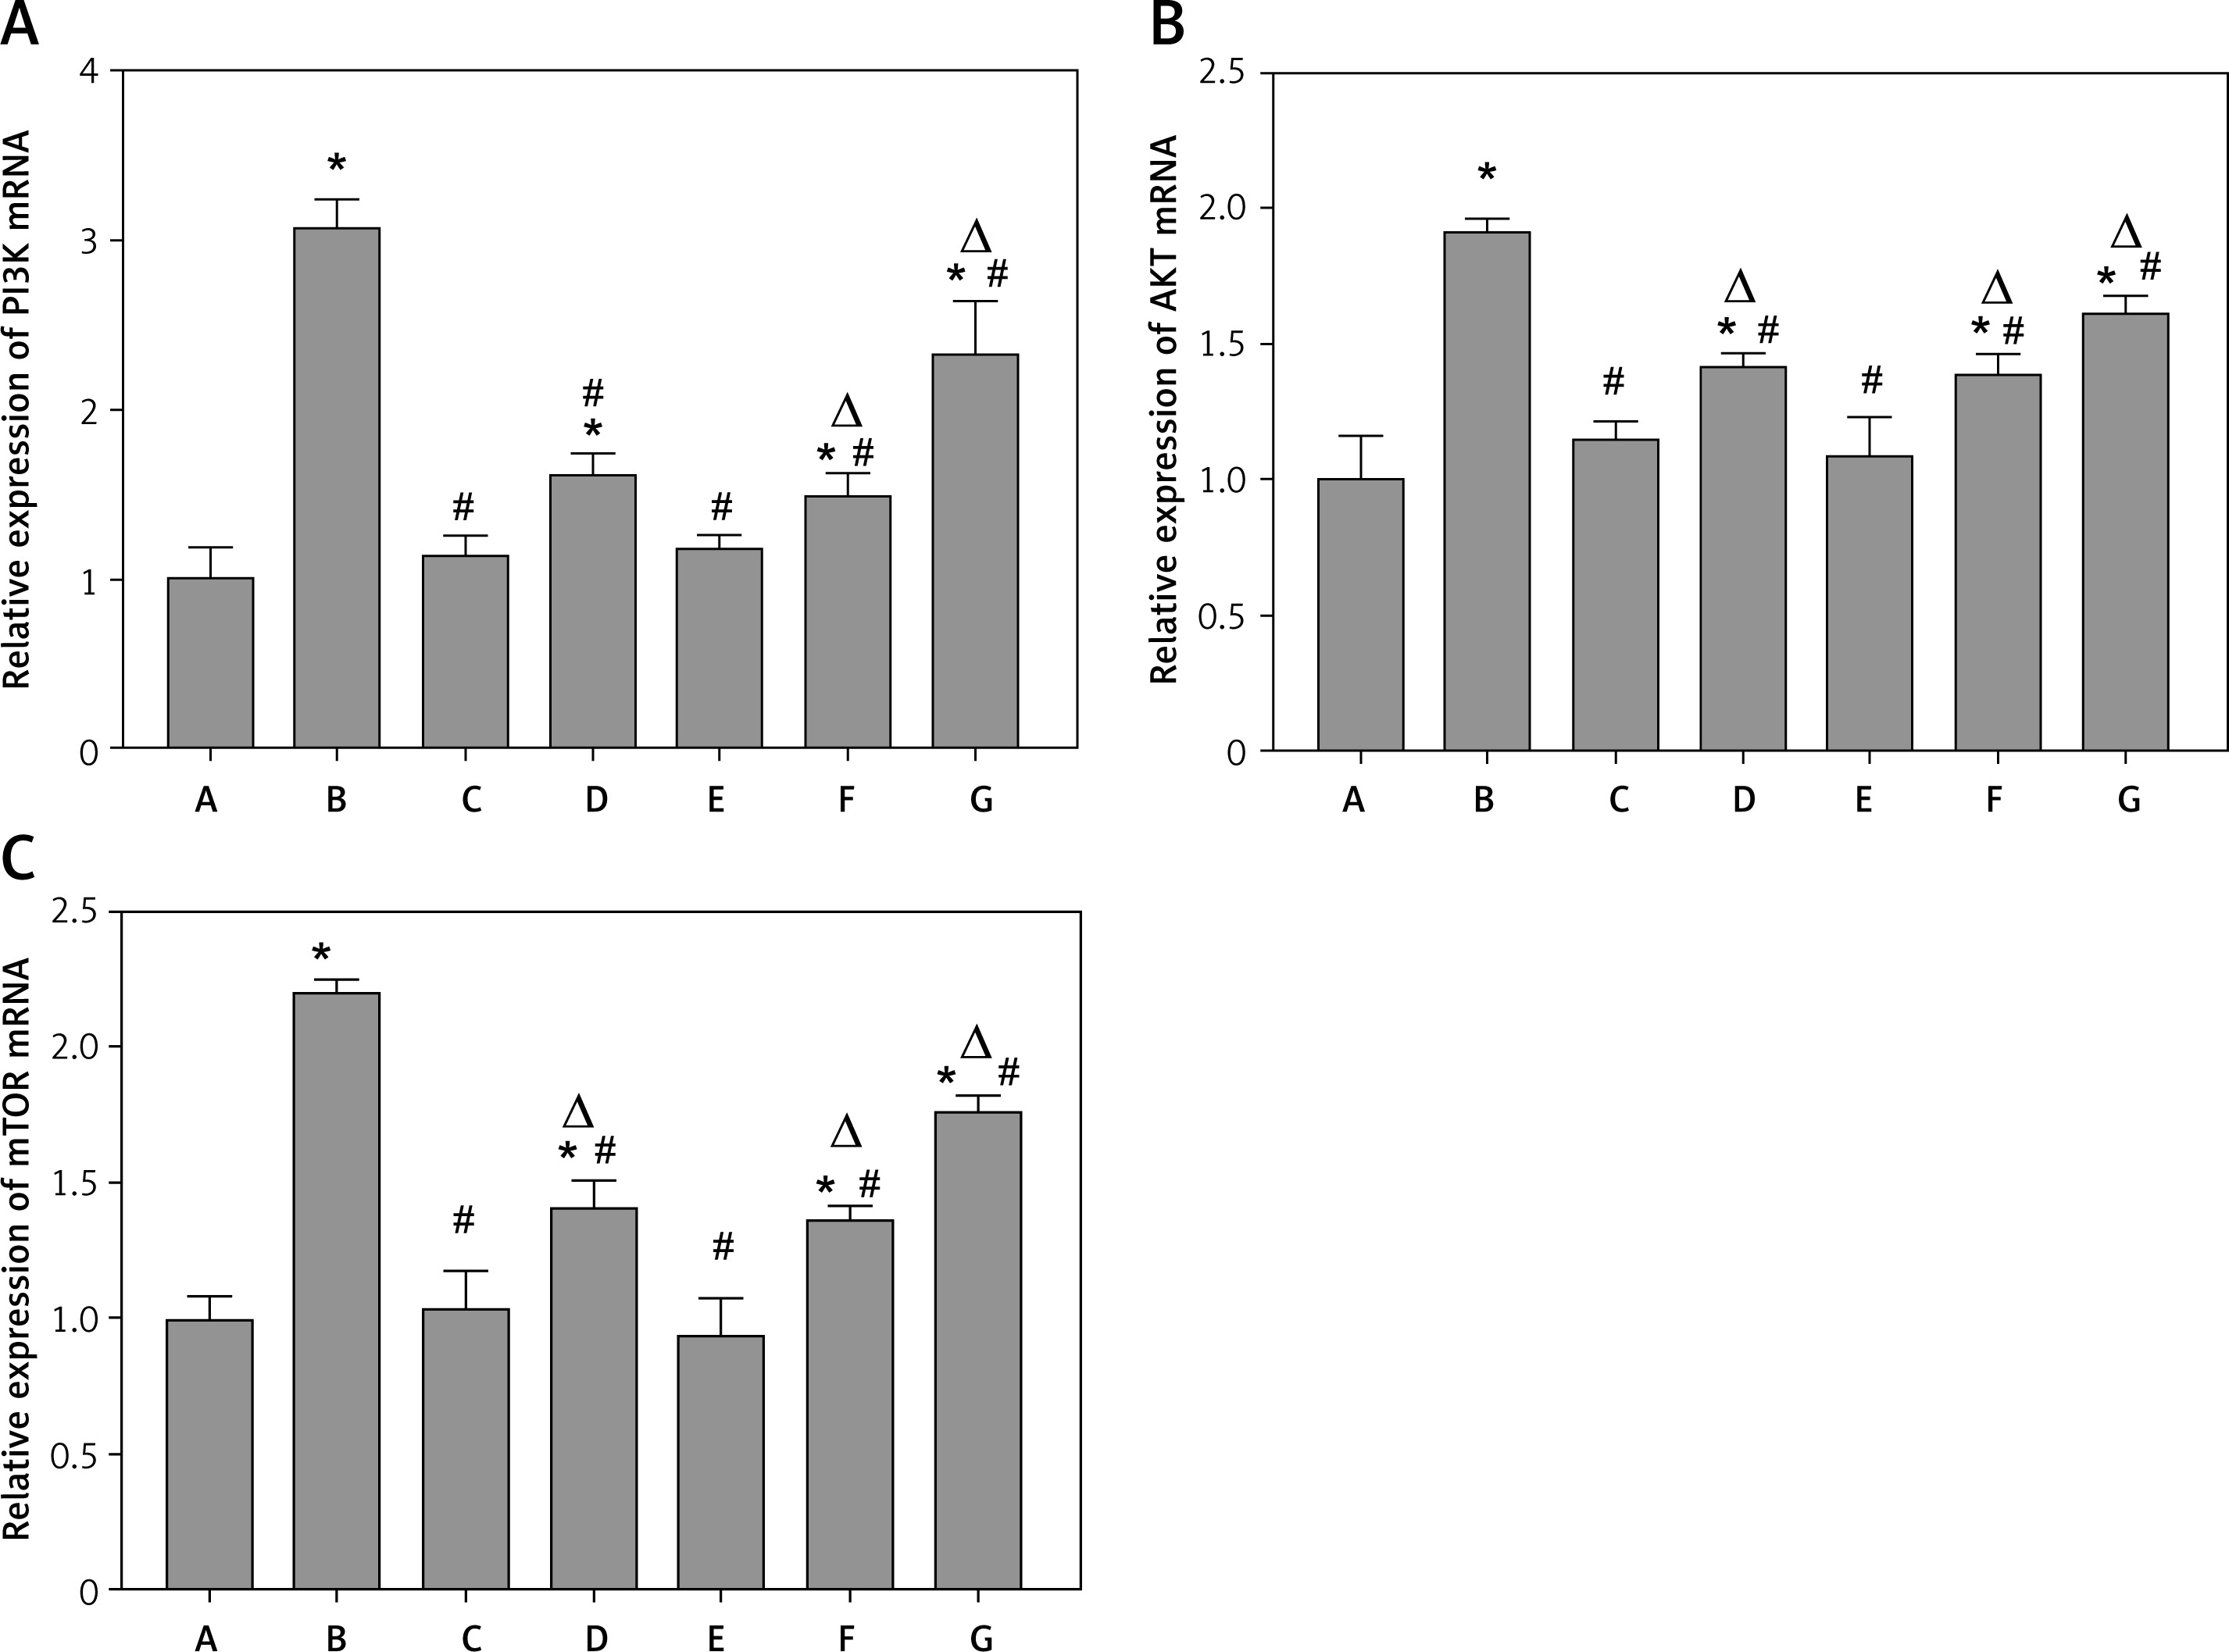
Figure 13
Protein expression of LC3-II/LC3-I in each group. A – Control group; B – Model group; F – YGYS-M group; H – YGYS-M + 3-MA (1 mM) group; I – YGYS-M + 3-MA (5 mM) group; J – YGYS-M + 3-MA (25 mM) group. Compared with model group, #p < 0.05; compared with YGYS-M group, Δp < 0.05

Figure 14
Quantitative analysis of protein expression of LC3-II/LC3-I in each group. A – Control group; B – Model group; F – YGYS-M group; H – YGYS-M + 3-MA (1 mM) group; I – YGYS-M + 3-MA (5 mM) group; J – YGYS-M + 3-MA (25 mM) group. Compared with model group, #p < 0.05; compared with YGYS-M group, Δp < 0.05
Discussion
Hypertension is a threat to global human health, and its incidence is increasing annually [30]. Chronic uncontrolled hypertension can also lead to kidney damage [31]. Traditional Chinese medicine, which has multiple targets and fewer side effects, plays an important role in the treatment of hypertension. Previous studies have shown that YGYSG improves vascular endothelial disorders, regulates blood pressure and inflammatory responses, and improves clinical symptoms in patients with HRD [32].
Autophagy is the process of self-degradation of damaged organelles to maintain homeostasis in the intracellular environment [33]. Autophagy has long been considered beneficial to the body because it can help remove harmful pathogen products and simultaneously degrade discarded organelles to produce nutrition energy [34, 35]. This is most evident in the early development of tumors [36]. However, autophagy is a double-edged sword and abnormally activated autophagy can cause cell damage [37]. Recent studies have shown that autophagy is involved in kidney disease and is closely related to HRD. Long-term hypertension leads to abnormal renal autophagy, an important factor in HRD progression and development [27]. In this study, the associated targets and signaling pathways of YGYSG, autophagy, and HRD were screened using network pharmacology. Network pharmacological analysis showed that the core components of YGYS used to treat hypertensive kidney injury through the autophagy pathway were quercetin, kaempferol, beta-sitosterol, stigmasterol, luteolin, isorhamnetin, tanshinone II, 7-O-methylisomucronulatol, baicalein, and formononetin. Studies have found that quercetin has physiological effects on cell apoptosis, autophagy, pyroptosis, and other cellular processes [27] and inhibits the formation of kidney autophagosomes in mice by inhibiting oxidative stress [36]. Kaempferol can regulate beclin-1, LC3, and endoplasmic reticulum stress levels [38] and inhibit the autophagic activity of cells by degrading p62/SQSTM1 [39]. Luteolin can reduce Ang II-induced kidney injury in HRD [40] and regulate autophagy in kidney injury by participating in the AMPK/mTOR signaling pathway [41]. As a flavonoid, isorhamnetin is involved in the treatment of liver, tumors, and other diseases [42] and plays various inhibitory roles in autophagy [43]. This suggests that our bioinformatics analysis is consistent with existing reports, indicating that YGYSG may alleviate HR by regulating cellular autophagy.
Ang II is an important activator of the RAAS system, which plays an important role in the pathogenesis of HRD and renal autophagy. Studies have found that in patients with HRD, the concentration of Ang II in the kidney is higher than that in circulating blood [44], and Ang II can directly act on podocytes, resulting in excessive autophagy [45]; therefore, we chose Ang II for in vitro stimulation. Excessive autophagy induced by Ang II aggravates damage to the renal blood vessels and podocytes [27]. Our previous studies showed that YGYSG regulates Ang II levels during HRD treatment [46]. TEM observations showed that Ang II-stimulated podocytes showed over-expanded autophagosomes, the number of which increased greatly, and the structure of the organelles was destroyed, as has been reported by previous authors. Notably, the number and morphology of autophagosomes in the YGYSG group were normal and the morphology of the organelles was improved. The core targets identified by the protein interaction analysis were TP53, AKT1, STAT3, JUN, CASP3, TNF, MYC, MTOR, EGFR, and MAPK1. Most of these targets are associated with inflammation and REDOX. In the state of hypertension, inflammatory products accumulate in renal vessels, and the protein expression of AKT1, STAT3, and TNF, which are important markers of hypertensive kidney injury, is upregulated [47].
Furthermore, we demonstrated that the HRD targets of YGYSG were mainly enriched in the PI3K/AKT/mTOR signaling pathway and mTOR signaling; therefore, we selected the PI3K/AKT/mTOR signaling pathway as the focus of further research. PI3K, a phosphatidylinositol kinase, activates the downstream target growth factor receptor (EGFR), which alters AKT protein structure. The mammalian target proteins of rapamycin (mTOR) are divided into mTOR1 and mTOR2, with mTOR1 being a key target in the regulation of autophagy [48]. When the intracellular energy levels are unbalanced, PI3K/AKT and mTOR are activated, inhibiting autophagy [6]. Compared to the model group, the protein expression of PI3K, AKT, beclin-1, and LC3-II/LC3-I was downregulated after YGYSG treatment, whereas the protein expression of mTOR and p62 was upregulated. These results are consistent with previous reports, indicating that YGYSG may alleviate HRD by regulating the PI3K/AKT/mTOR signaling pathway and modulating autophagy processes.
Certainly, this study has some limitations. In the cell experiment, we conducted a small response experiment to show the relationship between YGYSG and autophagy. However, the mechanism of action of YGYSG for Ang II-induced hyperautophagy in renal podocytes requires further investigation. In the future, we will verify the effect of YGYSG on the regulation of HRD through the PI3K/AKT/mTOR pathway in vivo and conduct further in vitro experiments to provide a possible basis for the treatment of HRD using traditional Chinese medicine.
In conclusion, our results showed a synergistic relationship between YGYSG and autophagy in HRD. This study utilized network pharmacology and in vitro experiments to investigate the effects of YGYSG on HRD through the autophagy pathway. Network pharmacology identified key targets and compounds associated with YGYSG’s action, focusing on the PI3K/AKT/mTOR signaling pathway and autophagy-related processes. In vitro experiments using Ang II-stimulated renal podocytes demonstrated that YGYSG exerts therapeutic effects by modulating autophagy via the PI3K/AKT/mTOR pathway in hypertensive renal damage. This study has important implications for improving outcomes in HRD research and clinical practice.