Type 1 diabetes (T1D), constituting approximately 5–15% of diabetes cases in high-income countries and 2% in low- and middle-income countries [1], is associated with adverse outcomes in the micro- and macrovascular systems, resulting in an elevated risk of premature mortality and substantial health and economic burdens [2]. It is also acknowledged as a risk factor for various malignancies, including pancreatic cancer (PCa), and the overall cancer incidence is reported to be 10% higher in diabetic patients [3, 4]. A small but noteworthy body of research has suggested that T1D also constitutes a significant risk factor for PCa [5]. Nevertheless, limited by observational study designs that are prone to selection bias, reverse causation, and confounding factors [5–8], the causal relationship between T1D and PCa remains unestablished.
Mendelian randomization (MR) has emerged as a robust alternative for addressing these challenges [9]. It employs genetic variants as instrumental variables (IV) to investigate the causal relationship between exposure and outcome. By using genetic variants as surrogates for the exposure of interest, MR can provide unbiased causal effect estimates, overcoming some limitations associated with traditional observational studies. The large number of genetic variants identified from large-sample genome-wide association studies (GWAS) of both T1D and PCa presents an opportunity to investigate their causal relationship. Several previous MR analyses have been conducted to assess the causal relationship between T1D and PCa, most of which were from European populations and yielded non-significant findings [10–13]. However, no such investigations have been reported in other ethnic groups, leaving a gap in obtaining a thorough understanding of the T1D–PCa relationship, for instance, in East Asians.
It has been demonstrated that there are nearly ten genes/pathways linking diabetes, β-cell development regulation, and PCa, including the TGF-β and Wnt/β-catenin pathways [14]. Interestingly, the genetic architecture of diabetes varies across ancestries; for example, PAX4 and KCNQ1 are the most significant susceptibility loci in East Asians, while this is not the case in Europeans. Incorporating multi-ethnic study participants enables a comparative analysis of the causal relationships between T1D and PCa in different ethnic populations, representing a timely extension of the existing literature. Thus, we conducted a two-sample MR investigation to assess the causal associations of T1D with PCa in both European and East Asian populations. We hypothesized that genetic susceptibility to T1D and its related pathways is associated with PCa.
Methods
Study design
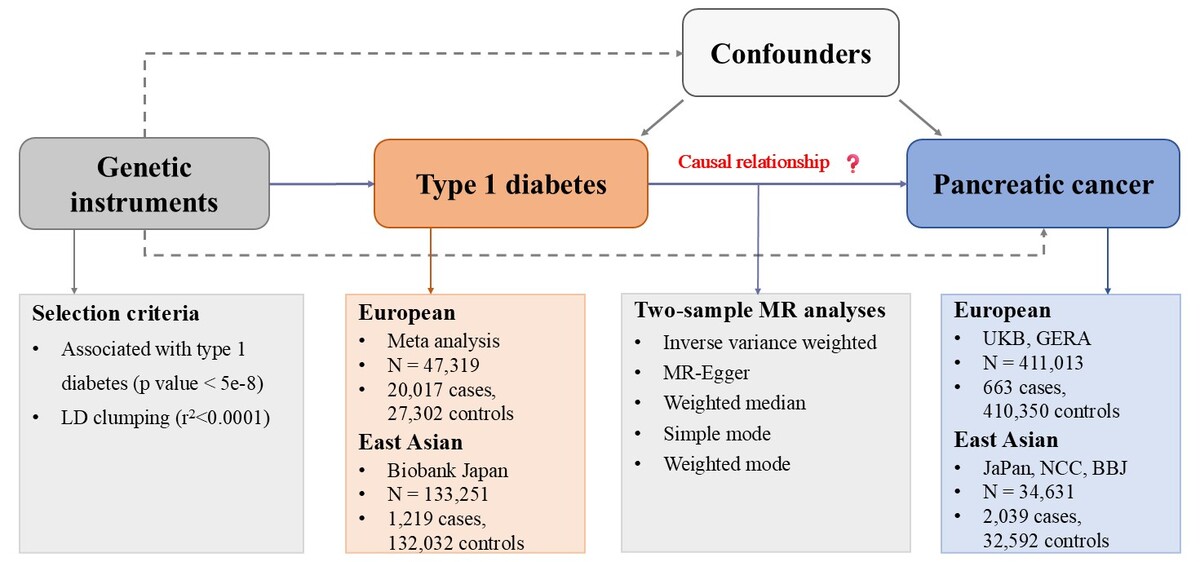
The study design is illustrated in Figure 1. We first leveraged the T1D GWAS data to select suitable IVs and obtained the effect of the IVs on the exposure, and acquired the GWAS summary-level data of the PCa and obtained the effect of the above IVs on the PCa. Then we conducted MR analysis, accompanied by multiple sensitivity analyses.
Figure 1
Study design. We began by acquiring GWAS data related to T1D and selecting a suitable instrumental variable and obtained the effect of the IV on the exposure. Subsequently, we acquired the GWAS data of the outcome and obtained the effect of the above IV on the PCa. Then we conducted MR analysis, accompanied by sensitivity analyses
MR – Mendelian randomization, LD – linkage disequilibrium, UKB – UK Biobank, GERA – Kaiser Permanente Genetic Epidemiology Research on Adult Health and Aging cohorts, JaPAN – the Japan Pancreatic Cancer Research Consortium, NCC – the National Cancer Center, BBJ – Biobank Japan.
Data sources
The data sources of this study are listed in Supplementary Table SI. We extracted summary data from a meta-analysis of T1D GWAS, encompassing 47,319 participants of European ancestry [15]. The summary statistics used for PCa were derived from the most extensive GWAS meta-analysis to date, encompassing 411,013 participants from two major population-based cohorts from Europeans: the UK Biobank and the Kaiser Permanente Genetic Epidemiology Research on Adult Health and Aging cohorts [16]. For the East Asians, we used T1D GWAS data from Biobank Japan (n = 133,251) [17]. The GWAS meta-analysis for PCa included 34,631 participants and was based on three Japanese studies [18].
Selection of IVs
We used genetic variants of T1D that passed the GWAS genome-wide significance threshold (p < 5 × 10⁻⁸) as defined in the original study and had an effect allele frequency (EAF) > 0.01. We then clumped these genetic variants at a linkage disequilibrium (LD) threshold of r2 < 0.001 within ± 10,000 kilobases (kb). When palindromic variants were present, strand alignment was inferred using allele frequency information. Following the default conservative harmonization strategy in TwoSampleMR, palindromic single nucleotide polymorphisms (SNPs) with intermediate minor allele frequency (MAF > 0.42) were excluded to avoid strand ambiguity. We also explored the potential influence of the original GWAS data quality control and population stratification correction on the study results. More detailed information is provided in the Supplementary Methods.
MR analysis
Instrumental variables were matched to PCa datasets by orienting the effects of the exposure and the outcome to the same effect allele. If an instrument was missing in the outcome dataset, a genetic variant with high LD (r2 > 0.8) to the instrument was selected as a proxy instrument where possible. An inverse-variance weighted (IVW) approach was used to combine variant-level Wald ratio estimates into an overall effect estimate.
Validation of MR assumptions and sensitivity analyses
The study findings were reported following the guidelines outlined in STROBE-MR (Strengthening the Reporting of Mendelian Randomization Studies). We rigorously assessed the three crucial assumptions of MR through a comprehensive set of sensitivity analyses. We determined the strength of genetic predictors using R2 and F-statistics, with an F-statistic above 10 considered as evidence against weak instrument bias.
To scrutinize the exclusion restriction assumption, we conducted multiple sensitivity analyses, including MR-Egger regression, weighted median analysis, and both simple and weighted mode analyses. We used the Egger intercept and associated P-values to assess pleiotropy, while Cochran’s Q test was employed to estimate the heterogeneity among instruments. We also generated scatter plots to assess potential violations of MR assumptions and compare regression slopes from different MR analyses. Finally, a leave-one-out analysis was conducted to evaluate whether the causal relationship obtained in the study depended on or leaned towards a single variant. Statistical power was estimated using the mRnd framework under a binary outcome model, with causal effect sizes transformed to the exposure liability scale based on population prevalence of T1D in Asian populations [19].
All the analyses were performed on the R platform (version 4.2.1). The “TwoSampleMR,” “Mendelian Randomization,” and “ggplot2” packages were used.
Results
Characteristics of genetic variants associated with T1D are shown in Supplementary Tables SII, SIII. Fifty-nine SNPs in Europeans and three in East Asians were selected, and the F statistics for all variants were greater than 10 (range 29.9 to 2060.8 in Europeans and 30.5 to 32 in East Asians). The MR estimated based on the IVW method indicated a modest association with borderline statistical significance between genetically predicted T1D and PCa (odds ratio [OR] = 1.25, 95% confidence interval [CI]: 1.03–1.52, p = 0.028) in the East Asian population. Three alternative methods – weighted median, simple mode, and weighted mode – showed similar effect estimates. However, no significant associations were found in the European population (OR = 1.01, 95% CI: 0.94–1.09, p = 0.811) (Table I).
Table I
Mendelian randomization analysis of type 1 diabetes on pancreatic cancer
[i] Odds ratio (OR), 95% confidence interval (CI), and p-values were calculated for the respective method of MR analysis. The heterogeneity test in the inverse-variance weighted methods was performed using Cochran’s Q statistics. SNP – single nucleotide polymorphism. N SNPs : number of SNPs used for estimation of causal associations. P for pleiotropy refers to the p-value for the intercept of MR-Egger regression. P for heterogeneity refers to the p-value for the heterogeneity test.
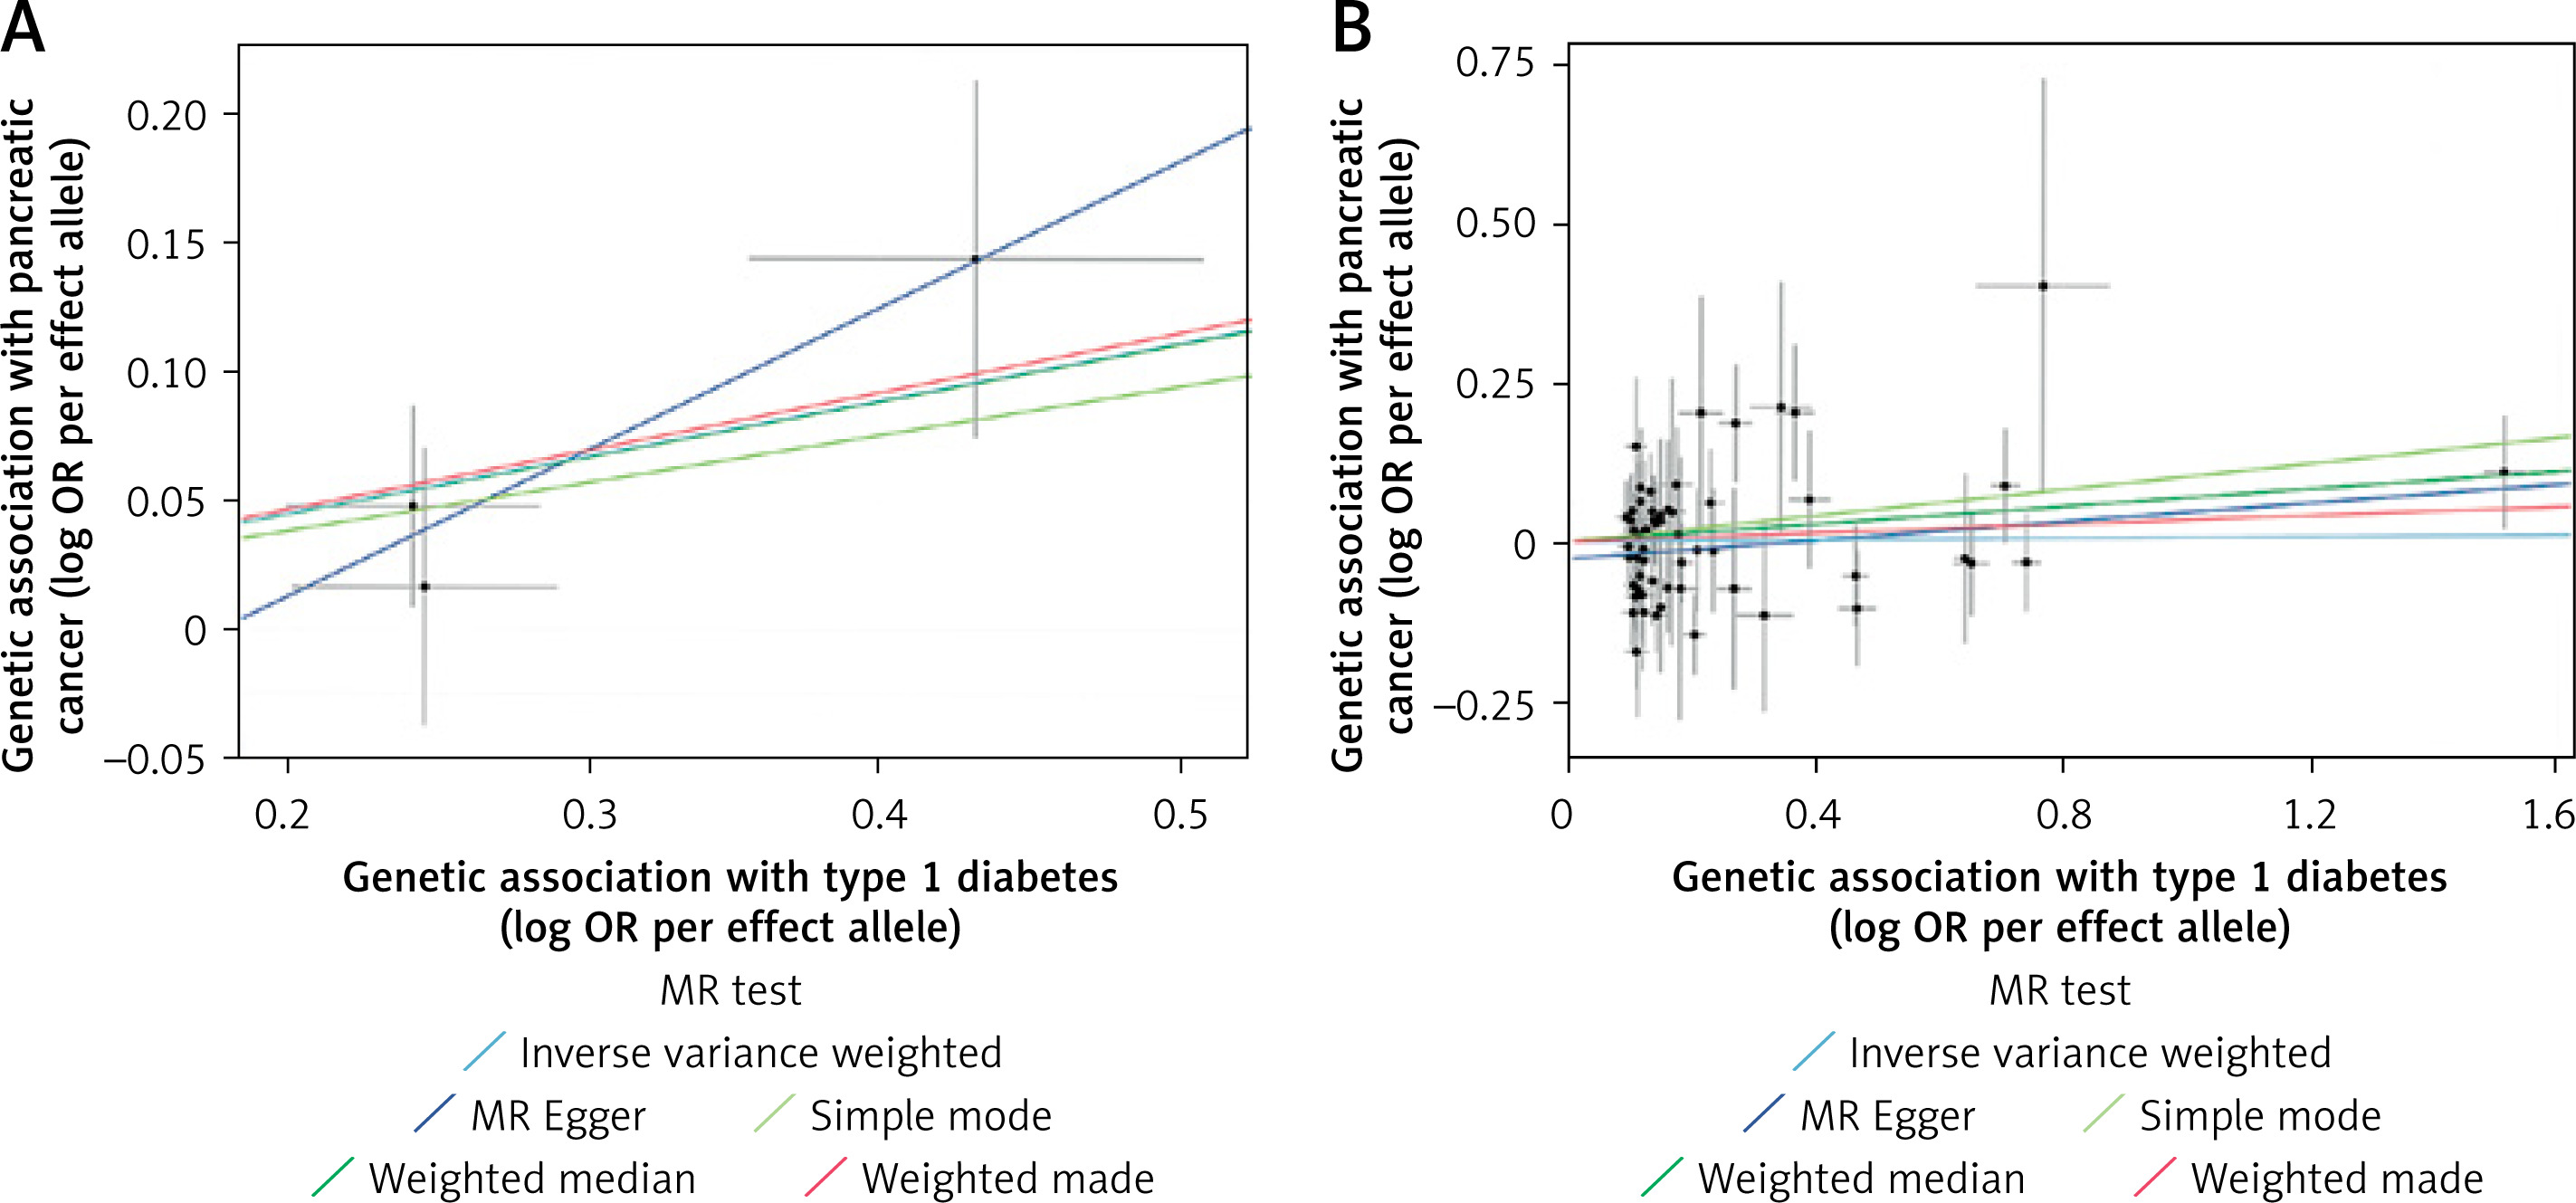
No strong evidence of horizontal pleiotropy or heterogeneity was detected based on the results of pleiotropy and heterogeneity test results or the scatter plot (both P-values of MR-Egger intercept and Q statistic > 0.05) (Table I, Figure 2). The leave-one-out analysis results identified that none of the SNPs dominated the estimated causal association between T1D and PCa (Supplementary Figure S1). The single-SNP Wald ratio estimates for East Asians and Europeans showed that the associations were unlikely driven by any single SNP (Supplementary Figure S2). Steiger tests were additionally performed to evaluate instrument directionality. The results indicated that all selected SNPs explained a greater proportion of variance in the exposure than in the outcome, supporting the assumed causal direction (Supplementary Table SIV).
Figure 2
Scatter plots of Mendelian randomization analysis of type 1 diabetes on pancreatic cancer. Scatter plots depict SNP-level associations with type 1 diabetes (x-axis) and pancreatic cancer (y-axis), shown as log odds ratios per effect allele. Error bars denote standard errors. Colored lines indicate causal estimates from different Mendelian randomization methods. Results are shown separately for East Asian (A) and European (B) populations
Discussion
Using multi-ethnic large-sample GWAS data and MR analysis methods, we found a marginally statistically significant association between genetically predicted T1D and PCa in East Asians, which should be interpreted cautiously due to the limited number of instrumental SNPs and relatively small sample size. No significant associations were observed in Europeans. This study expands the MR findings to ethnic groups other than the most widely studied European populations. Considering the limited IV variants and the relatively low incidence of T1D in East Asians, the findings are largely exploratory and hypothesis-generating and should be interpreted cautiously. Further genetic studies with a larger sample size or applying advanced analytical methods are warranted.
Emerging epidemiological evidence suggests an association between T1D and PCa, both in Europeans [5, 7] and East Asians [8]. A registry study across five European countries, with a total of 9,149 cancers occurring among T1D patients in 3.9 million person-years, demonstrated 1.53- and 1.25-fold elevated risks of PCa among males and females, respectively [7]. A retrospective cohort study, comprising 14,619 T1D patients from Taiwan’s National Health Insurance medical claims database, demonstrated a 1.61-fold increase in PCa risk in males and a 3.10-fold increase in females [8]. However, it is crucial to acknowledge limitations in these studies, including potential misclassification of diabetes type and concerns regarding reverse causation, as evidenced by the attenuation of such associations over time after diabetes diagnosis and becoming insignificant upon exclusion of cases where diabetes was an indicator of cancer [7]. Despite these challenges, the present MR study identified a possible causal association between genetically predicted T1D and PCa in East Asians, but not in European populations. Of note, even though we used independent GWAS data sources for both T1D and PCa, our results were consistent with the previous MR analysis performed in Europeans [10–13], which provided confirmatory evidence of the non-significant causal association in European populations.
Racial disparities in the association between T1D and PCa were observed in our study. The East Asian causal estimates should be interpreted with caution, as its borderline statistical significance and modest effect size must be contextualized against key limitations, including a wide confidence interval reflecting imprecision, and the epidemiological context of low T1D incidence (2% of diabetes cases in East Asia) and rare PCa (about 5 cases per 100,000 people annually). Notably, given that only three instrumental SNPs were available in East Asians, the regression-based sensitivity methods such as MR-Egger and heterogeneity tests have very limited degrees of freedom and may be underpowered. Thus, the non-significant results should not be interpreted as evidence of no pleiotropy or heterogeneity. Given the marginally significant results and the limited number of IV SNPs, our East Asian estimate is purely hypothesis-generating and should not be considered conclusive evidence of a causal relationship. Further validation in larger East Asian GWAS with expanded IV sets is therefore warranted. Several considerations support the cautious interpretability of our results. Firstly, all three instrumental variants demonstrated adequate strength, with F-statistics exceeding the conventional threshold of 10, reducing the likelihood of weak instrument bias. Secondly, the direction and magnitude of the causal estimates were broadly consistent across multiple MR methods (IVW, weighted median, simple mode, and weighted mode), providing some reassurance against method-specific bias. Thirdly, leave-one-out analyses and single-SNP Wald ratio estimates did not suggest that the observed association was driven by a single SNP, despite the limited number of instruments. In addition, the small number of IVs in East Asian populations may raise concerns about the statistical power. Under the specified assumptions, post-hoc power was estimated at ~84% for an OR of 1.25; importantly, this does not mitigate the limited robustness and bias diagnostics available with only three instruments in East Asians. The overall robustness of causal inference remains constrained by the limited number of instruments and the rarity of both the exposure and outcome. Taken together, these considerations underscore the need for replication in larger East Asian cohorts with expanded instrumental variable sets to confirm robustness.
Within the East Asian population, there is some overlap in samples between the exposure and outcome databases, which is restricted to the Biobank Japan (BBJ) subset of the PCa cohort. Based on BBJ’s public metadata and cohort enrollment records, the PCa cohort includes 422 participants overlapping with the T1D GWAS dataset – corresponding to 1.2% of the East Asian PCa cohort (422/34,631) and 0.3% of the East Asian T1D cohort (422/133,251). Sample overlap, especially with weak instruments, can introduce bias into two-sample MR estimates, skewing the association between exposure and outcome. This degree of overlap is generally considered modest in two-sample MR settings [20]. We also assessed bias and type 1 error resulting from sample overlap using a web-based tool (https://sb452.shinyapps.io/overlap), and the results suggested that sample overlap is unlikely to be a significant issue that could distort our findings.
Additionally, when interpreting the study results, caution is warranted due to potential genetic heterogeneity among different races in the sample population, which could impact the outcomes. All the T1D and PCa GWAS datasets used in our study underwent rigorous ancestry correction via principal component analysis (PCA), following standard protocols for population stratification control, ensuring that population stratification was already controlled at the source of the data. Population stratification was addressed in the source GWAS through standard ancestry-adjustment procedures (e.g., principal components) and further minimized in our MR analyses using ancestry-matched instruments and LD reference panels; nevertheless, residual population structure cannot be completely excluded [20, 21]. Further ancestry-specific IV selection and LD pruning using ancestry-specific reference panels avoid the bias from allele frequency divergence between populations or stratification-related effects, allowing for a validated ancestry-specific MR analysis. Lastly, the observed ancestry-specific causal associations (significant in East Asians, null in Europeans) likely reflect a confluence of biological, environmental, and methodological factors beyond genetic ancestry alone.
Mechanistically, any links between genetic liability to T1D and PCa risk remain speculative and should be considered hypothesis-generating. Our MR analyses do not test specific biological pathways; therefore, functional and clinical studies are required to confirm the association and to elucidate potential mechanisms.
In conclusion, using a consistent two-sample MR framework and currently available GWAS summary statistics, we evaluated the association between genetic liability to T1D and PCa in European and East Asian populations. The study extends existing MR evidence by evaluating more than one ancestry within a consistent analytic framework. Further in vitro and in vivo basic studies are warranted to elucidate the underlying mechanisms linking T1D to pancreatic oncogenesis, and additional clinical evidence is needed to inform future investigations into potential biological links between T1D and pancreatic cancer.