Introduction
Circulating cell-free DNA (cfDNA) represents a new diagnostic marker in many medical fields or biomedical disciplines, such as in cancer research [1], as a tool for non-invasive prenatal genetic testing [2], or a marker of organ failure [3].
Sports medicine is a field where cfDNA analysis seems to be of extreme interest [4]. Increases in plasma cfDNA after exercise or physical activity have been repeatedly described [5–8] and have been suggested to be a potential hallmark of overtraining [9]. cfDNA concentration increases immediately after exercise and remains elevated for a short time (30–120 min), with quick normalization thereafter [10]. So far, predominantly cfDNA with origin in the nucleus (cfnDNA) has been analyzed in sport-related studies.
CfDNA has been detected in all body fluids [11]. Most commonly, cfDNA isolated from plasma is used for screening. Circulating cfDNA is represented by short (generally 100–180 bp long) double-stranded DNA fragments, mainly derived from cellular apoptosis or necrosis. Active secretion of short DNA fragments has also been described. Low concentrations of cfnDNA (~1000-2500 genome equivalent/ml or 0.1–100 ng/ml) in plasma are physiological [12, 13]; high plasma cfDNA concentrations are widely discussed as a biomarker of inflammation, tissue injury, or trauma [14].
Two types of internal cfDNA (external bacterial cfDNA has also been detected in plasma [15]) need to be distinguished: cfDNA originating from the nucleus (cfnDNA) and cfDNA originating from mitochondria (cfmtDNA). As there are commonly several hundred mitochondria per cell (and just one nucleus), the amount of released cfmtDNA in body fluids is expected to be much higher in comparison with cfnDNA. Similarly, also the variability of plasma concentration of cfmtDNA would probably be much higher, as a consequence of uneven numbers within the cells and the fact that the number of mitochondria may be influenced by the training status, fitness level, and type of exercise [16].
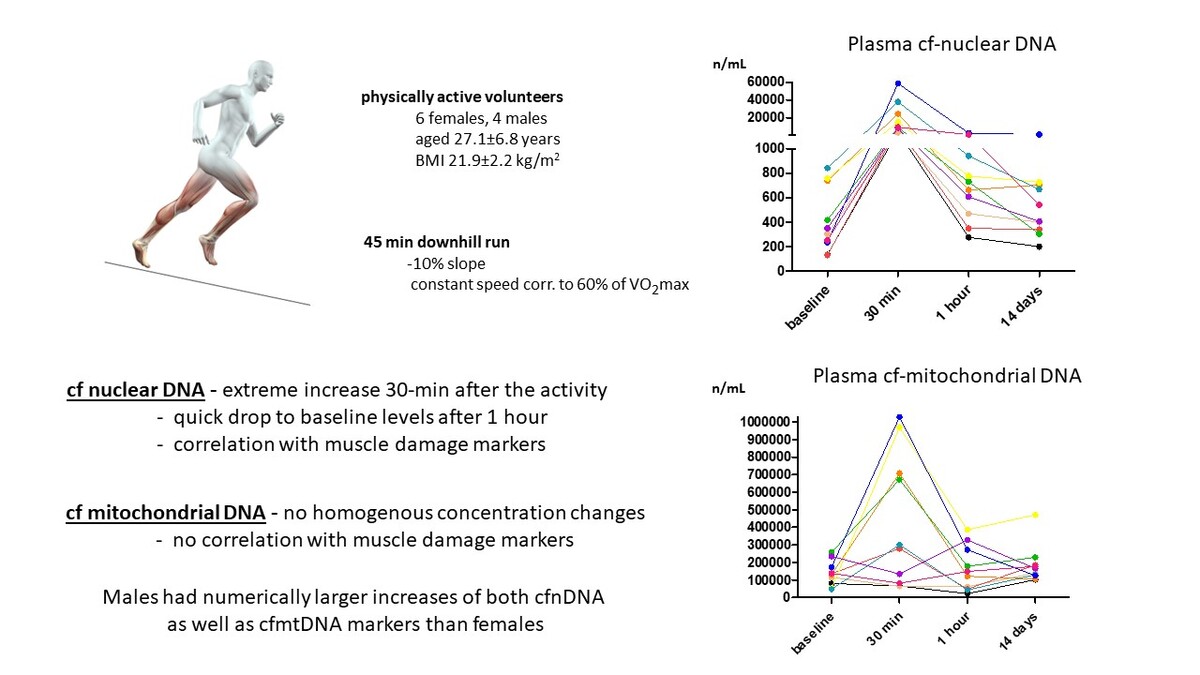
As the studies performed to date have focused mostly on cfDNA of nuclear origin, the aim of our study was to analyze the short-time dynamics of plasma cfDNA concentrations, both of nuclear and mitochondrial origin, in a group of physically active healthy subjects after acute strenuous physical activity.
Material and methods
Participants
The studied cohort comprised 10 healthy, physically active Caucasian volunteers (6 females, 4 males; non-smokers, aged 27.1 ±6.8 years, body mass index 21.9 ±2.2 kg/m2) who signed an informed consent form and completed a downhill running protocol. Samples of peripheral blood were collected at baseline, 30 min, 1 h, and 14 days after the exercise. Exclusion criteria were diagnosis of any serious disease, history of any musculoskeletal, rheumatic, or autoimmune disease, prescription of any regular medication, pre-/post-test activity limitations as described in detail previously [17], and finally, non-availability of all four plasma samples in sufficient quality (based on the test for hemolysis).
Downhill running protocol
The complete downhill running protocol was described in our previous study [17]. Briefly, all participants underwent two exercise stress tests separated by seven days using a motor-driven treadmill (Valiant Plus (P/N 932902) with Rear Elevation –10% mechanical, Valiant, Lode, Netherlands): (i) a maximal incremental test without inclination (slope 0%) to estimate the aerobic capacity and target exercise intensity for the second test; (ii) the intervention itself, i.e. downhill run at a constant speed corresponding to the intensity of 60% of maximal oxygen consumption (VO2max), with a negative slope (–10%) for 45 min. Further details were described previously [17].
Preparation of peripheral blood samples
Peripheral blood samples were collected into EDTA-treated tubes for plasma preparation and BD Vacutainer SST II Advance tubes for serum collection. Baseline samples and those obtained 14 days after intervention were centrifuged within 30 min of collection. Samples collected at 30 min and 1 h after intervention were transported on ice (4–8°C) and were centrifuged within 1 h. All samples were centrifuged at 3,500 rpm for 10 min at 10°C. Separated serum and plasma samples were aliquoted and stored at –80°C until further analysis.
Analysis of serum markers of muscle damage and inflammation
Serum levels of traditional markers of inflammation (C-reactive protein (CRP)), and muscle damage (aspartate aminotransferase (AST), alanine aminotransferase (ALT), creatine kinase (CK), lactate dehydrogenase (LD), and myoglobin (Mgb)) were analyzed using a Beckman Coulter AU680 analyzer (Beckman Coulter, USA), as described elsewhere [18].
Serum levels of the following inflammatory cytokines/chemokines were measured by a commercially available Bio-Plex Pro human Cytokine 27-plex Assay (BIO-RAD, Hercules, CA, USA): interleukin (IL)-1β, IL-1Ra, IL-2, IL-4, IL-5, IL-6, IL-7, IL-8, IL-9, IL-10, IL-12 (p70), IL-13, IL-15, IL-17A, eotaxin, fibro-blast growth factor (FGF) basic, granulocyte colony-stimulating factor (G-CSF), granulocyte-macrophage colony-stimulating factor (GM-CSF), interferon-γ (IFN-γ), CXCL10, monocyte chemoattractant protein (MCP-1 alias CCL2), interferon gamma-induced protein 10 (IP-10 alias CXCL10), macrophage inflammatory protein (MIP-1α alias CCL3), MIP-1β (also known as CCL4), platelet-derived growth factor (PDGF)-BB, regulated on activation/normal T cell expressed and secreted (RANTES alias CCL5), tumor necrosis factor (TNF), and vascular endothelial growth factor (VEGF). The absorbance of the Bio-Plex Pro human Cytokine 27-plex Assay was evaluated using a Luminex BIO-PLEX 200 System (Bio-Rad, Hercules, CA, USA) [18].
DNA analyses
Cf-DNA was extracted from plasma with a Plasma/Serum Cell-Free Circulating DNA Purification Mini Kit (Norgen Biotek, Canada) according to the manufacturer’s instructions. The plasma volume of 1000–1500 µl was processed, and the elution volume was 45 µl.
Two assays specific to human genomic DNA were used. Amplicon sizes were 129 bp (gene ID 79068, referred to as G1; oligo sequences 5′ -GAGGAGGAGATTGTGTAACTGGA-3′ and 5′-ATCTATTAAAGGAGCTGGACTGTT-3′) and 136 bp (gene ID 3569, referred to as G2; oligo sequences 5′-AGTAAAGGAAGAGTGGTTCTGCT-3′ and 5′-TGGGGCT-GATTGGAAACCTTATT-3′), respectively.
Two assays specific to human mitochondrial DNA were used. Amplicon sizes were 93 bp (gene ID 4540, referred to as G3; oligo sequences 5-ACCGCTA-ACAACCTATTCCAAC-3′ and 5′-ATCTGCTCGGGCGTATCATC-3′) and 132 bp (gene ID 4514, referred to as G4; oligo sequences 5′-CAGGCTTCCACGGACTTCAC-3′ and 5′-CAAAATGCCAGTATCAGGCGG-3′).
The qPCR was performed in duplicates using the TATAA SYBR GrandMaster Mix (TATAA Biocenter, Sweden). The total volume of the reaction was 10 µl, the final concentration of the primers was 400 nM, and the template volume in one reaction was 2 µl. The qPCR was performed applying the CFX Connect Real-Time PCR Detection System (Bio-Rad, Hercules, California, USA) under the following conditions: pre-denaturation: 95°C for 30 s; amplification: 45 cycles at 95°C/5 s followed by 60°C/30 s and 72°C/10 s for cfnDNA and 95°C/30 s; amplification: 35 cycles at 95°C/5 s followed by 60°C/30 s and 72°C/10 s for cfmtDNA.
All assays were validated according to the MIQE guidelines and MIQE assay disclosure. The standard curves and resulting slopes were used for calculations. The efficiency reached was 100.8% for G1, 100% for G2; 99.8% for G3, and finally 100% for G4.
Statistical analysis
Statistical analysis was performed using Statistica 12 (StatSoft, Tulsa, USA). The descriptive statistics are presented as mean ± standard deviation (SD) or median (interquartile range). The graphs were created by GraphPad Prism 5 (version 5.02; GraphPad Software, La Jolla, CA, USA). Differences between female and male participants were assessed by the Mann-Whitney U test. Repeated measurements were assessed by the Friedman test followed by post-hoc Dunn’s test. The relationships between two continuous variables were evaluated by Pearson’s correlation coefficient (univariate analysis). P-values less than 0.05 were considered statistically significant.
Given the modest sample size of only 10 participants used in the multiple regression models presented in Table I, there are inherent risks of overfitting. To mitigate these risks, several measures were taken. Firstly, the number of predictors was deliberately limited to essential variables supported by theoretical underpinnings and preliminary analyses. Secondly, we conducted thorough assessments of collinearity among predictors using correlation coefficients to ensure that multicollinearity did not unduly influence the regression estimates.
Table I
Multivariate regression analysis models – significant associations of cfDNA concentrations and selected biochemical, anthropometric, and functional parameters
Results
Intra-correlations between cfDNA markers
There was a strong positive correlation between the baseline levels of both cfnDNA markers (r = 0.980, p < 0.0001), as well as between their increase at 30 min after the end of the downhill run compared to baseline (r = 0.998, p < 0.0001).
Similarly, there was a strong positive correlation between the baseline concentrations of cfmtDNA G3 and G4 (r = 0.888, p < 0.001), and between their change at 30 min after the exercise compared to baseline (r = 0.945, p < 0.0001).
Importantly, there was no significant correlation between the baseline levels of cfnDNA markers (G1 and G2) and cfmtDNA markers (G3 and G4) (p > 0.05 for all four comparisons), suggesting the independence of nuclear and mitochondrial markers.
Changes in cfDNA concentrations
The concentrations of cfnDNA markers uniformly and significantly increased at 30 min after the exercise compared to baseline (43-fold for G1 and 34-fold for G2). At 1 h and 14 days after the end of the downhill run, values were comparable to baseline (Figures 1 A, B).
Figure 1
Gene expression levels of cfnDNA G1 (A), cfnDNA G2 (B), cfmtDNA G3 (C), and cfmtDNA G4 (D) before and after the downhill run
P* – overall change assessed by the Friedman test; p – statistically significant change between selected time-points assessed by the post hoc Dunn’s test (time points on axis x are not in a scale); mean and standard deviation (SD) of concentrations for G3 and G4 are rounded to hundreds.
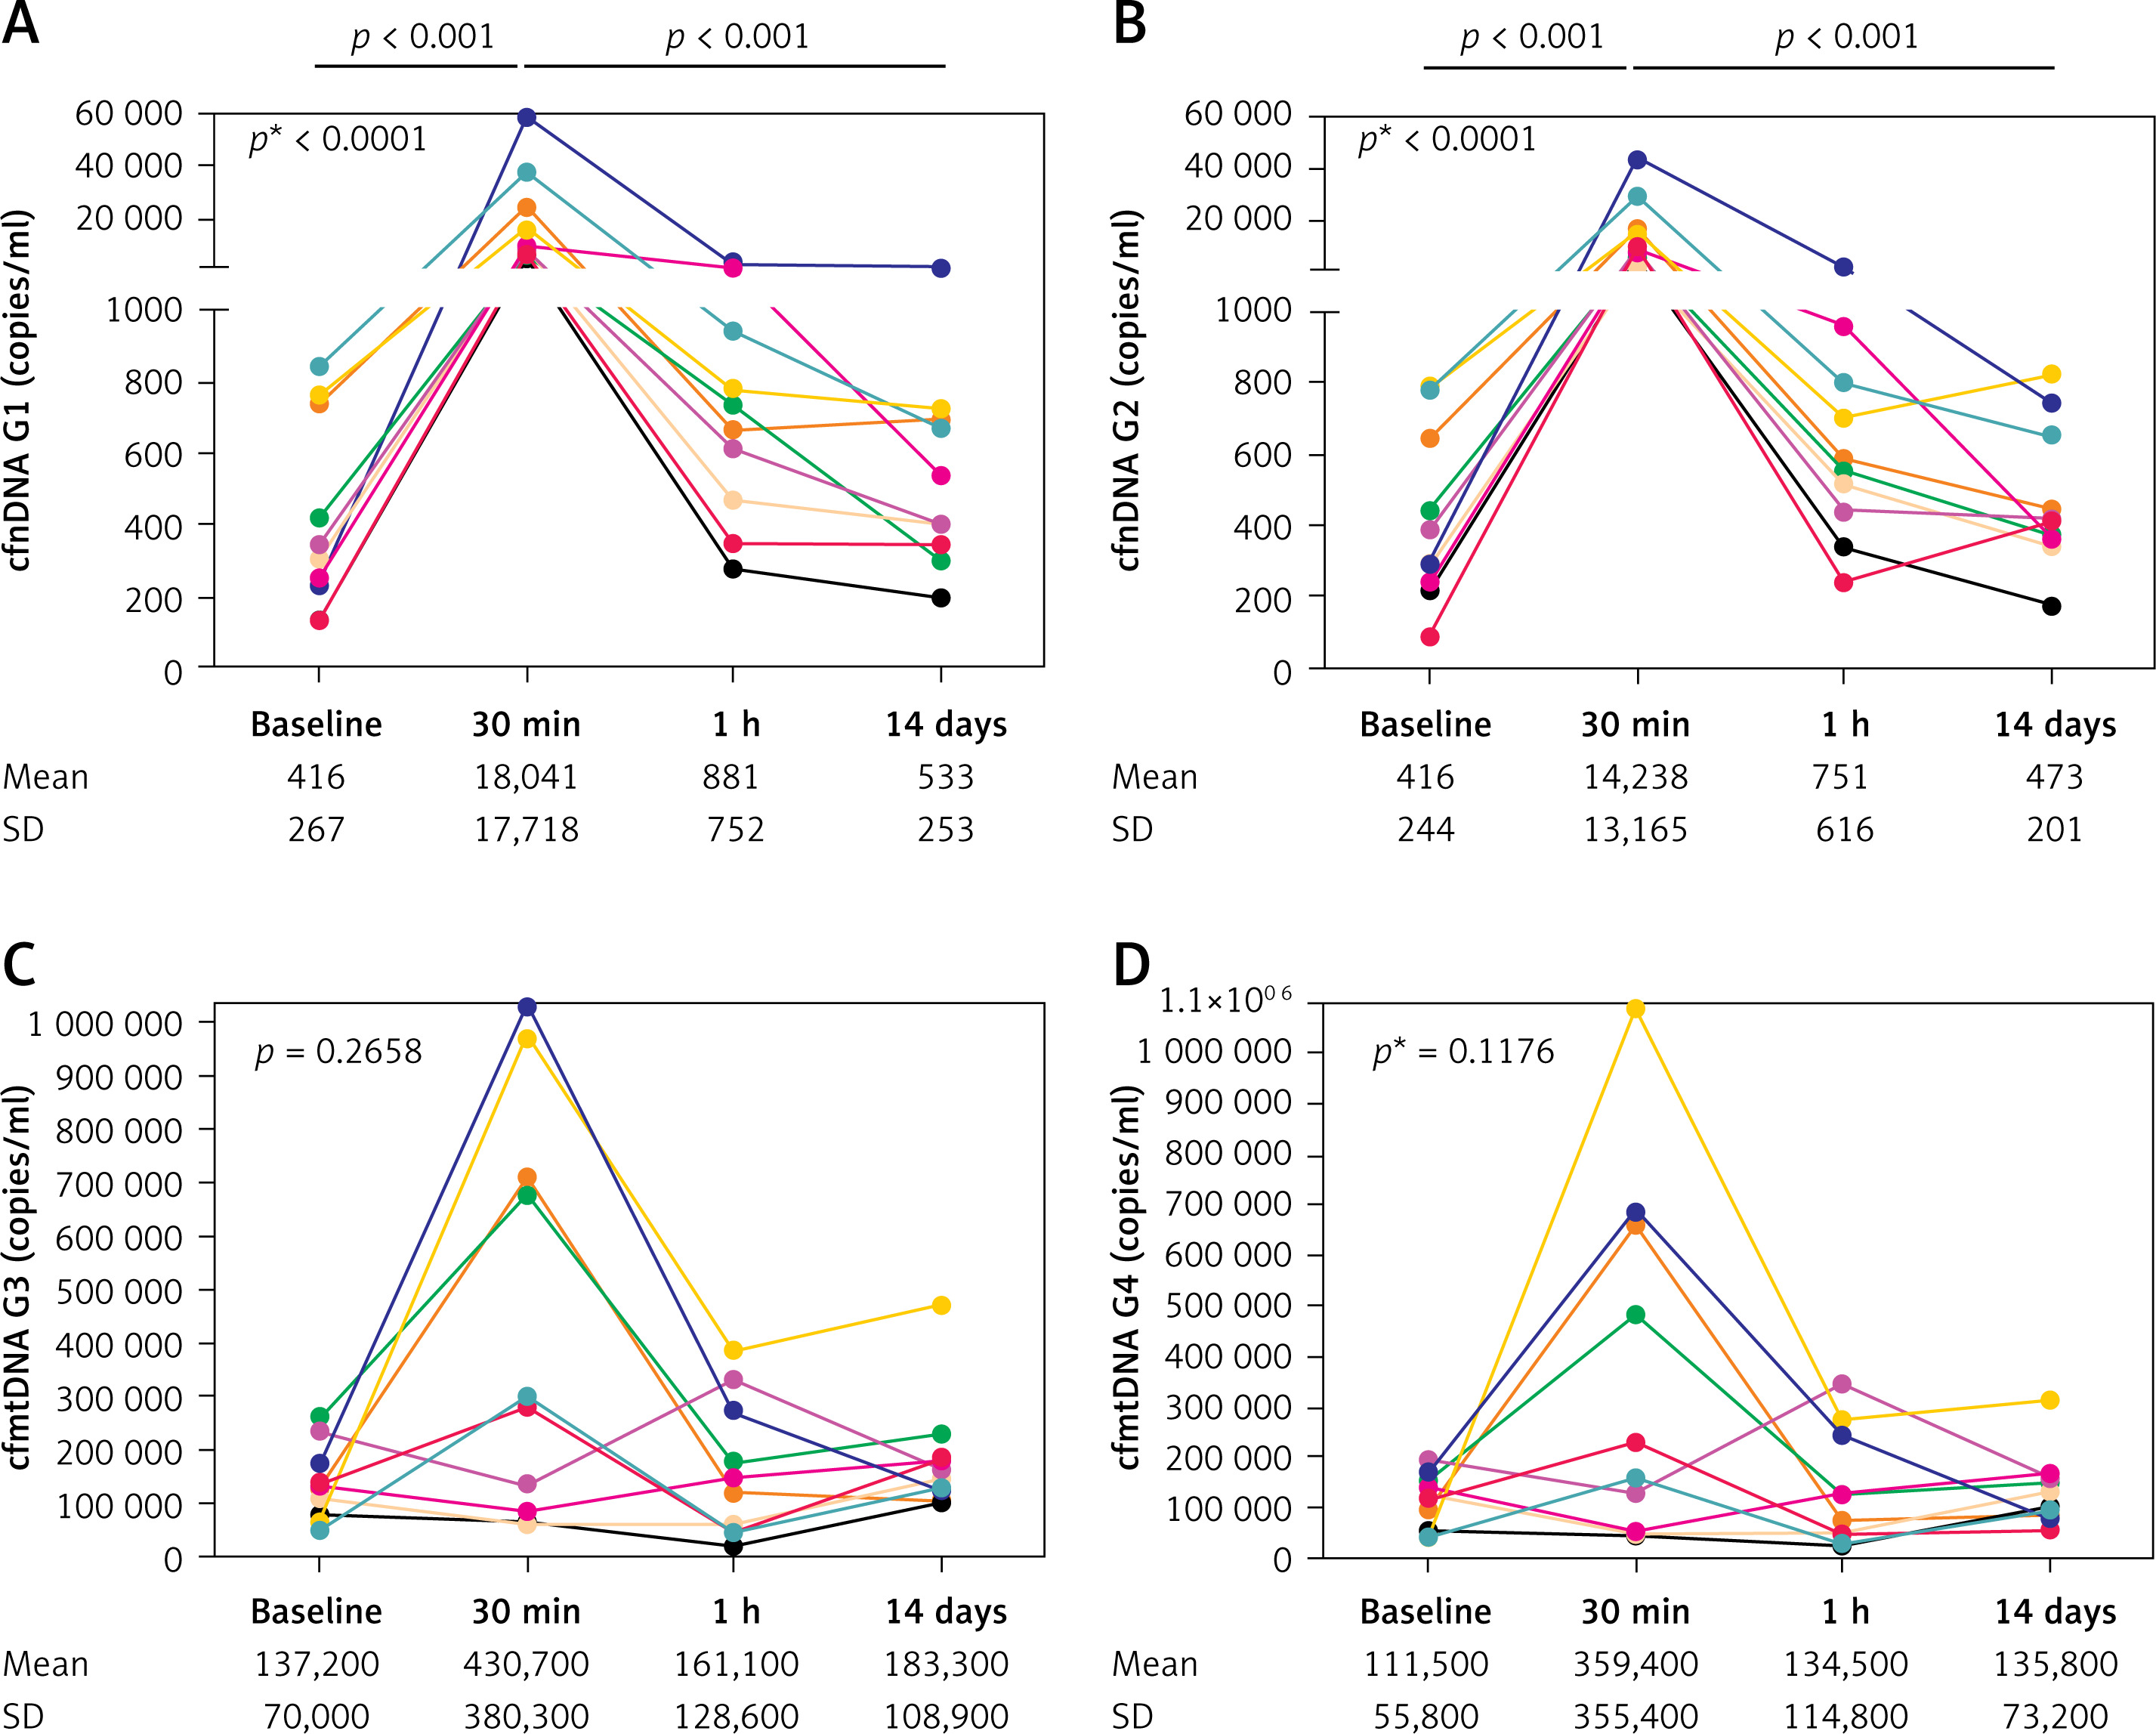
Surprisingly, the analysis of both cfmtDNA markers (G3 and G4) revealed an increase in 6 and a decrease in 4 participants at 30 min after the end of the downhill run compared to baseline (a mean 3-fold increase for both) with a decrease to concentrations comparable to baseline at 1 h and 14 days after the exercise (Figures 1 C, D).
Of note, when comparing absolute concentration changes in males (n = 4) and females (n = 6), males showed larger increases at 30 min from baseline for both cfnDNA (1.5- and 1.4-fold higher, respectively), as well as for cfmtDNA markers (3.3- and 5.0-fold higher, respectively).
Correlations of cfDNA with markers of muscle damage
When analyzing the dynamics of serum markers of muscle damage, we observed a significant change in LD (p < 0.001) and myoglobin (p < 0.001) (Table I), with a significant increase 30 min and 1 h after the exercise and a return to baseline levels at 14 days after the downhill run. With one exception (CK at 30 min compared to baseline; p < 0.05), we did not detect any significant overall changes in the levels of the remaining serum markers of muscle damage (Table II). Similarly, we did not detect any significant overall changes in serum markers of inflammation such as CRP or any of the inflammatory chemokines/cytokines with measurable levels in at least 7/10 participants (Table II).
Table II
Systemic levels of markers of muscle damage, CRP, and selected cytokines/chemokines before and after the downhill run
| Parameter | Baseline | 30 min | 1 h | 14 days | p12; p13; p14; p24; p34; p* |
|---|---|---|---|---|---|
| AST [µkat/l] | 0.38 (0.31–0.41) | 0.39 (0.34–0.45) | 0.38 (0.32–0.45) | 0.36 (0.33–0.37) | all n.s. |
| ALT [µkat/l] | 0.35 (0.29–0.50) | 0.34 (0.25–0.52) | 0.38 (0.20–0.49) | 0.34 (0.23–0.44) | all n.s. |
| CK [µkat/l] | 1.93 (1.36–3.44) | 2.60 (1.49–3.28) | 2.52 (1.72–4.05) | 2.20 (1.60–2.74) | 0.37; 0.02; 0.86; 0.79; 0.29; 0.25 |
| LD [µkat/l] | 2.76 (2.33–3.22) | 3.64 (2.83–4.25) | 3.44 (2.71–3.93) | 2.65 (2.50–3.01) | 0.003; 0.007; 0.56; 0.002; 0.020; 0.001 |
| Myoglobin [µg/l] | 50.5 (41.7–58.2) | 162 (136–202) | 260 (195–367) | 48.2 (42.0–57.5) | 0.001; 0.001; 0.52; 0.001; 0.001; 0.001 |
| CRP [mg/l] | 0.44 (0.23–1.32) | 0.45 (0.18–0.98) | 0.47 (0.17–0.81) | 0.47 (0.24–0.70) | All n.s. |
| IL-9 [pg/ml] | 78.6 (52.1–103.0) | 84.0 (73.4–102.7) | 81.5 (64.6–99.3) | 91.3 (66.2–109.8) | All n.s. |
| MIP-1α [pg/ml]† | 1.02 (1.02–1.79) | 1.49 (1.02–1.89) | 1.02 (0.36–1.65) | 1.02 (1.02–1.37) | All n.s. |
| MIP-1β [pg/ml] | 163 (108–210) | 175 (137–213) | 173 (110–207) | 183 (126–227) | All n.s. |
| MCP-1 [pg/ml]† | 8.92 (4.39–15.75) | 11.00 (9.55–17.30) | 10.59 (8.71–14.72) | 9.34 (5.28–11.95) | All n.s. |
| RANTES [ng/ml] | 3.79 (2.07–8.00) | 4.36 (2.97–5.90) | 4.25 (2.96–5.27) | 4.56 (3.32–8.90) | All n.s. |
| TNF [pg/ml]† | 26.3 (21.2–30.1) | 33.9 (26.3–37.5) | 26.3 (23.8–35.1) | 36.3 (27.6–42.4) | All n.s. |
| Eotaxin [pg/ml] | 39.9 (25.7–53.2) | 44.1 (29.9–49.4) | 35.3 (28.5–43.2) | 36.1 (25.7–49.0) | All n.s. |
| IP-10 [pg/ml] | 331 (244–384) | 250 (192–391) | 252 (172–378) | 331 (236–412) | All n.s. |
| PDGF [pg/ml]† | 189 (85–316) | 1,563 (878–2,111) | 362 (143–740) | 223 (177–327) | 0.97; 0.41; 0.37; 0.04; 0.72; 0.41 |
Data are presented as median (interquartile range). Statistically significant differences (p < 0.05) are marked in bold: p12, baseline vs. 30 min; p13, baseline vs. 1 h; p14, baseline vs. 14 days; p24, 30 min vs. 14 days; p34, 1 h vs. 14 days; p*, Friedman test; n.s. – not significant;
† data available only for 9 (MCP-1, TNF), 8 (MIP-1 α) and 7 (PDGF) participants. AST – aspartate aminotransferase, ALT – alanine aminotransferase, CK – creatine kinase, LD – lactate dehydrogenase, CRP – C reactive protein, IL – interleukin, MIP – macrophage inflammatory protein, MCP – monocyte chemoattractant protein, RANTES – regulated on activation, normal T-cell expressed and secreted protein, TNF – tumor necrosis factor, IP-10 – interferon gamma-induced protein 10, PDGF – platelet derived growth factor.
Univariate analysis of potential relationships between the change (30 min – baseline) in cfnDNA concentrations and biomarkers of muscle damage and inflammation, and selected anthropometric and functional parameters revealed significant positive correlations of both cfnDNA markers with AST, ALT, LD (Table III), MIP-1α, and IP-10 (Table IV) and a negative correlation with the difference between the speed of running at the start and end of the downhill run (Vbaseline – Vend) (Table V). Univariate analysis of potential relationships between the change (30 min – baseline) in levels of cfmtDNAs demonstrated a significant positive correlation with MCP-1 and PDGF (Table III) as well as with BMI (Table V).
Table III
Univariate relationships of the change in cfDNA concentrations with the change in serum biomarkers of muscle damage (30 min after the end of the downhill run vs. baseline)
[i] Statistically significant (Pearson’s correlation coefficient) differences (p < 0.05) are highlighted in bold. Effect size for Pearson’s correlation coefficient (r): absolute value of r (effect size) 0.0–0.1 (negligible), 0.1–0.3 (small), 0.3–0.5 (moderate), 0.5–1.0 (strong). AST – aspartate aminotransferase, ALT – alanine aminotransferase, CK – creatine kinase, LD – lactate dehydrogenase, Mgb – myoglobin.
Table IV
Univariate relationships of the change in cfDNA concentrations with the change in selected serum biomarkers of inflammation (30 min after the end of the downhill run vs. baseline; evaluated by Pearson’s correlation coefficient)
[i] Statistically significant differences (p < 0.05) are highlighted in bold. Effect size for Pearson’s correlation coefficient (r): absolute value of r (effect size) 0.0–0.1 (negligible), 0.1–0.3 (small), 0.3–0.5 (moderate), 0.5–1.0 (strong). CRP – C reactive protein, IL – interleukin, MIP – macrophage inflammatory protein, MCP – monocyte chemoattractant protein, RANTES – regulated on activation, normal T-cell expressed and secreted protein, TNF – tumor necrosis factor, IP-10 – interferon gamma-induced protein 10, PDGF – platelet derived growth factor
Table V
Univariate relationships of cfDNA concentrations with selected anthropometric and functional parameters evaluated by Pearson’s correlation coefficient
[i] Statistically significant differences (p < 0.05) are highlighted in bold. Effect size for Pearson’s correlation coefficient (r): absolute value of r (effect size) 0.0–0.1 (negligible), 0.1–0.3 (small), 0.3–0.5 (moderate), 0.5–1.0 (strong). BMI – body mass index, V – speed of running, HR – heart rate, VO2 – oxygen consumption/uptake/maximal aerobic capacity, SDS – standard deviation score.
Lastly, parameters from univariate analyses with p < 0.25 were included in a multivariate logistic regression analysis, which yielded four final models identifying significant predictors of changes in plasma concentrations of the cfDNA at 30 min after the end of the downhill run compared to baseline. This analysis revealed that the strongest predictors of the concentration increase in cfnDNA G1 and G2 were the increase in the speed of running (Vbaseline – Vend), male sex and the increase in LD and CRP levels. A larger increase in CRP levels and higher BMI were the strongest predictors of the concentration increase in both cfmtDNA markers (G3 and G4). In addition, larger increases in LD levels and higher age were also significantly associated with the increase of the cfmtDNA G3 concentration (Table I).
Discussion
We highlighted differences in the changes of plasma concentrations of nuclear and mitochondrial cfDNA concentrations in young physically active Caucasian subjects. Concentrations of cfnDNA increased dramatically after intensive physical activity, and the pattern of change of concentrations was extremely uniform among individuals. In contrast, fluctuation of cfmtDNA was far less dramatic and was observed in only about 60% of subjects; other subjects did not show a significant increase in the concentrations of cfmtDNA. As expected, the amount of detected cfmtDNA was 100–1000-fold higher than concentrations of cfnDNA.
In general, massively increased plasma levels of cfDNA have been described after both intensive and endurance activity, and independently of whether aerobic or anaerobic activity was applied [19–21]. The increase is very quick, as is the decline to the baseline after the end of the exercise. It is worth mentioning that in professional sportsmen, levels of plasma cfDNA remain slightly elevated over baseline for a longer time after the activity [6, 7]. In professional football players, cfnDNA increased dramatically after a season game (approximately 23-fold) [6] and remained significantly (albeit only ~1.5-fold) elevated 1 day after the game [7]. CfnDNA also correlates with training. In identical subjects, sprint training sessions led to higher cfDNA concentrations in the case of long (5 min) in comparison with short (1 min) pauses. Out of all biomarkers analyzed (e.g., IL-6, CRP, or CK), only concentrations of cfnDNA correlate with the distance covered during the game.
Interestingly, it cannot be excluded that the massive peak of the cfnDNA after exercise is possibly detectable in trained subjects only. For example, untrained but physically active male controls reveal a gradual decrease in plasma cfnDNA (the highest concentration was detected before the exercise) [22] after maximal aerobic and anaerobic tests, in contrast to professional athletes. On the other hand, it was reported that cfnDNA increase was inversely related to individual training levels [23].
It is possible that trained subjects developed some kind of adaptation, which makes the organism capable of more efficient cfnDNA excretion, whose role in detail remains unknown.
Sugasawa et al. [8] performed a next-generation sequencing analysis of plasma cfnDNA in marathon runners and reported that not all DNA fragments increase the concentrations uniformly. The extreme marker originating from chromosome 1 occurs in 16,000-fold abundance compared to markers from other genomic regions. The cfDNA fragments identified seem to be highly sensitive markers of extreme physical stress.
It has also been reported (for a review, see ref. 4) that cfnDNA correlates with other metabolic markers of muscle damage. Our findings further support this, as we detected a strong correlation of both cfnDNA markers with lactate dehydrogenase but not with creatine kinase, which has been correlated with cfnDNA in some [24] but not all [5, 25] previous studies. Although no significant change was detected in AST or ALT at the group level, slight changes at the individual level were associated with robust uniform changes in cfnDNA markers. Additionally, two serum biomarkers of inflammation (MIP-1α and IP-10) were also consistently associated with plasma cfnDNA markers in our study.
A different pattern was observed in the case of cfmtDNA markers. There was no association with any markers of muscle damage. A slight correlation was, however, found between cfmtDNA concentrations and CRP, MCP-1, and PDGF. Notably, these markers do not overlap with inflammatory markers associated with cfnDNA.
Nonetheless, it can be concluded that post-exercise development of plasma concentrations of cfnDNA is generally uniform, with a large increase after exercise and a quick decrease afterward, although some exceptions exist and some unclarities remain to be elucidated. The observed robust increase in cfnDNA markers might lack specificity due to several potential cellular sources of release upon various forms of stress or pathological conditions, but might provide a much higher sensitivity to even milder involvement of skeletal muscles, as evidenced by a 40-fold increase in cfnDNA markers compared to a 35% increase in CK, 32% in LD, and 220% in myoglobin levels in our study.
Post-exercise development of plasma cfmtDNA seems to be an independent model. In a majority of our subjects, cfmtDNA increases 30 min after the downhill run, but not to such an extent as cfnDNA. It is a rather surprising finding, as the number of mitochondria per cell is usually several hundred, and the potential for release of the mtDNA seems to be much higher than in the case of nDNA. A possible explanation may relate to the fact that nDNA release (as a response to the physical performance) is an active and highly regulated process, whereas mtDNA release is based on catabolic processes, and circulating cfmtDNA reflects passive leakage from broken mitochondria [26]. Moreover, post-hoc power analysis confirmed that our study was underpowered to detect statistically significant changes in G3 and G4.
In an animal model [27], it was found that mitochondrial membrane permeability significantly increased after downhill running, reaching a peak 12 h after exercise. The simultaneous relatively slow increase of the DNA oxidative damage marker observed in this study supports the idea, that also skeletal muscles are negatively affected.
Moreover, the number of mitochondria is not identical in different types of cells [28]. Their number is highly variable also over time, and some variability has been described even in cells from identical tissues [29, 30]. Furthermore, the number of mitochondria increases in response to training [16, 31], or with the age of the subject [32]. This variability might be reflected in the variability of the plasma concentration of the cfmtDNA, and might support our findings of age and BMI being important predictors of variability in cfmtDNA.
To the best of our knowledge, there are only a few studies focused on post-exercise cfnDNA as well as on cfmtDNA simultaneously, with conflicting results. Similarly to our study, males after short-term treadmill exercise did not show increased cfmtDNA immediately after the exercise [33]. Healthy volunteers showed a slight but steady increase of plasma cfmtDNA until 90 min after the controlled ergo-spirometry cycle test [34] as well as after incremental treadmill exercise [35]. A slight increase of cfmtDNA has been observed in moderately trained young men immediately after treadmill exercise [36].
Our study has several limitations. The first is the small sample size of only 10 participants. This sample size increases the risk of not detecting a true effect when it does exist, known as a false negative. Additionally, the limited number of participants may compromise the generalizability of the findings to a broader population, as it may not accurately represent the characteristics or behaviors of a larger group. Secondly, future studies should also include other forms of exercise, a control physically inactive group, and additional sampling time points to better elucidate the relationship between cfDNA and inflammatory markers, thereby supporting the generalizability of our findings for clinical practice. Also, sex needs to be taken into account in future studies, as we observed potential differences (especially in cfmtDNA concentrations) between males and females.
Our downhill run protocol was designed to mimic real-life muscle strain/damage induced by acute submaximal eccentric exercise in physically active healthy volunteers; thus, our findings are not generalizable to other physical activities (such as resistance training or interval sprints). Our original cohort of 18 volunteers [17] was significantly reduced to 10 due to the non-availability of all four plasma samples in sufficient quality. Nevertheless, this limited number of participants provided homogeneous results with respect to an increase in concentrations of cfDNA markers 30 min after exercise and a quick decrease to normal levels afterwards, with the exception of cfmtDNA in 4 volunteers. The PCR detection error and the methodology of preselection of several multicollinear variables for our regression analysis models might have led to slightly different outcomes for the most significant predictors of variability of cfnDNA and cfmtDNA.
Despite the interest and high potential in defining and planning training loads, analysis of cfDNA is not widely used, as it has its pitfalls for several reasons. As cfDNA degrades rapidly, standardized pre-analytical and analytical requirements will need to be defined in the future. At the same time, however, it must be taken into account that the collection and subsequent processing of samples from athletes “in the field” is much more difficult than in clinical studies. Although “normal” values have been published and are generally accepted, they should be considered as estimates, as no epidemiological study of plasma cfDNA concentrations – either nuclear or mitochondrial – has been reported. Sport-related studies are often based on longitudinal data, in which data are collected at a multiple time points. It makes it possible to partially ignore the fact that comparison of cfDNA between subjects is challenging, mostly due to the high interindividual variability.
Notably, studies published to date are difficult to compare. Not only technical differences during sample treatment and DNA isolation and methods used for screening but also different types and durations of physical activity should not be overlooked. Thus, large, uniform future studies are warranted.