Introduction
Testicular cancer (TC) is the most common malignancy in men aged 14–44 years [1], and its incidence has been increasing for the last decades, particularly in industrialized countries [2]. However, the 5-year survival rates of patients with TC are over 80–90% [3]. Due to the age period and long-term survival of TC patients, evaluating the adverse effects of TC and its treatments on sexual function and quality of life is of great importance.
The prevalence of erectile dysfunction (ED) varies from 10% to 40% in patients with TC, according to different investigations [4–9]. However, most of the previous studies were conducted without comparison of groups. In addition, multiple tools were used to assess erection function in different studies, which made comparison of the results a great challenge. Moreover, a systematic review including 36 studies demonstrated that male erectile disorder occurred in 11.5% of TC survivors [10]. It was very difficult to determine whether the incidence of 11.5% differed from the normative data when there was no comparison group.
Most of the case-control studies showed that TC patients were at greater risk than healthy men for ED [4, 11–15]. On the other hand, some studies also indicated that the risk of ED in TC patients was not significantly different compared with healthy men [16–19]. Furthermore, the odds ratios (ORs) of ED in TC patients varied from 1.16 to 5.12 across different case-control studies [4, 12–18]. The wide range of reported ORs made it difficult to understand the empirical results. In order to obtain a more comprehensive result, we decided to conduct a meta-analysis on the existing data.
Material and methods
Search strategy
This meta-analysis was performed according to the guidance of the Preferred Reporting Items for Systematic Reviews and Meta-analyses (PRISMA) statement [20]. A systematic search was conducted to identify eligible studies from databases of PubMed, EMBASE, Scopus, and the Cochrane Library up to June 2019. The search terms were as follows: “erectile dysfunction”, “sexual dysfunction”, “impotence”, “testicular cancer” and “testicular tumor”. Moreover, the reference lists of relevant papers were also checked to identify additional studies.
Study selection
The criteria for study inclusion were as follows: (1) original studies in English language; (2) case-control studies that compared ED in TC patients with healthy men; (3) the incidence of ED was reported both in the TC group and a healthy control group, or could be calculated by the reported data. Conference presentations, reviews, letters, editorials, expert opinions, case reports, and duplications were excluded.
Data extraction and quality assessment
The study information was extracted independently by two authors (Jian Xiong and Zhonglin Cai), and included study author, country, publication year, age, sample size, criterion tool, follow-up duration, treatment, and incidence of ED in TC patients and healthy men. The quality of studies was assessed by the Newcastle-Ottawa Quality Assessment Scale (NOS) [21]. A study with an NOS score ≥ 7 was regarded as of high quality. Disagreements were resolved through discussion with the senior author (Hongjun Li).
Statistical analysis
In the meta-analysis, categorical outcome was reported as OR with 95% confidence interval (95% CI). Heterogeneity across studies was evaluated by the Cochran Q test with a significance level of p < 0.1. We also quantified the heterogeneity using the I 2 statistic, I 2 = 25%, 50%, and 75% corresponding to low, medium, and high levels of heterogeneity [22]. The pooled estimate was calculated using a random effect model if the heterogeneity was observed. Sensitivity analysis was conducted by the leave-one-out approach. In addition, a subgroup analysis was also performed based on follow-up time (≥ 5 years or < 5 years). Begg’s rank correlation test was used to assess possible publication bias. Data were analyzed using Stata software version 12.0 (StataCorp LP, College Station, Texas), and p-value less than 0.05 was considered statistically significant, except where otherwise specified.
Results
Literature search
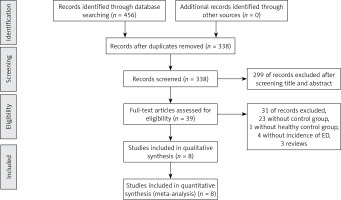
The database search yielded 456 articles; 45 full-text articles were reviewed after screening the title and abstract. 26 of them lacked a control group, and 6 were reviews. Unfortunately, among the remaining 13 case-control studies, 4 of them did not report the incidence of ED [11, 19, 23, 24], and another one had a control group of Hodgkin’s disease [25]. Finally, 8 studies were eligible for our inclusion criteria. The flow diagram for the selection process is presented in Figure 1.
Study characteristics
The characteristics of included studies are listed in Table I. All the included studies were case-control studies, conducted in Europe or America. Median (interquartile range) sample sizes were 128 (80–240) in the TC group and 172 (113–673) in the control group. Of the total 2060 TC patients, 16.9% (348/2060) suffered from ED, while the prevalence of ED was 9.4% (251/2651) in the healthy men. Age in the TC group and control group was 36 (31–44) and 39 (31–44) years, respectively. All the included studies were conducted in Europe or the USA, and the majority of the included patients and healthy men were Caucasian. The follow-up period was 8 (3–11) years. Most of the included studies evaluated ED using structured questionnaires designed for their own studies or derived from previous studies. Quality assessment showed an NOS score ≥ 7 for all studies, indicating the presence of high methodological quality. The treatment of TC patients is presented in Table II. All the patients with TC underwent orchiectomy. Chemotherapy, radiotherapy, and retroperitoneal lymph node dissection were also conducted if necessary. Risk bias of the included studies according to STROBE scores is listed in Table III. The range of STROBE scores was 16–21, indicating a low risk bias of the included studies.
Table I
Characteristics of the included studies
| Reference | Year | Country | Total sample | Mean age [years] | Race | Follow-up[years] | Criterion tools | ED in TC | ED in control | OR (95% CI) | NOS score |
|---|---|---|---|---|---|---|---|---|---|---|---|
| Schover, et al. [16] | 1985 | USA | TC 121 | Not reported | Not reported | 2.9 | Structured questionnaire | 12 (9.9%) | 3 (3.3%) | 3.27 (0.89–10.47) | 7 |
| Control 92 | |||||||||||
| Rieker, et al. [4] | 1988 | UK | TC 223 | 33 | Caucasian | 2 | Structured questionnaire | 22 (9.9%) | 4 (3.3%) | 3.17 (1.07–9.44) | 7 |
| Control 120 | 30.5 | ||||||||||
| Tinkler, et al. [12] | 1992 | UK | TC 134 | 44 | Caucasian | 8.2 | Structured questionnaire | 15 (11.2%) | 4 (3.3%) | 3.69 (1.19–11.4) | 7 |
| Control 121 | 44.3 | ||||||||||
| Joly, et al. [17] | 2002 | France | TC 67 | 47 | Not reported | 11 | Structured questionnaire | 17 (25.4%) | 16 (14.4%) | 2.02 (0.94–4.33) | 7 |
| Control 111 | 48 | ||||||||||
| Dahl, et al. [18] | 2007 | Norway | TC 1084 | 42.5 | Caucasian | 11.1 | BMSFI | 162 (14.9%) | 122 (13.1%) | 1.16 (0.90–1.50) | 8 |
| Control 929 | 42.7 | ||||||||||
| Eberhard, et al. [14] | 2009 | Sweden | TC 118 | 36 | Caucasian | 3 | Structured questionnaire | 14 (11.9%) | 21 (2.6%) | 5.12 (2.52–10.37) | 8 |
| Control 819 | 39 | ||||||||||
| Kim, et al. [15] | 2012 | USA | TC 246 | 29.3 | Caucasian(89.4%) | 13.70 | BMSFI | 89 (36.2%) | 59 (25.0%) | 1.70 (1.15–2.52) | 8 |
| Control 236 | 29.1 | Caucasian(94.1%) | |||||||||
| Pallotti, et al. [13] | 2019 | Italy | TC 67 | 31.3 | Caucasian | 4 | IIEF-EF | 17 (25.4%) | 22 (9.9%) | 2.39 (1.56–3.67) | 8 |
| Control 223 | 32 |
Table II
Treatments of patients with testicular cancer in the included studies
| Reference | TC sample | Treatment |
|---|---|---|
| Schover, et al. 1985, USA [16] | 121 | RPLND 47, RPLND + RT 8, RPLND + CT 38, RPLND + RT + CT 26, unknown 2 |
| Rieker, et al. 1988, UK [4] | 223 | CT 20, RPLND 38, RT 71, RPLND + CT 74, RT + CT 20 |
| Tinkler, et al. 1992, UK [12] | 134 | RT 134 |
| Joly, et al. 2002, France [17] | 67 | RT 32, CT 24, RT + CT 4, surveillance 7 |
| Dahl, et al. 2007, Norway [18] | 1084 | RPLND 140, RT 497, CT 243, RPLND + CT 100, surveillance 104 |
| Eberhard, et al. 2009, Sweden [14] | 129 | CT 62, RT 36, RPLND + CT 20, surveillance 11 |
| Kim, et al. 2012, USA [15] | 246 | CT 81, CT + RT 89, CT + RPLND 76 |
| Pallotti, et al. 2019, Italy [13] | 67 | CT 67 |
Table III
Risk bias of the included studies
| Reference | STROBE items | Total scores | |||||||||||||||||||||
|---|---|---|---|---|---|---|---|---|---|---|---|---|---|---|---|---|---|---|---|---|---|---|---|
| 1 | 2 | 3 | 4 | 5 | 6 | 7 | 8 | 9 | 10 | 11 | 12 | 13 | 14 | 15 | 16 | 17 | 18 | 19 | 20 | 21 | 22 | ||
| Schover, et al. [16] | Y | Y | Y | Y | Y | Y | Y | Y | N | Y | Y | Y | Y | Y | Y | N | Y | Y | N | Y | N | N | 17 |
| Rieker, et al. [4] | Y | Y | Y | Y | Y | Y | Y | Y | Y | Y | Y | N | Y | Y | Y | Y | N | Y | Y | Y | N | N | 18 |
| Tinkler, et al. [12] | Y | Y | Y | Y | Y | Y | Y | Y | Y | Y | Y | N | Y | Y | Y | N | N | Y | N | Y | N | N | 16 |
| Joly, et al. [17] | Y | Y | Y | Y | Y | Y | Y | Y | Y | Y | Y | Y | Y | Y | Y | N | N | Y | N | Y | N | N | 17 |
| Dahl, et al. [18] | Y | Y | Y | Y | Y | Y | Y | Y | N | Y | Y | N | Y | Y | Y | Y | Y | Y | Y | Y | Y | Y | 20 |
| Eberhard, et al. [14] | Y | Y | Y | Y | Y | Y | Y | Y | Y | Y | Y | N | Y | Y | Y | Y | Y | Y | N | Y | Y | N | 19 |
| Kim, et al. [15] | Y | Y | Y | Y | Y | Y | Y | Y | Y | Y | Y | N | Y | Y | Y | Y | Y | Y | Y | Y | N | Y | 20 |
| Pallotti, et al. [13] | Y | Y | Y | Y | Y | Y | Y | Y | N | Y | Y | Y | Y | Y | Y | N | N | Y | N | Y | Y | Y | 19 |
[i] STROBE, strengthening the reporting of observational studies in epidemiology; Y – yes; N – no; 1 – Title and abstract informative and balanced; 2 – Background/rationale stated in the introduction; 3 – Objective specified in the introduction; 4 – Study design correctly and presented early in the paper; 5 – Setting, locations, and relevant dates described; 6 – Give the eligibility criteria, and the sources and methods of case ascertainment and control selection; 7 – Diagnostic criteria, outcomes, exposures, predictors, potential confounders, and effect modifiers for all variables clearly defined; 8 – Sources of data and details of methods of measurement given for each variable of interest; 9 – Any efforts to address potential sources of bias described; 10 – How the study size was arrived at clearly explained; 11 – Describe all statistical methods, including those used to control for confounding; 12 – Explain how matching of cases and controls was addressed; 13 – Numbers of individuals of study reported; 14 – Characteristics of study, number of participants clearly described; 15 – Report numbers in each exposure category, or summary measures of exposure; 16 – Confounder-adjusted risk estimates and their 95% confidence interval reported; 17 – Analyses of subgroups and interactions reported; 18 – Summarize key results with reference to study objectives; 19 – Discuss limitations of the study; 20 – Give a cautious overall interpretation of results; 21 – Discuss the generalizability (external validity) of the study results; 22 – Source of funding and role of the funders described.
Risk of ED in patients with TC
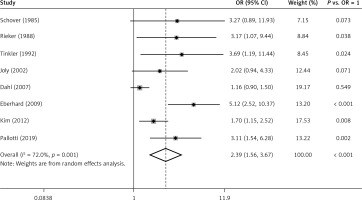
Figure 2 exhibits the results from a random effect model combining the ORs for ED. Among the 8 studies, only 5 of them showed a significantly positive relation between TC and the risk of ED. Moreover, the ORs for the association ranged from 1.16 to 5.12 across studies. Overall, patients with TC experienced a significantly increased risk (OR = 2.39, 95% CI: 1.56–3.67, p < 0.001 vs. OR = 1) for developing ED compared with healthy men. Substantial heterogeneity (p = 0.001, I 2 = 72.0%) was observed.
Subgroup analysis
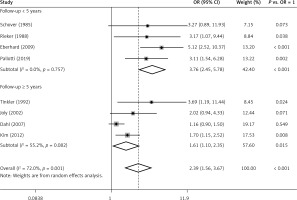
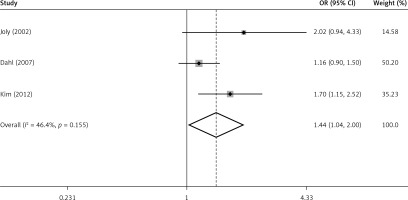
A subgroup analysis was performed according to follow-up time ≥ 5 years or < 5 years (Figure 3). Among 4 studies in the subgroup of follow-up < 5 years, 3 of them showed that risk of ED in TC patients was significantly higher than in healthy men. The ORs ranged from 3.11 to 5.12, with a pooled OR = 3.76 (95% CI: 2.45–5.78, p < 0.001 vs. OR = 1). No heterogeneity (p = 0.757, I2 = 0.0%) was observed. Among the 4 studies with follow-up ≥ 5 years, only 2 of them showed a significantly positive relation between TC and the risk of ED. The ORs varied from 1.16 to 3.69. However, the pooled OR (1.61, 95% CI: 1.10–2.35) was of statistical significance (p = 0.015, vs. OR = 1). Medium heterogeneity (p = 0.082, I2 = 55.2%) was still observed. After exclusion of 1 study [12] that only enrolled patients receiving radiotherapy which was different from the other 3 studies containing patients with different treatments, the overall risk (OR = 1.44, 95% CI: 1.04–2.00) decreased a little but was still significantly higher than OR = 1 (p = 0.039) (Figure 4). However, no evidence of heterogeneity was observed among the remaining 3 studies (p = 0.155, I2 = 46.4%).
Trial sequential analysis
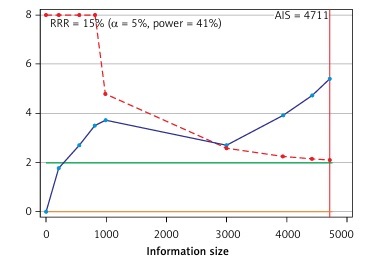
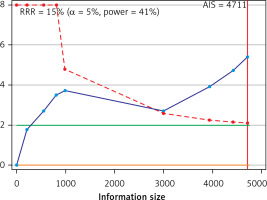
Trial sequential analysis results showed sufficient evidence that patients with TC experienced a significantly increased risk of ED compared with healthy men (Figure 5).
Sensitivity analysis and publication bias
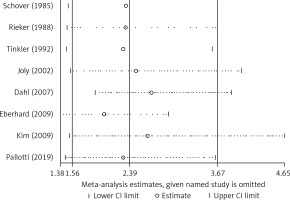
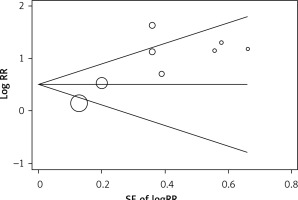
After exclusion of each study using the leave-one-out approach, the magnitude and direction of the pooled OR for ED did not change markedly, with a range from 2.02 (95% CI: 1.38–2.95) to 2.65 (95% CI: 1.51–4.65) (Figure 6), indicating good reliability of the meta-analysis. The Begg rank correlation test also indicated no evidence of publication bias among the included studies (p = 0.386) (Figure 7).
Discussion
This meta-analysis showed that the prevalence of ED in TC patients varied within a wide range across different studies. The risk of ED in TC patients was significantly elevated compared with healthy men. Moreover, the TC patients in the subgroup of follow-up < 5 years experienced an increased risk for ED compared with the subgroup of follow-up ≥ 5 years.
Nazareth et al. conducted a meta-analysis indicating that the pooled OR of ED in TC patients relative to the control group was 2.47 (1.54–3.96) in 2001 [26]. However, Nazareth’s meta-analysis included a study with a control group of Hodgkin’s disease patients but not healthy men. Moreover, no heterogeneity was reported and no sensitivity analysis was conducted in that study. Thus, the results should be regarded with great caution. In addition, a subgroup analysis was also conducted in our meta-analysis, showing that the short-term (< 5 years) risk of ED in TC patients was higher than the long-term risk (≥ 5 years), which might be explained by two reasons. First, the impaired erectile function of TC patients showed partial recovery as time went by. Second, as age increased, the prevalence of ED in healthy men rose, which might reduce the OR value between TC patients and healthy men.
In our included studies, the prevalence of ED varied from 9.9% to 36.2%. Nevertheless, we did not conduct a meta-analysis of the pooled prevalence of ED in TC patients due to the unacceptable heterogeneity (p < 0.001, I 2 = 89.8%), which made the result quite unreliable. A previous meta-analysis showed the pooled prevalence of ED in TC patients was 11.5% without an analysis of heterogeneity [10]. The heterogeneity of ED prevalence across studies might be generated from the different criterion tools used for the assessment of ED. However, the different criteria across studies would not cause so much heterogeneity to the OR values, because of the same criteria applied to both the cases and the controls in the same study.
Theoretically, etiology of ED in patients with TC may be organic and psychogenic. Organic etiology may be caused by radiotherapy-associated vascular injury and chemotherapy-associated neuropathy or Leydig cell dysfunction [9]. Psychogenic etiology may be associated with changes in body image, reduced feelings of well-being, loss of sense of manhood, and other psychosocial changes related to orchiectomy or cancer [27]. Thus, comprehensive treatment should be provided to TC patients with ED.
In TC patients, psychogenic ED was often underestimated by clinicians. Diagnosis of TC is a threat for sexual activity and productivity in the period when sexuality is still very important, so depression is a normal reaction after diagnosis of TC. Alacacioglu et al. examined the effects of depression in TC patients, and found that erectile function was significantly affected by depression [19]. In addition, as testicles are associated with masculinity, body perception might be changed after orchiectomy. Rossen et al. reported that 17% of TC patients had a reduced perception of masculinity, associated with a 9-fold risk of ED [27]. Moreover, TC patients experienced a significantly higher degree of negative body image and anxiety symptoms after orchiectomy, which was associated with ED [28]. Tinkler et al. reported that about 24% of the TC patients felt disfigured or disabled due to being aware of having only one testicle, which may be correctable by testicular implants [12]. Thus, testicular implants might be helpful for the psychogenic ED in TC patients.
The heterogeneity of this meta-analysis got much better after the subgroup analysis. However, some heterogeneity (p = 0.082, I 2 = 55.2%) still existed in the subgroup of follow-up ≥ 5 years. We noticed that one (Tinkler’s) of the included studies only enrolled patients receiving radiotherapy [12]. A previous meta-analysis showed that TC patients following radiotherapy suffered from an increased incidence of ED compared with the other treatment modalities [29]. In our meta-analysis, we also observed that the risk of ED in Tinkler’s study was higher than the others of that subgroup. When Tinkler’s study was excluded, the heterogeneity (p = 0.155, I 2 = 46.4%) of that subgroup was improved. The vascular injury resulting from the adverse effects of radiotherapy might explain the high risk of ED in TC patients following radiotherapy. Further case-control studies are needed to explore the effect of different treatment modalities.
Several limitations should be considered in our study. First, the severity of ED was not described, because the data were unavailable in most of the studies. Second, we were unable to analyze the effect of individual treatment modalities, because few case-control studies concerned this issue. Third, subgroup analysis based on age was not performed due to insufficient data in the included studies. Finally, all the case-control studies were conducted in Europe or America; the results may not be extrapolated to patients in Asia or Africa.
In conclusion, this meta-analysis revealed that the patients with TC experienced an elevated risk for ED compared with healthy men. The long-term risk for ED in TC patients was lower than the short-term risk. The effect of different TC treatment modalities on ED needs to be described in future case-control studies.


