
Introduction
Sex steroid hormones and their receptors have been shown to determine cardiovascular gender differences [1]. While estrogen and its derivatives protect premenopausal women from atherosclerosis and cardiovascular disease, there is a steep increase in the risk for hypertension and coronary heart disease following menopause [2]. Estrogen receptors ERα and ERβ are nuclear receptors that transmit genomic estrogen signaling. However, several of the cardioprotective effects of estrogen have been attributed to non-genomic signaling pathways. Classic genomic signaling occurs by the regulation of gene transcription. In brief, hormone binding to the nuclear receptor, which in turn binds to co-regulators and interacts with a hormone response element (HRE), leads to an increase of gene transcription. Meanwhile, non-genomic signaling takes place at the plasma membrane, where nuclear receptors activate kinase pathways, which subsequently leads to downstream cellular events. Both pathways often converge or regulate each other [3]. The observation of non-genomic estrogen receptor signaling has fostered the theory of a membrane-bound version of the ER receptor that activates phosphatidylinositol 3-kinase (PI3K)/protein kinase B (Akt)–mitogen-activated protein kinase (MAPK) signaling via adaptor molecules, such as modulator of nongenomic actions of the estrogen receptor (MNAR) or caveolin-1 and caveolin-2 [4–6]. Moreover, rapid, non-genomic estrogen signaling has been attributed to the seven-transmembrane G protein-coupled receptor GPR30/GPER. GPR30 was first discovered in human endothelial cells and is expressed throughout the cardiovascular system in both women and men [7, 8]. The development of a selective GPR30 agonist, G-1, and a selective GPR30 antagonist, G-15, as well as the use of GPR30 knockout mice, have enabled extensive investigation of the implications of GPR30 in metabolic and cardiovascular health [9, 10].
Signaling through GPR30 involves the activation of the epidermal growth factor receptor (EGFR) and nonreceptor tyrosine kinases of the Src (Sarcoma Plymouth Rock chicken) family. Furthermore, activation of GPR30 triggers intracellular accumulation of cAMP, mobilization of calcium, and activation of PI3K [11, 12].
Meanwhile, an ever-growing body of evidence has shown that GPR30 can modulate vasodilation in various models [8, 13–16], lower arterial blood pressure [13–15, 17], reduce inflammation in the ischemia/reperfusion model [18], and promote glucose tolerance and insulin sensitivity [16, 17, 19, 20]. In the cited studies, vasodilation was induced by i.v., s.c., or ex vivo administration of G-1, arterial blood pressure was studied after G-1 administration or in GPR30-/- mice. In the model of ischemia and reperfusion, GPR30 was antagonized by G-15 and glucose tolerance was assessed in pharmacological and genetic experimental setups in mice and humans. One study has also shown that G-1 prevents atherogenesis in a feeding model of wild-type mice [21]. However, there is currently no study that coherently evaluates the metabolic, vasoactive, and anti-atherogenic properties of G-1 in the apolipoprotein E-deficient mouse model (ApoE-/-), which is a standard model for murine atherogenesis [22]. We therefore studied ROS production, vascular function, and atherosclerotic plaque burden in ApoE-/- mice, following a high-cholesterol diet and 7 weeks of G-1 treatment. Additionally, the impact of G-1 on ROS production and cell proliferation was evaluated in vitro in primary human coronary artery smooth muscle cells (HCASMC). We hypothesized that G-1 reduces arterial blood pressure, improves glucose tolerance, and reduces the atherosclerotic plaque burden of ApoE-/- mice.
Material and methods
ApoE-/- mice of both sexes with a C57BL/6 genetic background were used in the present study. Mice were purchased from Charles River Laboratories (Wilmington, USA).
Animals were maintained at a room temperature of 22°C and under a 12-hour dark–light-cycle. Animals had unrestricted access to drinking water and rodent chow. Treatment protocols were in accordance with institutional guidelines and German animal protection laws. All experiments were approved by the North Rhine Westphalian State Agency for Nature, Environment and Consumer Protection, which considered ethical and animal welfare aspects in its approval.
Female ApoE-/- mice were ovariectomized at the age of 8 weeks in order to exclude confounding effects from endogenous estrogen and to surgically induce menopause. Ovariectomy was performed as described previously [23]. Briefly, peritoneal access was gained via a dorsal midline incision. After a blunt dissection of the underlying connective tissue and fasciae, the ovaries were identified in the visceral adipose tissue and the uterine horns, and ovarian vessels were ligated. Subsequently, both ovaries were excised, and the wound was closed with a simple interrupted suture.
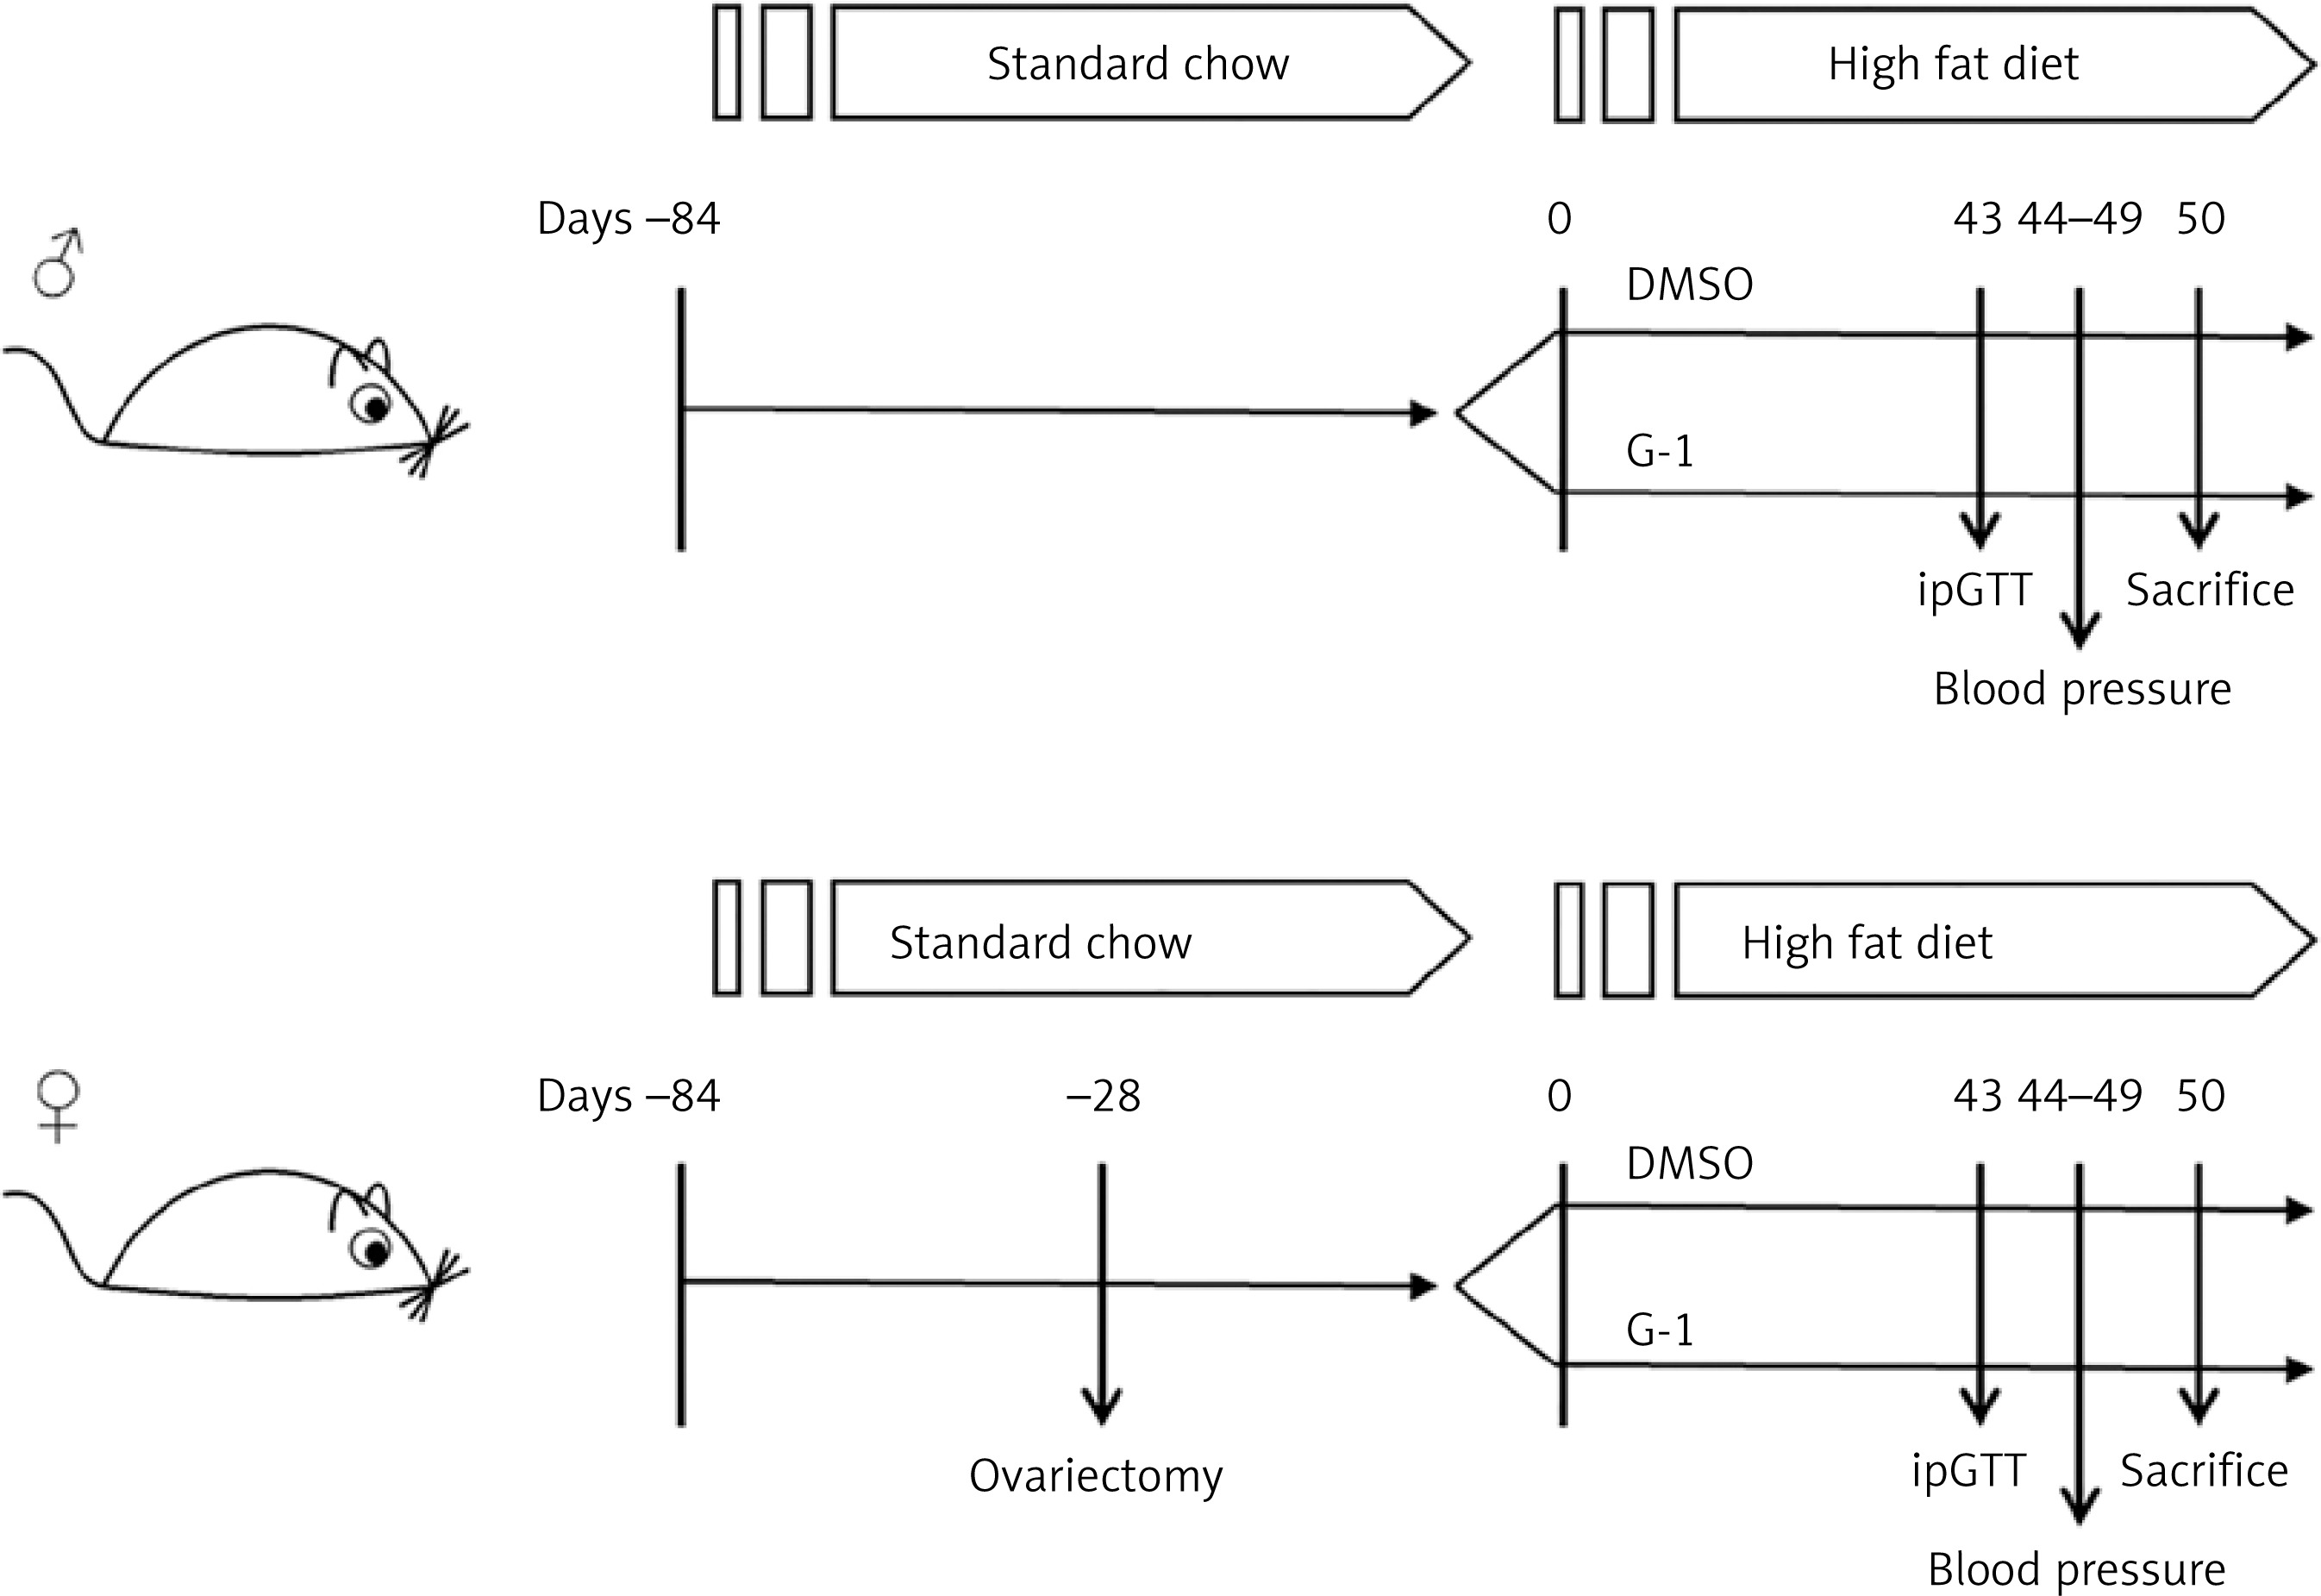
The effect of G-1 on male mice was studied in an independent cohort. At 12 weeks of age, female and male mice were fed a high-fat and high-cholesterol diet containing 21% (w/w) fat, 19.5% (w/w) casein, and 1.25% (w/w) cholesterol (Ssniff, Soest, Germany) for 7 weeks. Concomitantly, mice were subjected to s.c. injections of the selective GPR30 agonist G-1 (50 μg/kg body weight and a volume of 5 μl/g body weight) every other day in the treatment group (n = 6–7 of either sex) or to vehicle control (DMSO [0.5% (v/v)]) in the control group (n = 6–7 of either sex). At the end of the treatment period, G-1-treated mice were compared to the respective vehicle-treated controls. The experimental protocol is depicted in Figure 1.
Figure 1
Schematic of the experimental protocol. At the age of 8 weeks, female ApoE-/- mice were ovariectomized. After 12 weeks, female and male mice were fed a high-fat and high-cholesterol diet and treated with s.c. injections of either G-1 (50 μg/kg body weight) or vehicle (DMSO [0.5% (v/v)]). Fasting blood glucose levels and glucose tolerance were assessed at day 43, while blood pressure and heart rate were assessed between days 44 and 49. Mice were sacrificed at day 50 before endothelial function and reactive oxygen species formation were assessed ex vivo
Body weight, plasma cholesterol, blood pressure, and heart rate
Mice were weighed weekly using a Kern EW 3000-2M balance (Kern & Sohn GmbH, Balingen, Germany).
Blood was drawn from the inferior vena cava of the sacrificed mice using a heparinized syringe and a 26G needle. Plasma cholesterol levels were assessed by gas chromatography–flame ionization detection, as reported previously [24].
Blood pressure and heart rate were measured non-invasively using a tail cuff device (Coda 6, Kent Scientific Corporation, Torrington, USA), as described previously [25]. Mice were acclimated to the volume-pressure recording device for 3 consecutive days. Thereafter, blood pressure and heart rate were recorded on the 3 consecutive days that followed the habituation period. The mean values for these 3 days were calculated for each mouse.
Fasting blood glucose and intraperitoneal glucose tolerance test
Mice were starved overnight for 13 h, and fasting blood glucose levels were assessed on the next morning using a blood glucose meter (Accu-Chek, Roche Diagnostics Deutschland GmbH, Mannheim, Germany).
An intraperitoneal glucose tolerance test (ipGTT) was performed after 6 weeks of high-fat diet and G-1 versus vehicle treatment. Mice were challenged with an i.p. injection of 2 g/kg glucose. Blood glucose levels were measured at baseline and at time points 15, 30, 45, and 60 min after the injection.
Endothelium-dependent vasodilation
After 7 weeks of high-fat diet and G-1/vehicle treatment, mice were sacrificed by cervical dislocation under 5% (v/v) isoflurane anesthesia (Abbott Laboratories, Chicago, USA).
The descending thoracic aorta was carefully excised, and vascular contractility and endothelium-dependent vasodilation were measured. For this purpose, the vessel was transferred into 37°C warm Tyrode’s solution containing 118.0 mM NaCl, 2.5 mM CaCl2, 4.73 mM KCl, 1.2 mM MgCl2, 1.2 mM KH2PO4, 25.0 mM NaHCO3, 0.026 mM NaEDTA, 5.5 mM D(+)glucose, adjusted to pH 7.40. Then, the thoracic aorta was cut into 3 mm thick rings, which were carefully hooked to a myograph in an organ bath (IOA-5301, FMI GmbH, Seeheim, Germany). The organ bath was perfused with oxygenated Tyrode’s solution. 40 mM KCl was applied to elicit smooth muscle cell depolarization and subsequent vasoconstriction.
Next, KCl was washed out, and increasing concentrations of phenylephrine (to a maximum concentration of 100 μM) induced vasoconstriction. Endothelium-dependent vasodilation was then induced by increasing concentrations of carbachol (to a maximum concentration 100 μM). Endothelium-independent vasodilation was assessed as a procedural control and was induced by nitroglycerine (maximum concentration 10 μM).
Reactive oxygen species formation
Vascular production of reactive oxygen species was quantified by L-012 chemiluminescence in a scintillation counter (Lumat LB 9501, Berthold Technologies GmbH & Co. KG, Wildbad, Germany). L-012 stock solution (Wako Chemicals GmbH, Neuss, Germany) was diluted in PBS (1 : 100) and added to modified KH-HEPES buffer (1 : 10), containing 99.01 mM NaCl, 4.69 mM KCl, 1.87 mM CaCl2, 1.20 mM MgSO4, 20.0 mM NaHEPES, 1.03 mM K2HPO4, 25.0 mM NaHCO3, 11.1 mM D(+)glucose, adjusted to pH 7.40. Two 3 mm thick rings from the proximal and the distal end of the thoracic aorta were transferred into 200 μl of the L-012 working solution, and chemiluminescence was assessed over 10 min in 1-minute intervals. The scintillation count was normalized to the weight of the tissue sample. Five-minute scintillation counts were used for statistical analyses.
In vivo analysis of GPR30- and angiotensin II type 1 (AT1) receptor expression by qPCR
Expression of GPR30 and angiotensin II type 1 (AT1) receptors was analyzed by quantitative real-time PCR on lysed aortic tissue of mice from both sexes and treatment groups. Aortic tissue was harvested and lysed in 1 ml of Trizol reagent using a Schuett homogen plus tissue lyser (Schuett-biotec GmbH, Göttingen, Germany) as reported earlier [24]. Two hundred microliters of chloroform (Merck, Darmstadt, Germany) were added to each sample, and the phases were separated by centrifugation (18,000 × g; 4°C; 15 min). Two hundred microliters of isopropanol were then added to elicit RNA precipitation. The precipitated RNA was then washed with ethanol (75% (v/v)), dried, and resuspended in RNase-free water. RNA was reverse transcribed using the Omniscript RT kit (Qiagen GmbH, Hilden, Germany). qPCR analyses were performed using TaqMan probes (Thermo Fisher Scientific Inc.) and a 7500 Fast Real-Time PCR system and 7500 software v.2.0.6 (both Thermo Fisher Scientific Inc.). TaqMan probes used in this study are detailed in Table I.
Table I
Overview of TaqMan probes used in this study
Histological quantification and characterization of atherosclerotic plaques
Hearts of G-1-treated ApoE-/- mice and vehicle-treated controls were excized and embedded upright in tissue freezing medium. The aortic valve was positioned horizontally, and the hearts were frozen at –80°C. Then, the aortic root was sliced using a Leica CM 1900 cryostat (Leica Biosystems GmbH, Wetzlar, Germany) at a thickness of 8 μm per section. Tissue slices were recovered on poly-lysine-covered object slides (Thermo Fisher Scientific Inc., Waltham, USA) and stained for histological evaluation. Sections, on which all three cusps of the aortic valve could be identified, were used for histological plaque analyses. On average, 4 sections per heart were analyzed, spanning a distance of 320 μm.
Then, Oil Red O staining was performed to visualize atherosclerotic plaques. 0.5% (w/v) Oil Red O in an isopropanol stock solution was diluted with deionized water to a final concentration of 0.3% (w/v). Slides were thawed and dried at room temperature. Histological samples were dehydrated with 60% (v/v) isopropanol for 5 min before being exposed to the 0.3% (w/v) Oil Red O working solution for 15 min. Subsequently, slides were rinsed with deionized water and histological slices were co-stained with hematoxylin (Carl Roth GmbH, Karlsruhe, Germany) for 30 s. Finally, slides were washed with lukewarm tap water and sealed with cover slips using Aquatex mounting agent (Merck Millipore, Darmstadt, Germany).
Microscopic pictures were taken using a Zeiss Axiovert 200M microscope (Carl Zeiss Jena GmbH, Jena, Germany) and Axiovision 4.8 software (Carl Zeiss Jena GmbH). The percentage of plaque burden was calculated as Oil Red O-positive areas divided by the total area of the vessel wall. Treatment group affiliation was blinded prior to histological assessment.
Immunohistochemical staining of GPR30 in vascular tissue
Expression of GPR30 was assessed immunohistochemically in the abdominal aorta of male and female ApoE-/- mice. Aortic tissue was embedded in tissue freezing medium (Leica Biosystems GmbH, Wetzlar, Germany) and snap frozen at –80°C. Frozen sections were obtained using a Leica CM 1900 cryostat (Leica Biosystems GmbH, Wetzlar, Germany). Expression of GPR30 was assessed by immunohistochemical staining (primary antibody: α-GPR30, Rabbit, IgG, Abcam, Cambridge, UK) secondary antibody: Cy3, Goat Anti-Rabbit IgG, Abcam, Cambridge, UK). Slides were fixed in acetone for 20 min at room temperature, then washed in PBS and blocked in 2% BSA in PBS for 30 min. Afterwards, sections were incubated at room temperature for 1 h with the primary antibody, which had been diluted by 1 : 100 in blocking solution. Afterwards, slides were washed with PBS, and the secondary antibody, which had been diluted by 1 : 500 in PBS, was administered at room temperature in the dark for 1 h. Afterwards, slides were fixed, and nuclei were stained using Vectashield mounting medium with DAPI (Vector Laboratories). Microphotographic images were taken using a Zeiss Axiovert 200M microscope (Carl Zeiss Jena GmbH, Jena, Germany) and Axiovision 4.8 software (Carl Zeiss Jena GmbH).
Cell culture
Primary human coronary artery smooth muscle cells (HCASMC) were purchased from PromoCell (Heidelberg, Germany) and cultivated in phenol red-free smooth muscle cell basal medium (PromoCell) and the appropriate supplement mix containing fetal calf serum at a final concentration of 0.05 ml/ml, epidermal growth factor (0.5 ng/ml), basic fibroblast growth factor (2 ng/ml), and insulin (5 μg/ml), as described [26]. Experiments were carried out at 80% confluence and at passages six to eight.
mRNA expression levels of the AT1 receptor were quantified using qPCR as follows. HCASMC were stimulated with the GPR30 agonist G-1 (1 μM) for 4 h. At a concentration of 1 μM, G-1 has been reported to bind highly selectively to GPR30 with no relevant binding to ERα and ERβ [9]. Controls were stimulated simultaneously with DMSO (0.1% (v/v)). Thereafter, cells were rinsed with PBS and lysed with Trizol, as described before [27]. RNA precipitation and extraction were performed as described above for aortic tissue. TaqMan probes used in this study are detailed in Table I.
L-012 working solution was prepared freshly, as described for the ex vivo measurement of reactive oxygen species from vascular tissue (see 2.4). HCASMC were stimulated with G-1 (1 μM), angiotensin II (1 μM), or both for 4 h. DMSO (0.1% (v/v)) served as a control. Cells were washed with PBS and harvested using trypsin (0.05% (w/v)) for 5 min. Cells were collected and counted using a Neubauer counting chamber (Brand GmbH, Wertheim, Germany). Subsequently, cells were centrifuged (170 × g, 5 min) and reconstituted in 100 μl of L-012 working solution, and ROS were detected with a Lumat LB 9501 scintillation counter. Events were normalized to the cell count. Five-minute scintillation counts were used for statistical analyses.
HCASMC proliferation was quantified using a colorimetric 5-bromo-2’-deoxyuridine (BrdU) ELISA, according to the manufacturer’s instructions (BrdU Cell Proliferation ELISA kit (colorimetric), Abcam, Cambridge, UK). HCASMC were cultured in 96-well plates and assayed at 70-80% confluence. In brief, cells were stimulated with G-1 (1 μM), angiotensin II (1 μM), or both for 24 h. DMSO (0.1% (v/v)) served as a control. After stimulation, replicating DNA was labeled with the BrdU reagent supplied with the kit for 4 h. Cells were fixed, permeabilized, and tagged with a BrdU antibody and a horseradish peroxidase-conjugated secondary antibody. The latter catalyzed a colorimetric reaction upon addition of the chromogenic substrate tetra-methylbenzidine (TMB), which was quantified using a microplate reader (Infinite M200, Tecan, Männedorf, Switzerland).
Statistical analyses
Data are presented as the mean ± SEM. Analyses were performed using Microsoft Excel software (Microsoft, Redmond, USA) and GraphPad Prism (GraphPad Software, San Diego, USA). Continuous variables of two groups were compared using unpaired Student’s two-sided t-test. For the comparison of three or more groups, a one-way ANOVA and subsequent Bonferroni correction were performed. P-values < 0.05 were considered statistically significant. Effect sizes were estimated from the published results of similar studies. Meyer and co-workers found a ~45% reduction in the atherosclerotic plaque burden in G-1-treated wildtype mice compared to vehicle-treated controls [19]. The sample size was calculated using G*Power software (Franz Faul, University of Kiel, Germany) with a prespecified α error probability of 0.05 and a prespecified power (1 − β error probability) of 0.95.
Results
G-1 treatment does not alter arterial blood pressure, heart rate, body weight, or total cholesterol in atherosclerotic ApoE-/- mice
Arterial blood pressure of male ApoE-/- mice and female ovariectomized ApoE-/- mice was assessed after 7 weeks of G-1- versus vehicle treatment. As detailed in Table II, G-1 treatment did not change arterial blood pressure compared to vehicle-treated control animals. Likewise, G-1 treatment did not affect murine heart rate, body weight, or total cholesterol levels (Table II).
Table II
Clinical parameters. Clinical parameters were assessed separately for male and female ovariectomized mice at the end of the feeding period. Plasma cholesterol, body weight, arterial blood pressure, and heart rate were not significantly different between the treatment groups for both sexes. Data are presented as the mean ± standard error of the mean; n = 4–5. OVX, ovariectomized
G-1 improves both fasting blood glucose and glucose tolerance in vivo
Insulin sensitivity was measured by fasting blood glucose and i.p. glucose tolerance tests (ipGTT). After 6 weeks of G-1 treatment, fasting blood glucose levels were significantly lower in female ovariectomized ApoE-/- mice compared to vehicle-treated controls (111.8 ±2 mg/dl versus 126.8 ±4 mg/dl; n = 4–5; p = 0.0450; Figure 2 A). Among male ApoE-/- mice, fasting blood glucose levels were lower in the G-1-treated group than the control group, but the difference did not reach statistical significance (101 ±9 mg/dl versus 119 ±10 mg/dl; n = 4–5; p > 0.05; Figure 2 B).
Figure 2
Assessment of blood glucose levels and glucose tolerance in vivo. Glucose tolerance was assessed in atherosclerotic ApoE-/- mice after 6 weeks of high-fat diet and GPR30 agonist (G-1)- versus vehicle (dimethyl sulfoxide – DMSO) treatment. The fasting blood glucose level was significantly reduced in G-1-treated female mice compared to vehicle-treated controls (A). The G-1-induced reduction in fasting blood glucose levels did not reach statistical significance in male mice (B). Upon intraperitoneal glucose tolerance test (ipGTT), glucose tolerance was improved in both female and male mice following G-1 treatment (C, D). Data are presented as the mean ± standard error of the mean; n = 4–5; *p < 0.05; **p < 0.01
OVX – ovariectomized.
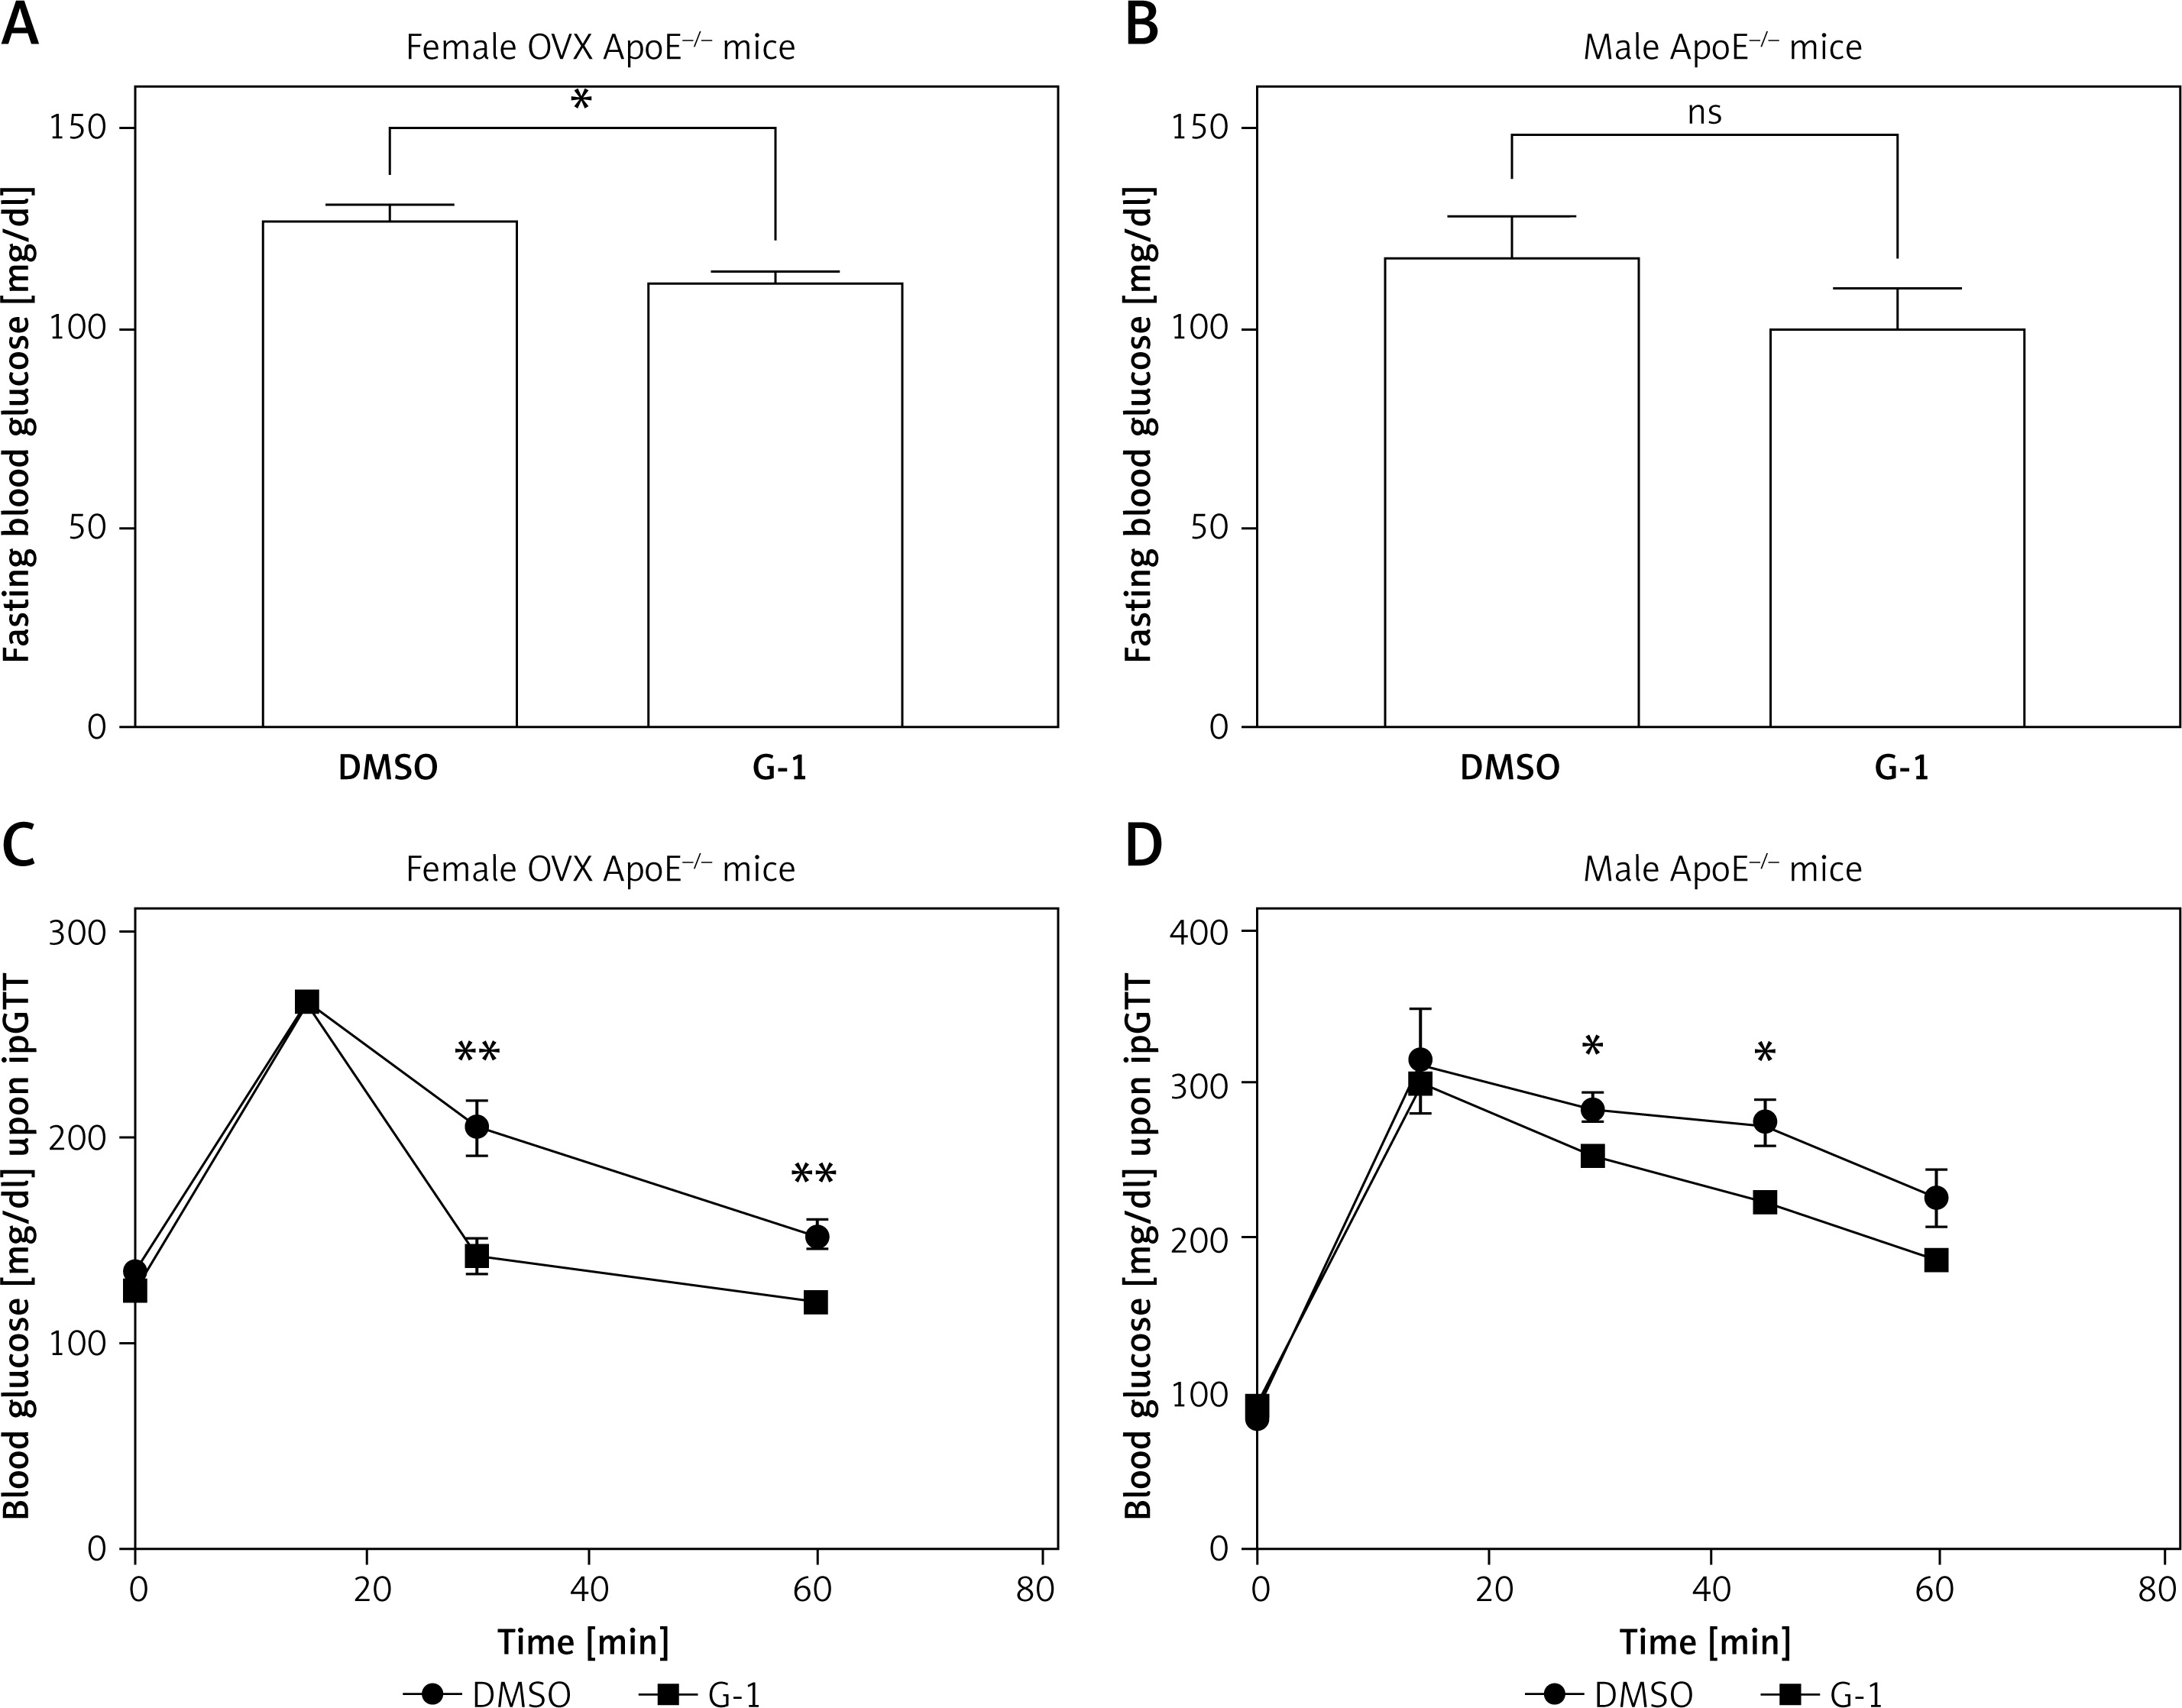
On ipGTT, mice of both sexes showed significantly improved glucose tolerance after G-1 treatment, compared to the vehicle control. After an i.p. challenge with 2 g/kg glucose, female mice of the G-1 treatment group quickly recovered from peak blood glucose levels and reached 142.2 ±8.1 mg/dl (n = 5) within 30 min. Meanwhile, blood glucose levels were still significantly elevated in the female control group, 30 min after the glucose challenge (204.6 ±13.3 mg/dl; n = 5; p = 0.0039; Figure 2 C). Male ApoE-/- mice peaked slightly higher than female mice, and euglycemia was not restored within 60 min in both treatment groups. However, glucose tolerance of G-1-treated male mice was also improved compared to controls, which resulted in a significantly lower blood glucose level at 30 and 45 min after the glucose challenge (252.5 ±5.6 mg/dl versus 283.7 ±8.8 mg/dl; n = 4; p = 0.0250 (30 min); 222.3 ±3.7 mg/dl versus 273.7 ±14.5 mg/dl; n = 4; p = 0.0105 (45 min) (Figure 2 D).
G-1 enhances endothelium-dependent vasodilation and diminishes vascular ROS formation
Vascular contractility and endothelium-dependent vasodilation of the thoracic aorta were studied in an organ bath after 7 weeks of high-fat diet and G-1 versus vehicle treatment. Vasoconstriction was triggered by phenylephrine in terms of concentration responses. Vasoconstriction was similar between treatment groups in both sexes (Figures 3 A, B).
Figure 3
Assessment of endothelium-dependent vasodilation and ROS production in vivo. Isolated aortic rings of G-1-treated ApoE-/- mice (blue squares) and vehicle-treated controls (DMSO, black circles) were exposed to increasing concentrations of phenylephrine to elicit vasoconstriction (A, B) and subsequently to carbachol to measure endothelium-dependent vasorelaxation. Endothelial function was significantly improved in G-1-treated female ApoE-/- mice compared to vehicle-treated controls (C) but not in male ApoE-/- mice (D). The improvement in vascular function was associated with reduced ROS production following G-1 treatment in the female cohort, as assessed by L-012-enhanced chemiluminescence (E). ROS production in male mice was not significantly reduced by G-1 (F). Data are presented as the mean ± standard error of the mean; n = 5–6; *p < 0.05; **p < 0.01
RLU – relative light units, ROS – reactive oxygen species.
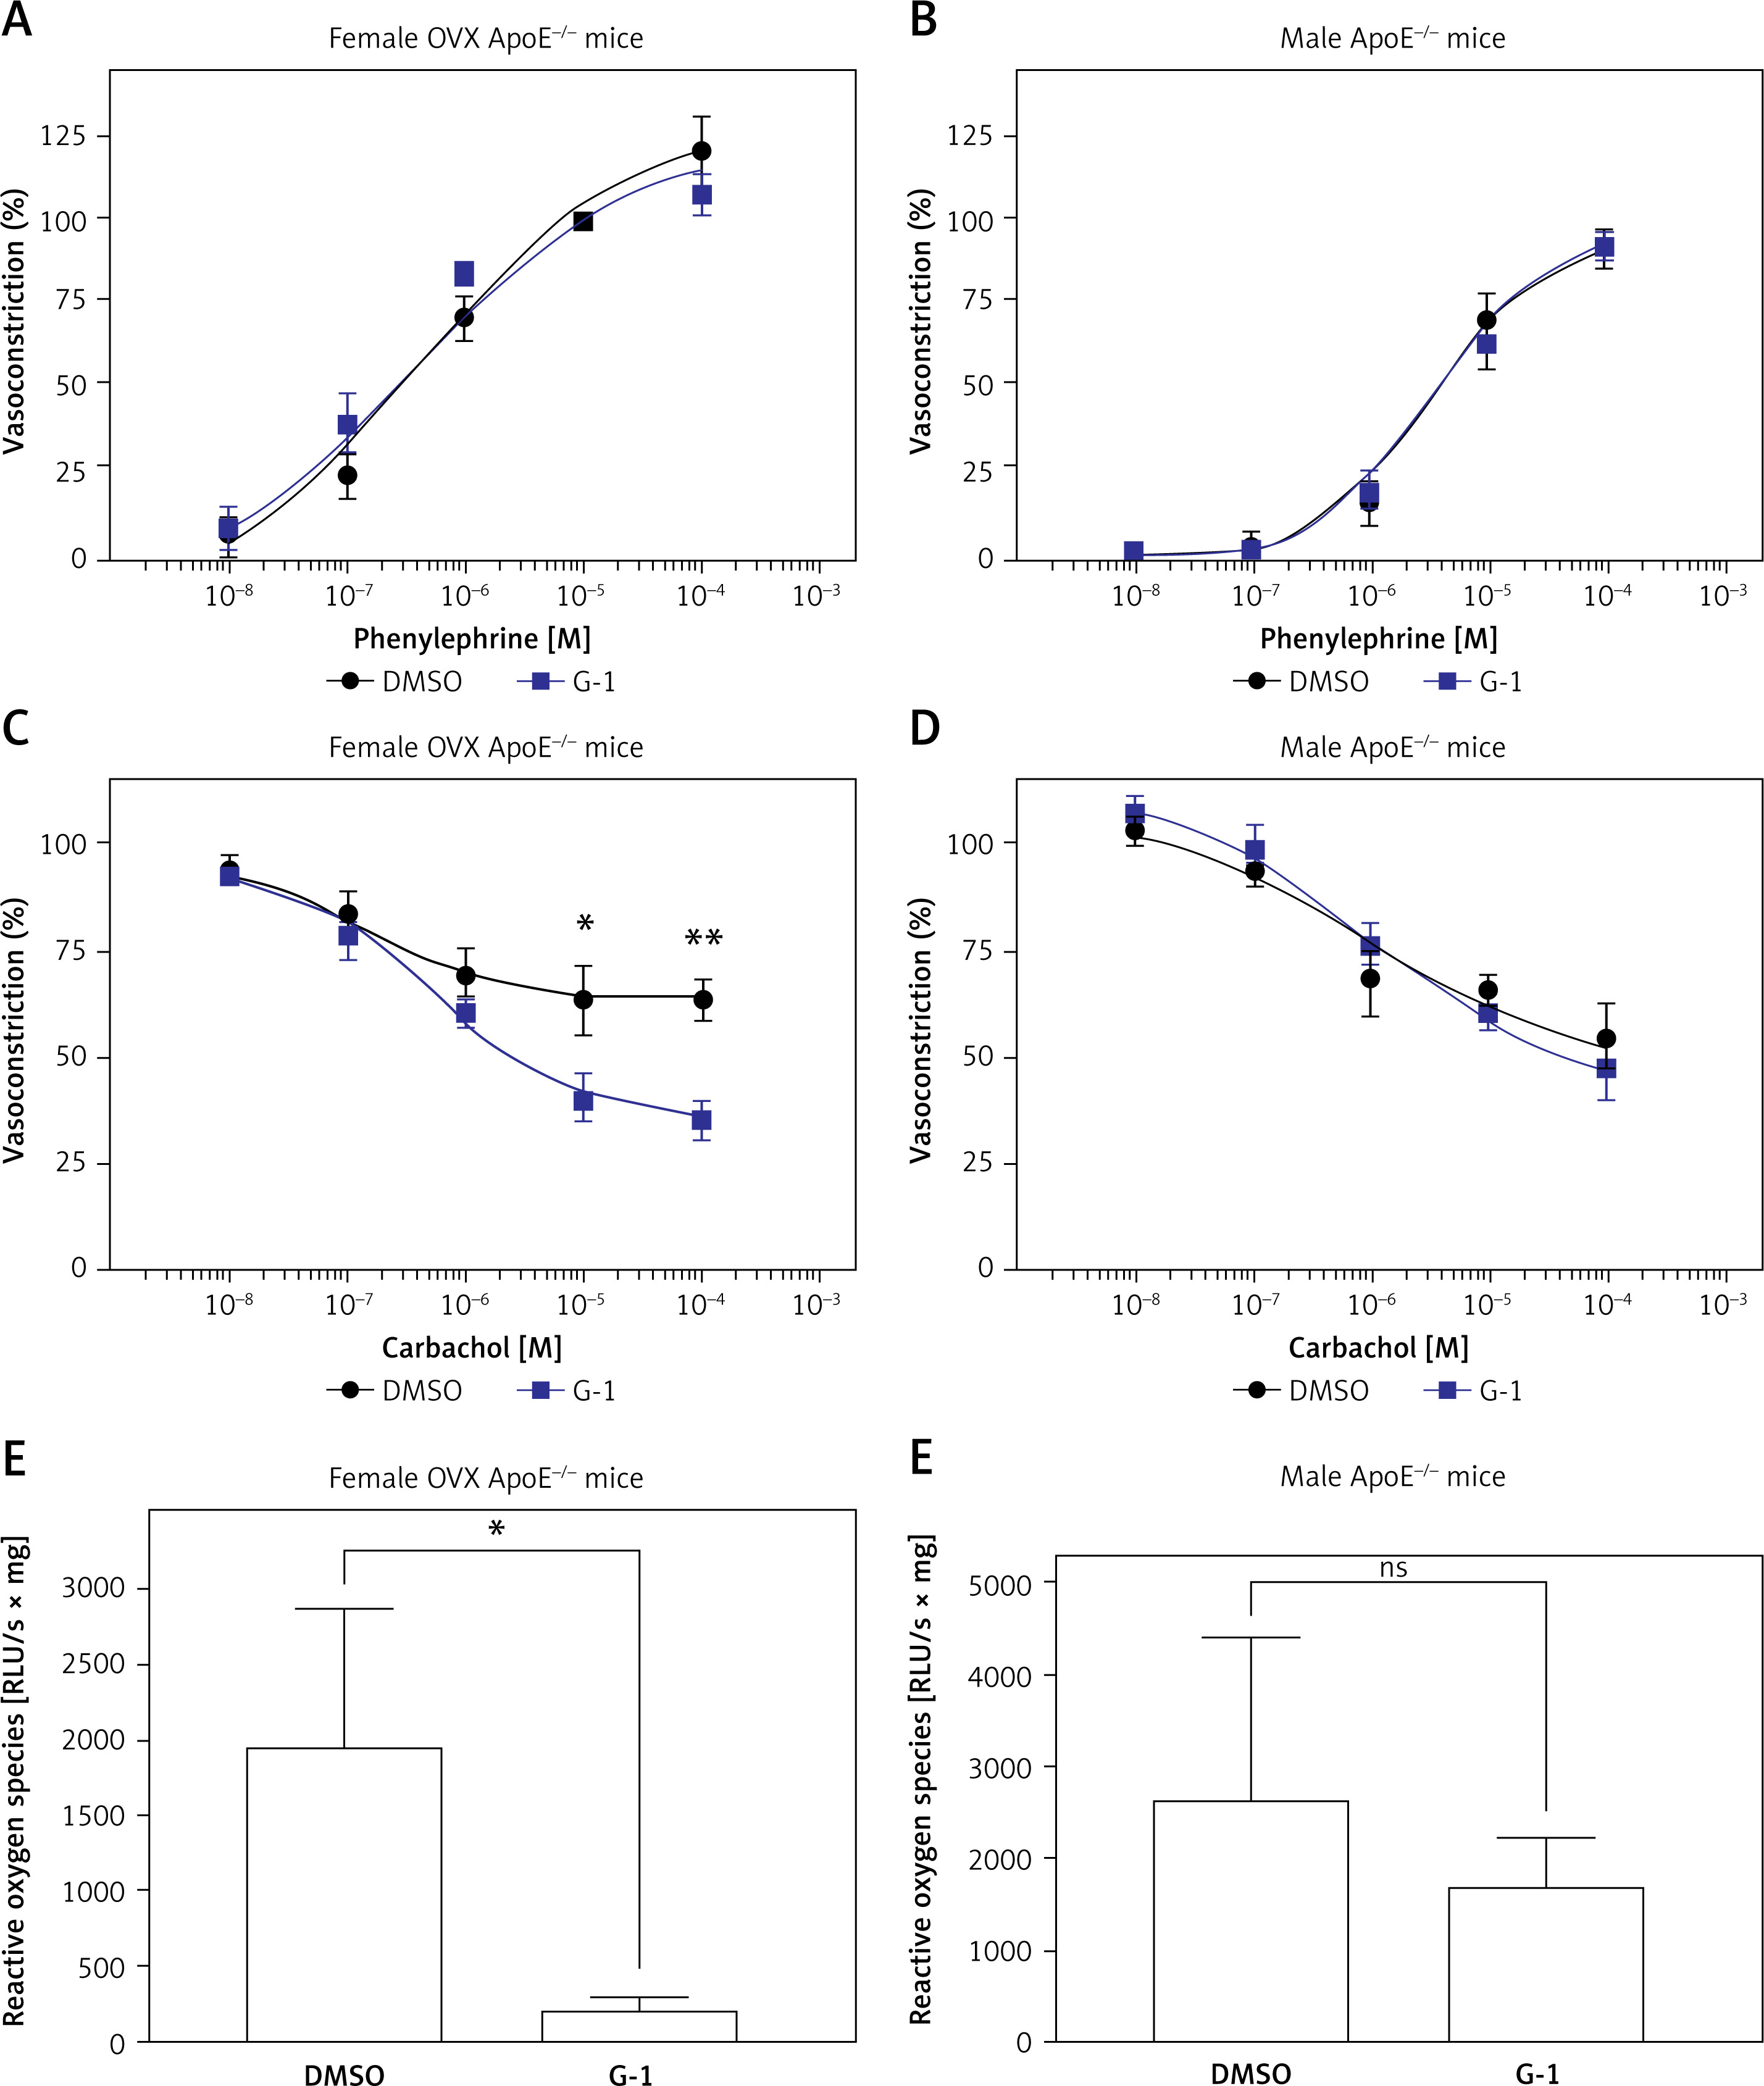
Endothelium-dependent vasodilation was elicited by increasing concentrations of carbachol. In female ovariectomized ApoE-/- mice, G-1 treatment significantly improved endothelium-dependent vasodilation compared to vehicle. At a carbachol concentration of 10-5 M, G-1-treated mice displayed an average relaxation to 40.3 ±5.5% (n = 6) compared to only 63.0 ±8.0% (n = 5; p = 0.0399) in the control group, and at 10-4 M carbachol, G-1-treated mice displayed an average relaxation to 35.1 ±4.5% (n = 6; G-1) compared to only 63.0 ±4.6% (n = 5; p = 0.0021; control; Figure 3 C). Such differences were not apparent in male ApoE-/- mice, where G-1-treated animals showed no improvement in endothelium-dependent vasodilation compared to vehicle-treated controls (Figure 3 D).
The effects of G-1 treatment on vascular relaxation were mirrored by vascular reactive oxygen species formation. G-1-treated female ovariectomized ApoE-/- mice showed a dramatic decrease in ROS formation compared to vehicle-treated controls (221 ±88 RLU/s/mg vs. 1,983 ±885 RLU/s/mg; n = 5–7; p = 0.0387, Figure 3 E). Meanwhile, G-1 treatment caused no significant reduction in ROS production in male ApoE-/- mice (2,679 ±1,700 RLU/s/mg vs. 1,708 ±546 RLU/s/mg; n = 5; p > 0.05, Figure 3 F).
G-1 treatment alleviates the atherosclerotic plaque burden of ApoE-/- mice
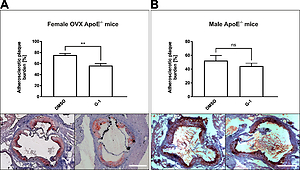
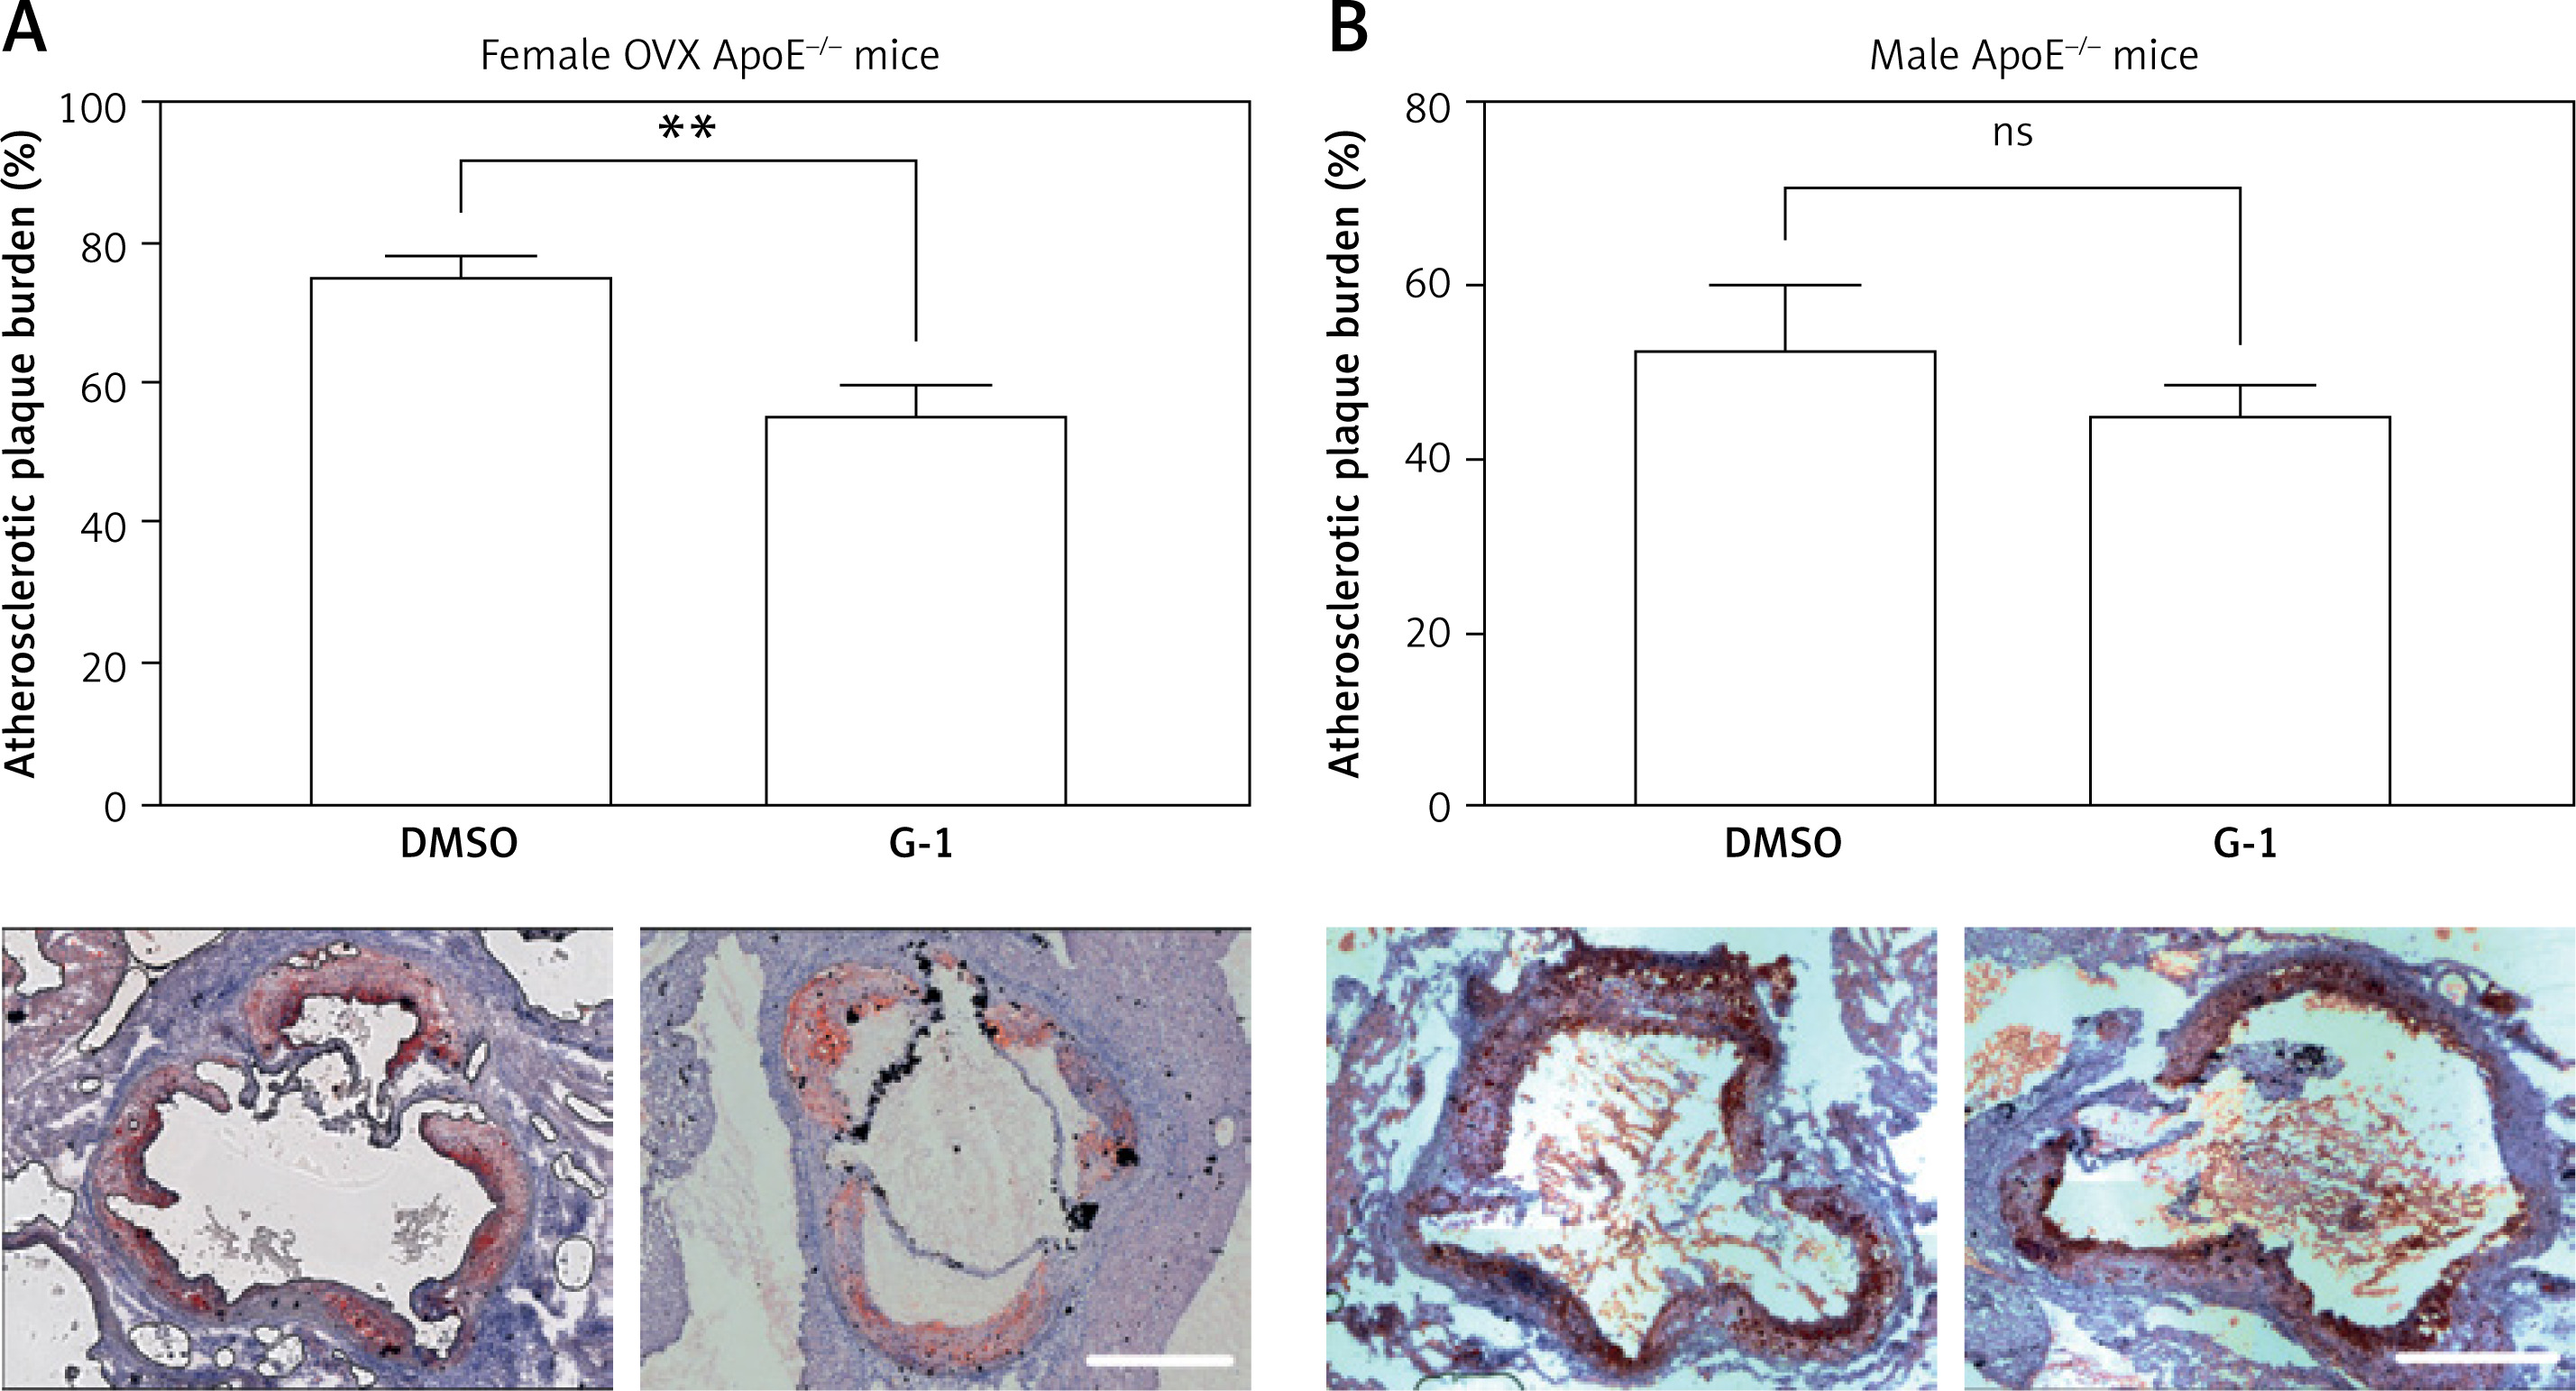
The atherosclerotic plaque burden was assessed in frozen cross-sections through the aortic sinus. ApoE-/- mice, which had been treated with the selective GPR30 agonist G-1, showed a markedly reduced atherosclerotic plaque burden compared to vehicle-treated controls. This effect reached statistical significance in female ovariectomized ApoE-/- mice, where Oil Red O-positive areas yielded 56.5 ±3.7% (n = 6; G-1) versus 75.5 ±2.9% (n = 4; p = 0.0065; control; Figure 4 A) of the total vessel area. Among male ApoE-/- mice, Oil Red-O positive areas yielded 44.6 ±7.4% (n = 5; G-1) and 52.3 ±4.0% (n = 5; p > 0.05; control; Figure 4 B).
Figure 4
Assessment of the atherosclerotic plaque burden. Atherosclerotic plaques were visualized in frozen sections through the aortic sinus by Oil Red O staining. Relative atherosclerotic plaque burden was calculated as the ratio between total plaque area and total vessel wall area. G-1 was associated with a significant reduction in the atherosclerotic plaque burden of female ApoE-/- mice (A). In male mice, atherosclerotic plaque burden was slightly reduced by G-1 without reaching statistical significance (B). Data are presented as the mean ± standard error of the mean; n = 4–6; *p < 0.05. Scale bar, 500 μm
GPR30 is not expressed in resident vascular cells of the murine aorta
Since gender differences in the expression of GPR30 may account for the observed differences in the effect of G-1 on endothelial function and atherogenesis, we studied the expression of GPR30 in aortic tissue of female and male ApoE-/- mice. Both by qPCR and by immunohistochemistry, GPR30 was undetectable in the aortic tissue, irrespective of gender (Supplementary Figure S1). Expression of the AT1 receptor was not altered in aortic tissue from female and male ApoE-/- mice treated with G-1 as compared to vehicle-treated controls (female DMSO vs. G1: 1.00 ±0.28 vs. 2.52 ±1.20-fold; n = 3; p > 0.05; male DMSO vs. G1: 0.52 ±0.17 vs. 0.59 ±0.08-fold; n = 5; p > 0.05).
G-1 diminishes AT1 receptor expression in HCASMC and mitigates angiotensin-driven HCASMC proliferation and ROS production
Finally, the effects of the selective GPR30 agonist G-1 on HCASMC biology were assessed in vitro.
HCASMC were stimulated with G-1 (1 μM) for 4 h, which caused a significant decrease in AT1 receptor mRNA expression levels compared to vehicle (0.67 ±0.09-fold; n = 10; p = 0.0246; Figure 5 A).
Figure 5
Quantification of AT1 receptor mRNA expression, ROS production, and cell proliferation upon G-1 stimulation in HCASMC. AT1 receptor mRNA expression of HCASMC was assessed by qPCR upon stimulation with G-1 (1 μM) for 4 h (A). ROS formation was assessed by the L-012 assay (B). HCASMC proliferation was assessed using an ELISA-based BrdU staining assay (C). Data are presented as the mean ± standard error of the mean; n = 2–16; *p < 0.05; **p < 0.01
Ang II – angiotensin II, AT1 receptor – angiotensin II type 1 receptor, BrdU – 5-bromo-2ʹ-deoxyuridine, DMSO – dimethyl sulfoxide, G-1 – GPR30 agonist, HCASMC – human coronary artery smooth muscle cells, RLU – relative light units, ROS – reactive oxygen species.
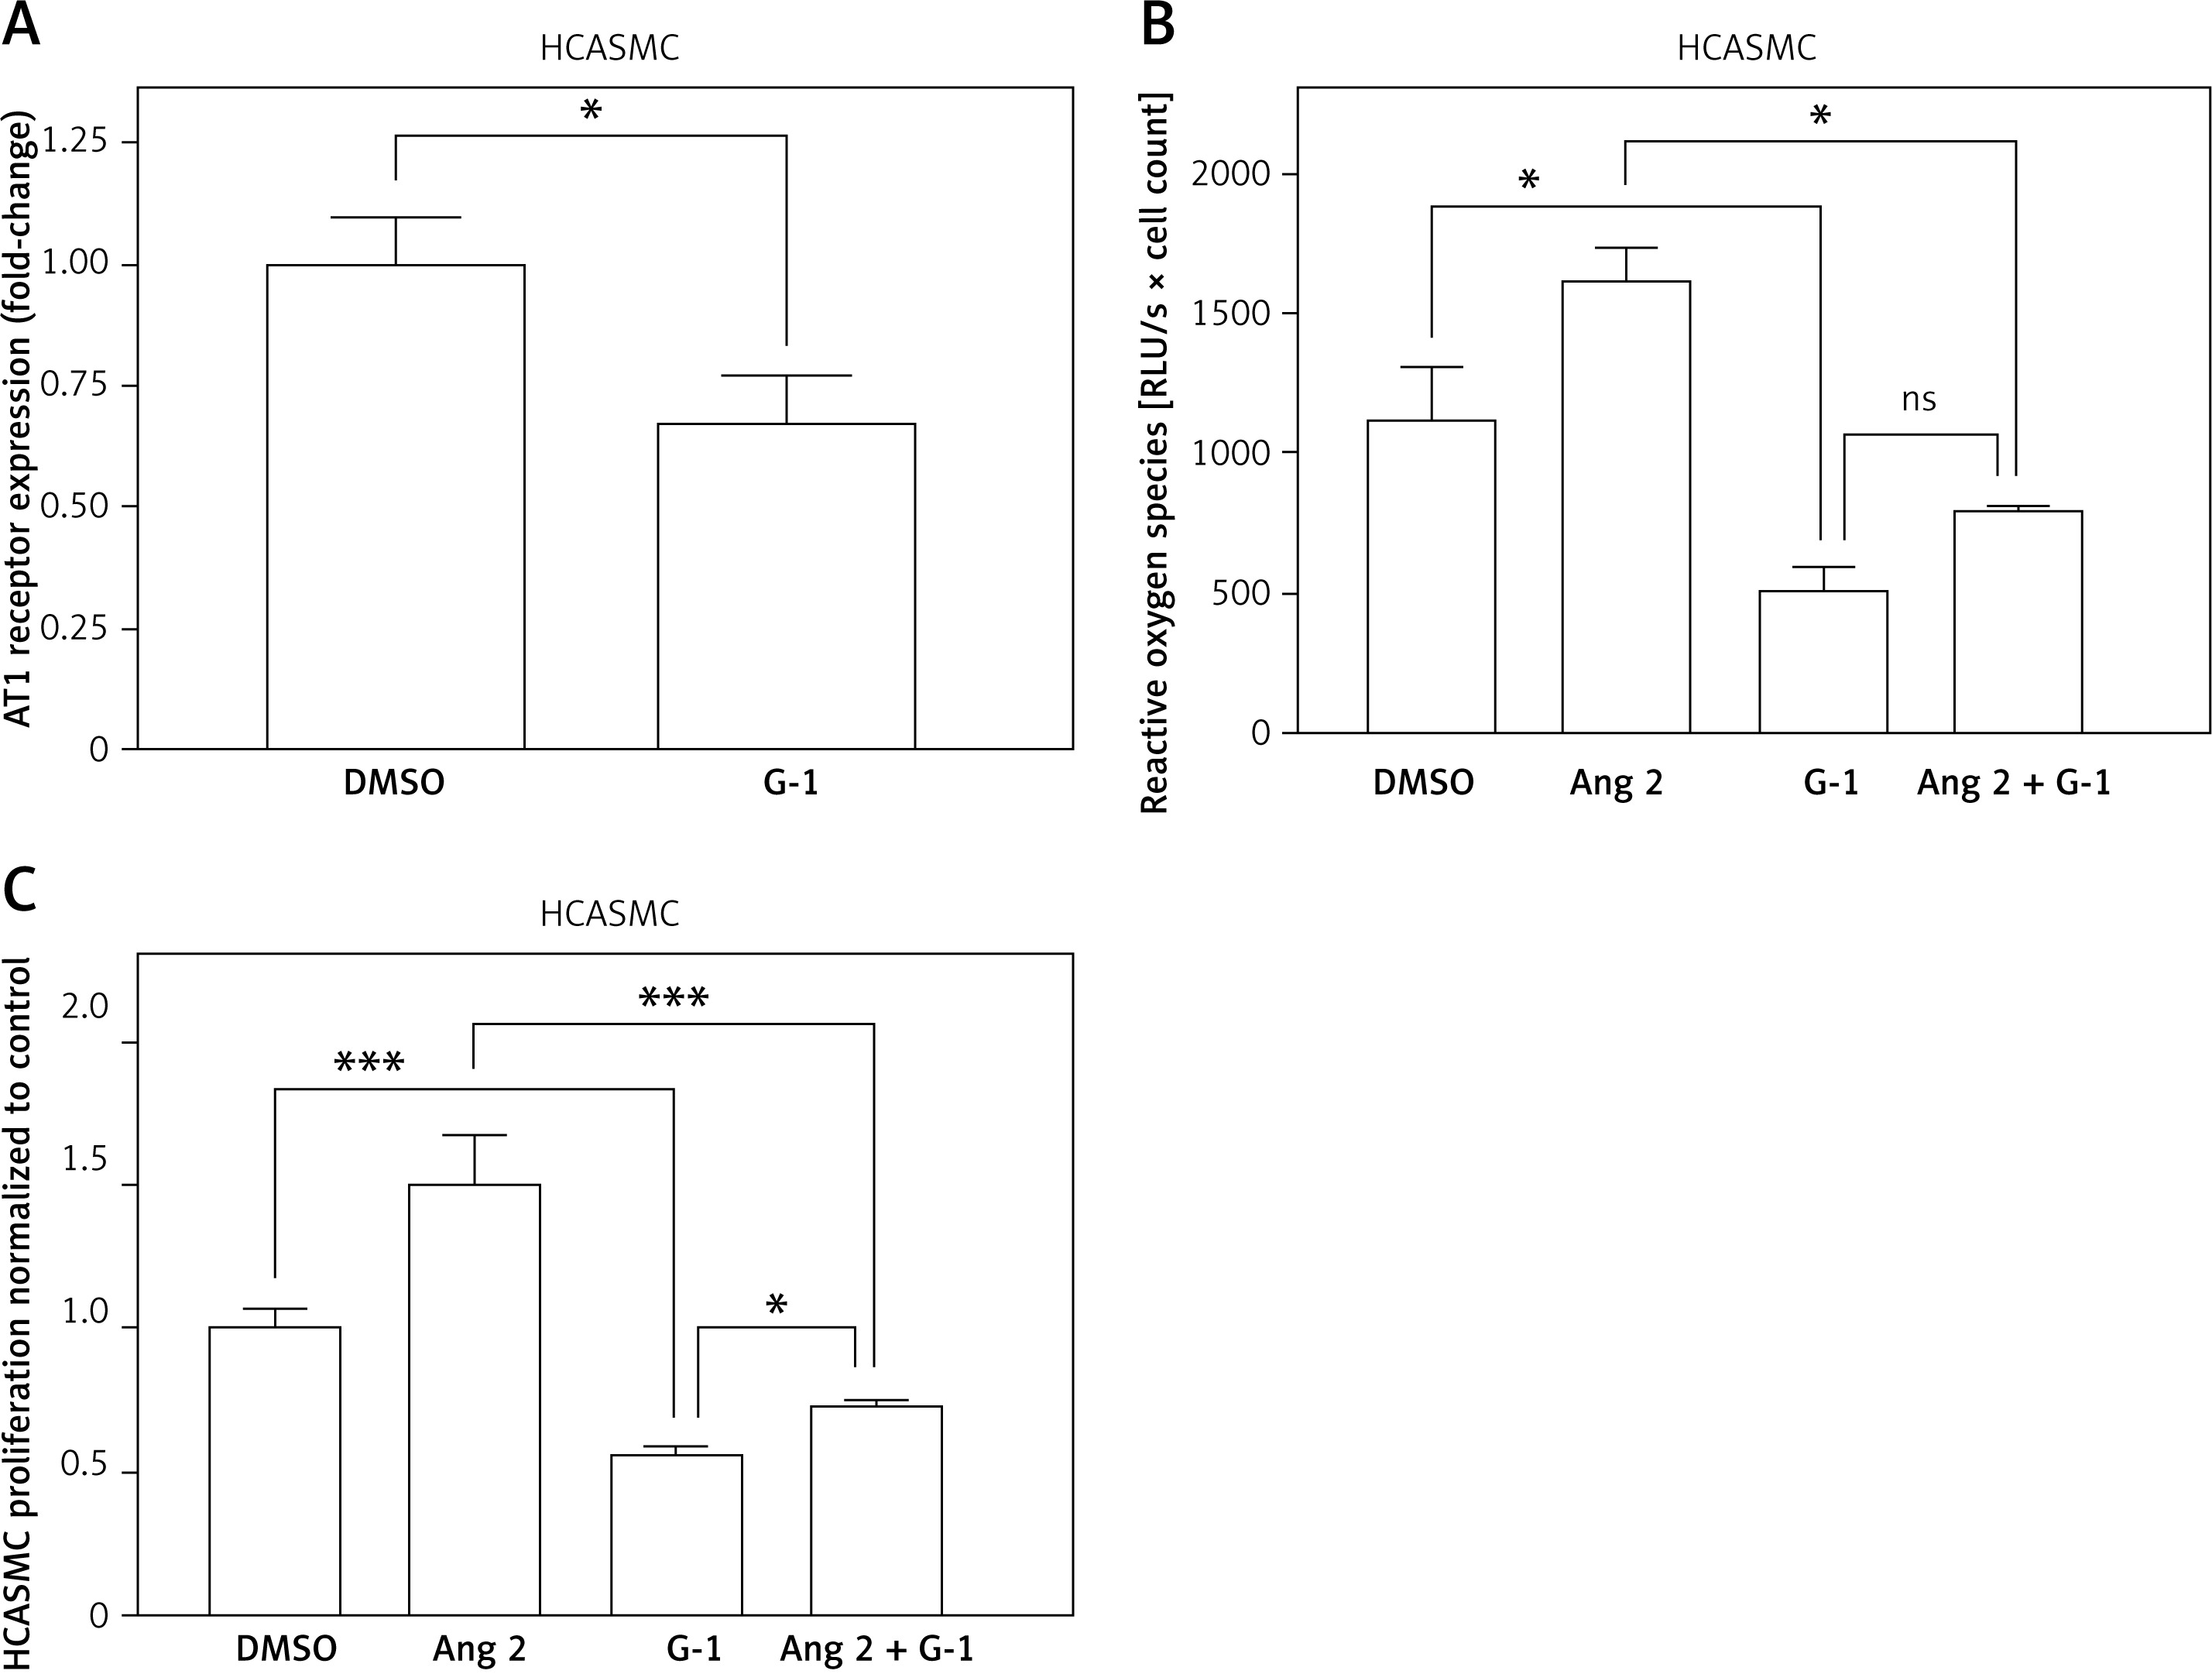
Subsequently, HCASMC were stimulated with G-1 (1 μM), angiotensin II (1 μM), or both for 4 h, and ROS formation was quantified. G-1 significantly reduced baseline ROS formation compared to the control (529 ±69 RLU/s/mg vs. 1,131 ±182 RLU/s/mg; n = 3–4; p = 0.0098). Meanwhile, angiotensin II-treated cells showed higher, but not significantly different, ROS formation (1,625 ±105 RLU/s/mg; n = 2–4; pvs. ctrl. > 0.05). This difference was substantially attenuated by co-administration of G-1, although G-1 did not completely suppress angiotensin II-driven ROS formation (817 ±7 RLU/s/mg; n = 2–4; pvs. angII = 0.0219; pvs. G-1 > 0.05; Figure 5 B).
In an additional approach, the effect of G-1 and angiotensin II on HCASMC proliferation was quantified by an ELISA-based BrdU assay. G-1 reduced baseline HCASMC proliferation by 43.2 ±1.3% (n = 9–15; pvs. ctrl. < 0.001), while angiotensin II increased it by 50.4 ±1.7% (n = 5; pvs. ctrl. < 0.001). During co-administration of both substances, G-1 and angiotensin II, HCASMC proliferation was markedly reduced compared to angiotensin II alone by 26.8 ±2.7%; n = 16; pvs. angII < 0.001), yet was slightly increased compared to G-1 alone (pvs. G-1 = 0.0382; Figure 5 C).
Discussion
In the present study, we investigated the influence of the selective GPR30 agonist G-1 on glucose tolerance, endothelial dysfunction, reactive oxygen species formation, and atherogenesis in the atherosclerotic ApoE-/- mouse model. Several studies have already addressed the role of GPR30 in diabetes, vasodilation, and atherogenesis using murine, porcine, and human models [5, 16, 21]. However, no study has yet investigated the vasoactive and anti-atherogenic properties of G-1 within the atherosclerotic ApoE-/- mouse model.
Our study demonstrates that G-1 improves endothelium-dependent vasorelaxation in ovariectomized ApoE-/- mice. This is accompanied by a significant decrease in ROS formation within the atherosclerotic vessel wall due to G-1 treatment. ROS are known to limit the endothelial availability of NO; therefore, mitigation of ROS might explain the improved vascular function following administration of G-1 [28]. In addition to reduced degradation of NO, its bioavailability is also increased by enhanced synthesis. Interestingly, Meyer et al. demonstrated that G-1 causes the phosphorylation and activation of endothelial NO synthase (eNOS) in human endothelial cells [21]. A similar mechanism was observed in diabetic rats [16] and might also contribute to the improved vasorelaxation seen in the current atherosclerotic mouse model. Interestingly, both effects, mitigation of ROS and improvement of vasorelaxation, were markedly more pronounced in ovariectomized female mice than in male mice, which may underline the potential pathophysiological relevance of these mechanisms in postmenopausal women.
The improvement in vascular relaxation capacity due to G-1 treatment was accompanied by a reduced atherosclerotic plaque burden in G-1- versus vehicle-treated animals. While this is, to our knowledge, the first study to investigate the influence of G-1 on atherogenesis in the ApoE-/- mouse model, one previous study has already investigated the influence of G-1 on atherogenesis in wildtype mice. This earlier report by Meyer and co-workers, who found a significant reduction in the atherosclerotic plaque burden of G-1-treated wildtype mice compared to vehicle-treated controls, is corroborated by our data [21]. Our work extends the current knowledge on the effect of GPR30 signaling to the most commonly used atherosclerotic mouse model, which may facilitate future research in the field.
GPR30 has not only been shown to improve endothelial function and to promote atheroprotection but has also been reported to favorably modulate cardiovascular risk factors [29]. Consequently, we investigated the impact of G-1 on arterial blood pressure and blood glucose in the atherosclerotic ApoE-/- mouse model.
Interestingly, G-1 did not lower arterial blood pressure in the current study. This finding seems at odds with earlier reports on normotensive and hypertensive rats, in which an acute intravenous infusion of G-1, or its application over a short period of 2 weeks, lowered arterial blood pressure [13–15]. However, neither G-1 treatment over a prolonged period of time of 16 weeks nor genetic disruption of GPR30 for up to 6 months altered arterial blood pressure in mice [17, 21], which is in line with our own data.
Furthermore, GPR30 agonism by G-1 has been demonstrated to lower blood glucose levels in diabetic rats [16] and genetic disruption of GPR30 signaling promotes hyperglycemia and visceral obesity in mice [13, 17]. In the current study, G-1 greatly improved glucose tolerance in atherosclerotic mice of both sexes. These data extend our current knowledge of GPR30’s role in glucose homeostasis to the atherosclerotic ApoE-/- model. Earlier reports have demonstrated that G-1 increases insulin secretion from human pancreatic islets and that genetic disruption of GPR30 diminishes insulin transcription and release in mice [17, 19, 20]. This mechanism might also apply in the ApoE-/- mouse model, which would explain the improvement in glucose tolerance in the present study.
In a previous study by Isensee and coworkers, gender differences in the expression pattern of GPR30 were carefully evaluated in C57BL/6J wildtype mice, i.e. the genetic background from which the ApoE-/- mice used in our present study were derived [30]. Consistent with our findings, GPR30 was absent in the aortic tissue in this former study. While GPR30 is absent in large arteries, it is, however, expressed in other vascular beds, e.g. in the small arterioles of the vasa vasorum, in fine branches of the mesenteric arteries, as well as in vascular smooth muscle cells and pericytes in the brain and in both human and porcine coronary artery smooth muscle cells [30, 31]. Interestingly, there is currently no evidence for gender differences in the expression of GPR30 in any tissue [30]. Different receptor expression quantities between sexes are thus an unsuitable explanation for the clear gender differences in the effect of G-1 on aortic endothelial function and atherogenesis, which are shown by our in vivo experiments. One may speculate that these differences are due to functional or expressional differences in other organs and cells that regulate glucose metabolism or ROS generation and not due to direct effects of G-1 on resident vascular cells in the murine aorta. Meanwhile, our in vitro experiments on human coronary artery smooth muscle cells do indicate direct effects of G-1 on AT1-receptor expression and on HCASMC proliferation.
Finally, the effect of G-1 on HCASMC biology was studied in vitro in order to gain mechanistic insights into how human atherogenesis might be influenced by GPR30-signaling. As G-1 has been reported to reduce the expression of the AT1 receptor in aortic tissue of rats [14] and given that AT1-receptor activation is a potent trigger of ROS formation [32], we studied whether G-1 counteracts AT1-receptor-induced ROS production and proliferation of HCASMC. Intriguingly, G-1 markedly reduced baseline ROS production by HCASMC and mitigated ROS production induced by angiotensin II. Similarly, G-1 diminished HCASMC proliferation and attenuated its induction by angiotensin II. Additionally, our data demonstrate that G-1 induces downregulation of the AT1 receptor in HCASMC, which may contribute to the reduction in ROS production and HCASMC proliferation in vitro and which might promote atheroprotective effects in vivo.
Our data underline the vasculoprotective and anti-atherogenic properties of G-1, and its clinical use as an anti-atherosclerotic treatment appears to be compelling, especially in postmenopausal women. However, GPR30 has been implicated in the carcinogenesis of hormone-sensitive tumors, such as ovarian, breast, and cervical cancers, which might limit the clinical benefits of GPR30 agonists [33, 34]. Although other studies have reported vasculoprotective effects for two selective estrogen receptor modulators (SERM), raloxifene and lasofoxifene, which are used in the therapy for breast cancer and osteoporosis [5, 35, 36], these substances antagonize ERα and ERβ but act as GPR30 agonists. Similar compounds could be used to produce favorable cardiovascular effects without potential carcinogenic side effects.
In conclusion, taken together, our data indicate that G-1 improves glucose tolerance and exerts atheroprotective effects in ApoE-/- mice. G-1 reduces ROS production, improves vasorelaxation, and reduces atherosclerotic plaque burden. These effects are more pronounced in female ovariectomized ApoE-/- mice. GPR30 agonism might thus be a potential therapeutic strategy against atherosclerosis, particularly in the context of estrogen deficiency.