Introduction
Ifosfamide (IFA) is a pro-drug activated by CYP2B6, CYP2C9, CYP3A4 and CYP3A5 enzymes [1]. It is used to treat solid tumors, lymphomas and sarcomas with a high degree of malignancy [2]. Single nucleotide polymorphisms (SNPs) in genes that encode antineoplastic drug-metabolizing enzymes could have effects on drug efficacy, toxicity and life span [3–5]. The CYP2B6 gene has more than 29 SNPs, but only CYP2B6*2 and CYP2B6*6 are functionally significant and result in decreased enzyme activity [6, 7]. The CYP2B6*5 isoform results in increased activity of CYP2C9, which is considered a highly variable gene and has more than 34 alleles (www.imm.ki.se/CYPalleles). The most studied are CYP2C9*2 and CYP2C9*3. It is known that most CYP2C9 polymorphisms decrease enzymatic activity [8, 9]. Another very important member with a broader spectrum of drug substrates is CYP3A4, which is also the most abundant isoform in the liver. CYP3A4 has more than 30 alleles including 18 non-synonymous mutations (www.imm.ki.se/CYPalleles). The most studied of these is CYP3A4*1B, which is associated with low expression and activity of the enzyme [10]. To date, more than 11 alleles of CYP3A5 have been identified; of these the most studied with a clinical impact is the CYP3A5*3 allele. Individuals homozygous for this variant do not express a functional enzyme due to a cryptic splice site that results in the incorporation of an intronic sequence in mature mRNA and the production of a truncated protein due to the premature appearance of stop codon [11]. Due to the main role of these genes in the metabolism of chemotherapy drugs which are commonly used in the treatment of solid tumors with mortality in our country, the aim of our study was to analyze gene frequencies of allelic variants and their association with ifosfamide blood levels and patient prognosis.
Material and methods
The cohort was made up of patients between 1 month and 17 years old from June 2013 to March 2018 recruited in the pediatric oncology service of the National Institute of Pediatrics (INP) in Mexico City with a diagnosis of advanced solid tumor (stages III and IV) with measurable disease, without neurological, renal or liver failure, and were included as part of a registered study that was approved by the Institutional Research, Ethics and Biosafety Committees, with registration number INP-068/2013. For all the patients the informed consent or assent was obtained.
All patients had solid tumors classified as central nervous system (CNS) tumors which included medulloblastomas, glioblastoma, ependymoma, pineoblastoma, astrocytoma, neuroepithelioma, rhabdoid tumor, neuroectodermal tumor and neuroblastomas; and sarcomas, retinoblastomas, osteosarcomas, germinal tumor, Wilms tumor and hepatoblastoma.
Patients received IFA doses of 1.8 g/m2/day, for 5 days in 3-hour infusion in mixed solution at 800 ml/m2, and 900 ml/m2 of MESNA (sodium 2-mercaptoethane sulfonate) for 6 cycles at intervals of 21 days. Ifosfamide was administered in combinations with carboplatin, etoposide, doxorubicin, methotrexate, vincristine, and other antineoplastic drugs, according to the treatment scheme indicated based on Children’s Oncology Group Mexican guidelines [12]. All the patients had normal neurological, renal and hepatic function. At the beginning of the study all patients had more than 1000 leukocytes, 500 neutrophils and 150,000 platelets.
The polymorphisms studied were: CYP2B6 (rs8192709, rs3745274 and rs3211371), CYP2C9 (rs1799853, rs1057910), CYP3A4 (rs2740574) and CYP3A5 (rs776746). The SNPs were analyzed based on inheritance models: dominant (homozygous mutated + heterozygous vs. normal homozygote) and recessive (homozygous mutated vs. heterozygous + normal homozygous) with blood levels of ifosfamide as well as response to treatment.
Genotyping
Five ml blood samples were collected from each patient, by venipuncture in Vacutainer EDTA tubes, which were used for the subsequent extraction of DNA.
The genomic DNA was isolated from peripheral blood leukocytes with the QIAamp DNA Mini kit, and the genotype analysis was carried out by the allelic discrimination test using TaqMan probes. Fluorescence was quantified for each sample in Step One equipment for allelic discrimination (Applied Biosystems Foster City, CA, USA).
The amplification assays of the allelic variants were performed as follows: 30 ng of DNA sample, 220 μl of TaqMan PCR Master Mix 2X, 0.4 μl of 20X of each probe (Applied Biosystems) and 300 μl of water. The allelic variants were characterized by the fluorescent 5’ exonuclease method (TaqMan) and then independently analyzed.
Quantification of ifosfamide in dried blood spots
In recent years, a method to quantify ifosfamide was developed in Mexico, using dried blood spots (DBS) on Güthrie cards (Whatman 903) for neonatal screening [13]. The DBS method has shown advantages over other methods, since it requires a single blood drop, a minimum amount of solvents and the quantification is faster, which significantly reduces its cost.
The blood samples were taken at 12 and 24 h after the infusion of IFA was completed on the last day of treatment (day 5). The blood samples of each patient were obtained by finger-pointing with BD Microtainer lancets, activated by contact. The blood was collected on Whatman 903 cards and then allowed to dry for 6 h at room temperature, protected from light and in a horizontal position. The samples were placed in plastic bags with a low gas permeability (Ziploc), including a desiccant material, and were stored at –80ºC until the moment of analysis. From each circle impregnated with blood, 5 discs of 3 mm were cut and acetonitrile and ethyl acetate were added to extract the drug. The separation was in Acquity equipment (Waters), column BEH-C18, 2.1 × 100 mm, 1.7 μm, mobile phase 5 mM ammonium formate and methanol: acetonitrile, at 0.2 ml/min. The LC-MS/MS detection was by ESI (+) and multiple reaction monitoring, ion transitions m/z1 + 260.99 > 91.63 Th for IFA and 261.00 > 139.90 Th for cyclophosphamide (internal standard).
Treatment response
Treatment response was evaluated at the end of the sixth cycle of chemotherapy according to the criteria for evaluation of response in solid tumors (RECIST) [14], an image study was repeated; computed tomography (CT) or magnetic resonance imaging (MRI) to assess the tumor response according to established criteria to determine four levels of response to treatment. This was divided into: 1. Complete response: 90% or more reduction of the lesions; 2. Partial response: reduction of the tumor size between 50% and 89% in the accumulated size of the lesions; 3. Stable response: reduction in tumor size less than 50% of the size in the initial study; and 4. Progression of the disease. Based on the type of tumor, we reclassified as “treatment response” if type 1 or 2 response were observed, and “without treatment response” if type 3 or 4 responses were observed.
Ethics
The study protocol has been presented to the Institutional Research, Ethics and Biosafety Committees (registration number INP-068/2013). For all the patients informed consent or assent was obtained.
Statistical analysis
The gene frequencies of each polymorphism were calculated. Then we compared the medians (Q25–Q75) of the concentration of ifosfamide at 12 h and 24 h between the polymorphisms of the genes studied and between treatment responding patients (RECIST 1 and 2) and non-responding ones (RECIST 3 and 4). Statistical significance was calculated using the nonparametric Mann-Whitney U test and Student’s t test was performed to corroborate significance in the variant rs17989853. A statistically significant association was considered when the value of p was < 0.05. For statistical analysis, the SPSS v20.0 and STATA SE v10.0 programs were used.
Results
In this study we included 148 patients with solid tumors, who attended a third reference hospital, 81 (54.8%) males and 67 (45.2%) females; the median age was 9 years (Q25 3–Q75 13). The most frequent solid tumors were those of the CNS (n = 44; 29.7%), followed by the sarcomas (n = 30; 20.2%) and thirdly the retinoblastomas (n = 25; 16.8%). The less frequent ones were germinal tumor (n = 19; 12.8%), Ewing sarcoma (n = 15; 10.1%), osteosarcomas (n = 8; 6.2%), Wilms tumor (n = 4; 2.7%), and hepatoblastomas (n = 3; 2.02%). Regarding chemotherapy schemes, the most frequently used were the ICE scheme (ifosfamide, carboplatin, etoposide) (n = 91; 61.5%), VDCIE (vincristine, doxorubicin, carboplatin, ifosfamide, etoposide) (n = 12; 8.1%), ID (ifosfamide, doxorubicin) (n = 7; 4.7%) and the less frequent schemes with ifosfamide (n = 38; 25.7%).
Gene frequencies
Distribution of CYP450 alleles was analyzed in 148 patients. The frequencies of the genotypes in CYP2B6 (rs8192709) were 86% (CC), 14% (CT) and 0% (TT). Regarding allelic frequencies, they were: C allele 0.93 and T allele 0.07. For the rs3211371 variant, the genotype frequencies were 94% (CC), 4% (CT) and 2% (TT); allelic frequency for the C allele was 0.95 and for the T allele 0.05. The last variant studied in this gene was rs3745274; the genotypes frequencies were 42% (GG), 44% (GT) and 14% (TT): allelic frequencies were G allele 0.64 and T allele 0.36.
For the CYP2C9 gene, 2 allelic variants, rs1799853 and rs1057910, were analyzed; the genotype frequencies were 89% (CC), 10.4% (CT) and 0.6% (TT). The allelic frequencies of the alleles found were for C allele (0.94) and for T allele (0.06). For the rs1057910 variant the genotype frequencies were 96% (AA), 10.4% (AC) and 0.6% (CC). The allele frequencies found were 0.98 for the A allele and 0.02 for the C allele. Finally, we studied rs2740574 variants of the CYP3A4 gene; the genotype frequencies were 82% (TT), 15% (TC) and 3% (CC). The allele frequencies found were 0.90 for the T allele and 0.1 for the C allele. The genotyping results for CYP3A5 gene variants rs776746 were 60% (CC), 36% (CT) and 4% (TT). The allele frequencies found were 0.77 for the C allele and 0.23 for the T allele.
Effect of polymorphisms in the CYP2C9 and CYP3A4 genes on the levels of ifosfamide in dried blood drop
The median ifosfamide level in blood at 12 h was 18.2 μmol/l (Q25 10.6–Q75 28.0) and 1.9 μmol/l at 24 h (Q25 0.84–Q75 5.3), p < 0.001.
Ifosfamide levels increased according to the genotype; patients with the variant rs1799853 in CYP2C9 genotype CC had lower levels of ifosfamide (median = 1.8 μmol/l, Q25 0.9–Q75 4.6) compared with patients with genotype TT + CT (median = 2.8 μmol/l, Q25 1.9–Q755.1), p < 0.001 (Table I).
Table I
Ifosfamide concentration levels according to CYP450 genotype
| Genotype | N (%) | Ifosfamide at 12 h Median (Q25–Q75) | P-value | Ifosfamide at 24 h Median (Q25–Q75) | P-value |
|---|---|---|---|---|---|
| CYP2B6 rs8192709: | |||||
| T/T + C/T | 13 (14) | 18.4 (10.9–26.0) | 0.3 | 3.30 (1.3–5.9) | 0.5 |
| C/C | 80 (86) | 16.0 (14.2–31.0) | 1.9 (0.9–4.2) | ||
| rs3211371: | |||||
| T/T + C/T | 11 (11.9) | 26.5 (15.4–34.2) | 0.2 | 3.3 (1.2–9.8) | 0.5 |
| C/C | 82 (88.1) | 17.7 (11.5–25.4) | 1.9 (0.9–4.3) | ||
| rs3745274: | |||||
| T/T + G/T | 56 (60.2) | 18.8 (13.1–27.5) | 0.2 | 1.9 (1.0–4.3) | 0.6 |
| G/G | 37 (39.8) | 18.2 (8.2–25.9) | 2.0 (0.7–6.0) | ||
| CYP2C9 rs1799853: | |||||
| T/T + C/T | 8 (8.6) | 21.7 (12.3–34.1) | 0.4 | 2.8 (1.9-5.1) | 0.02*¥ |
| C/C | 85 (91.4) | 18.3 (11.7–25.8) | 1.8 (0.9-4.6) | ||
| rs1057910: | |||||
| C/C + A/C | 3 (3.3) | 26.3 (15.3–26.3) | 0.8 | 1.5 (1.1–3.4) | 0.9 |
| A/A | 90 (96.7) | 18.2 (11.8–26.3) | 2.0 (1.0–4.5) | ||
| CYP3A5 rs776746: | |||||
| T/T + T/C | 35 (37.7) | 16.0 (11.85–26.45) | 0.9 | 1.9 (0.82–3.7) | 0.3 |
| C/C | 58 (62.3) | 19.6 (11.4–26.8) | 2.50 (1.04–5.3) | ||
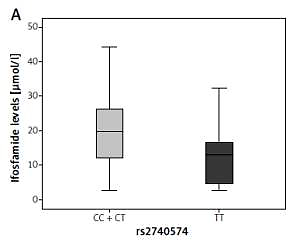
For the CYP3A4 gene rs2740574 variant, the concentration found in patients with normal genotype (T/T) at 12 h was median = 13.0 (Q25 4.1–Q75 17.2), p = 0.1 (Figure 1 A).
Figure 1
Graph showing comparison between medians for blood ifosfamide levels obtained from DBS according to the genotype in the CYP3A4 gene (rs2740574). A – At 12 h, p = 0.1, B – 24 h after the last infusion, p = 0.024. The p-value was calculated by the nonparametric Mann-Whitney U test
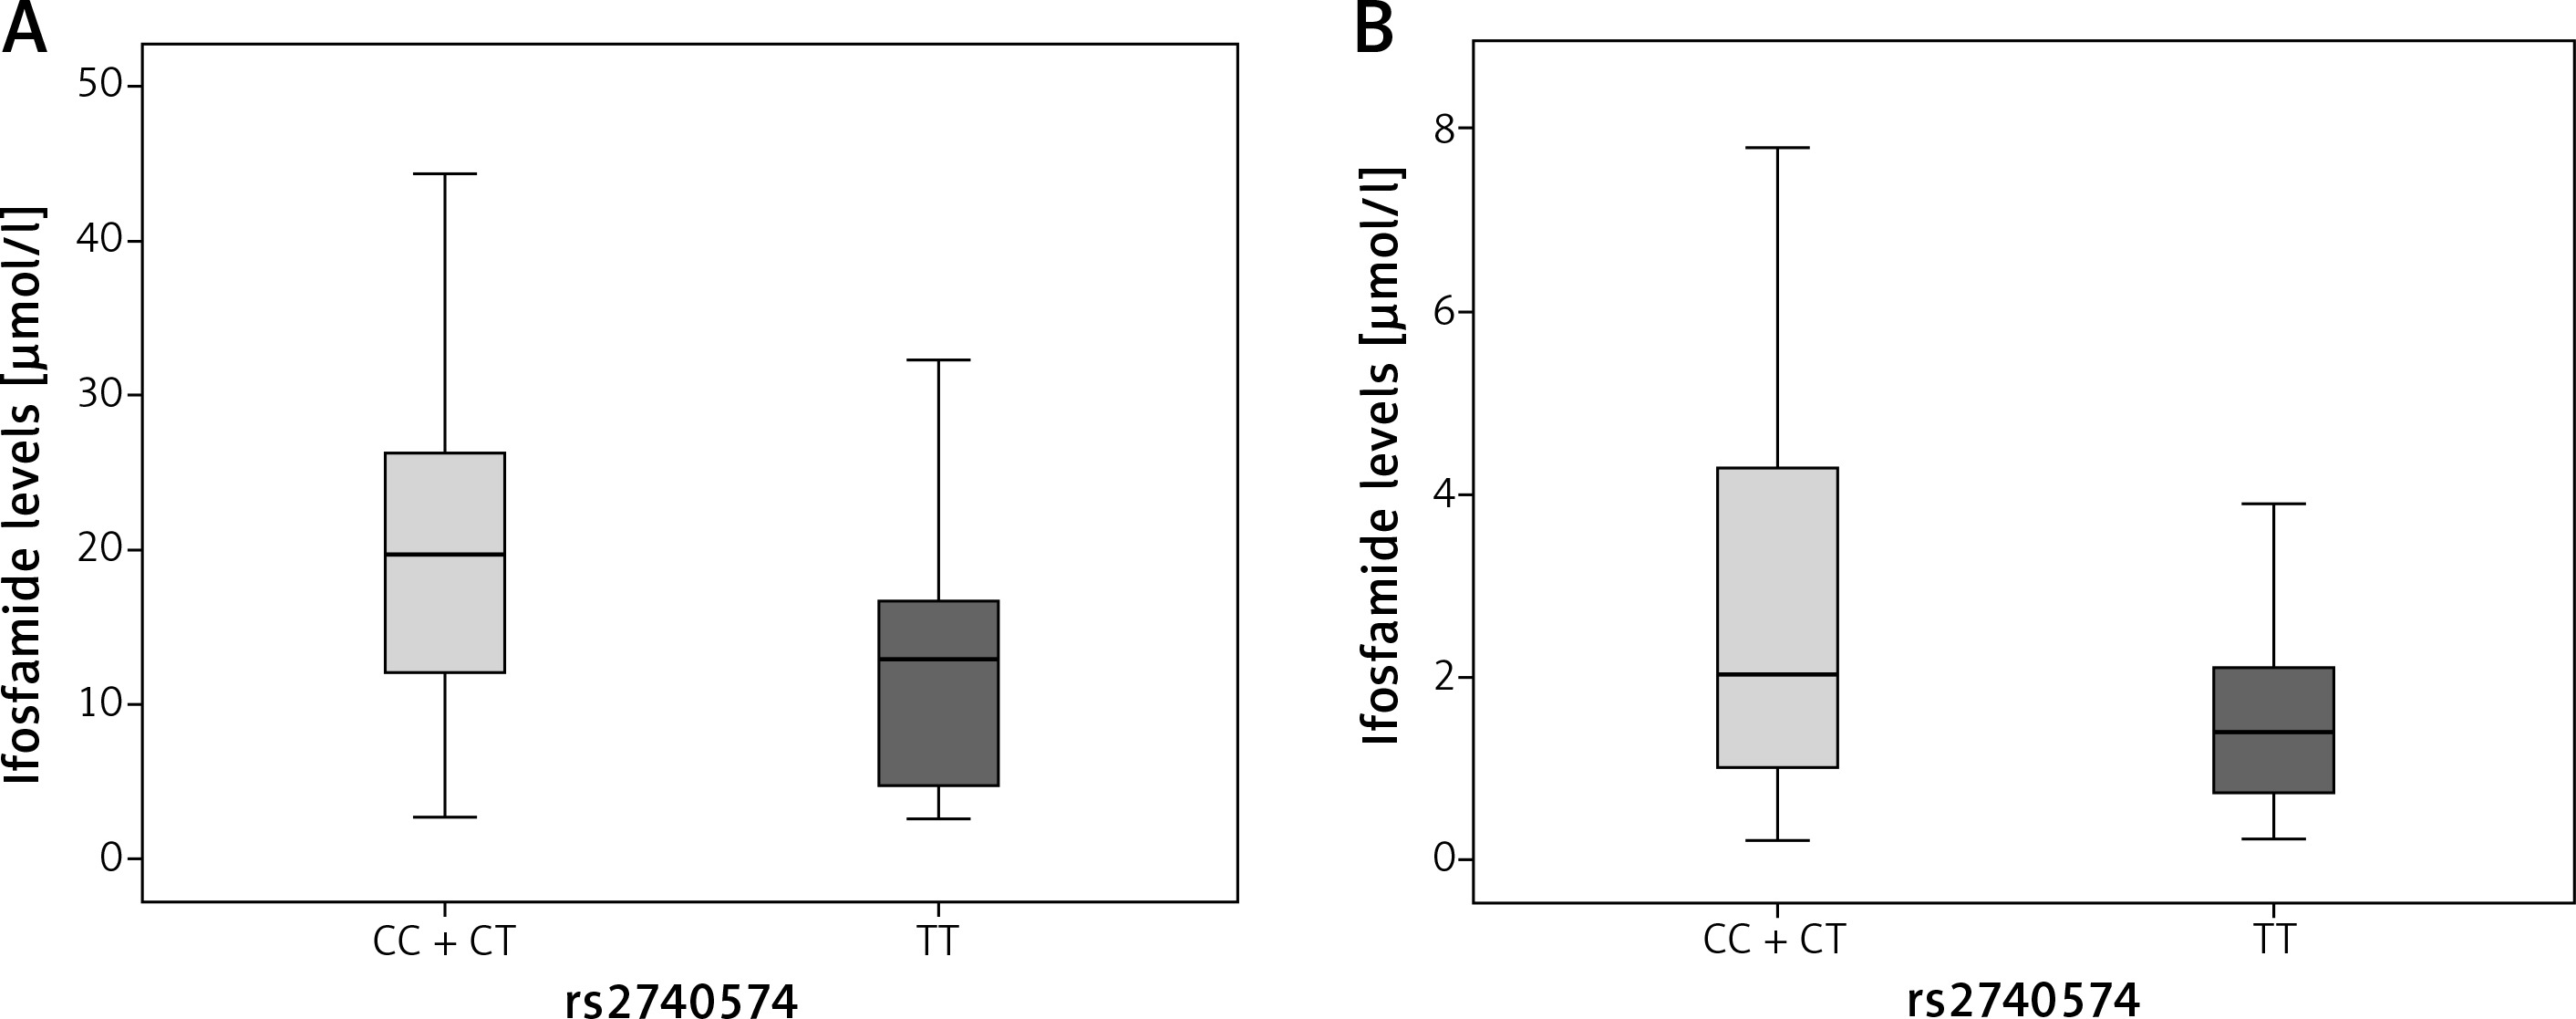
On the other hand, patients in the dominant model with CC + TC genotype presented a median = 19.7 (Q25 12.0–Q75 26.3); while at 24 h the patients with normal genotype had a median = 1.4 μmol/l (Q25 0.7– Q75 2.7), and patients in the dominant model with CC + TC genotype had higher levels of ifosfamide (median = 2.0 μmol/l, Q25 1.0–Q75 4.3), p = 0.024 (Figure 1 B).
For CYP2B6 and CYP3A5 genes variants, there was no statistically significant difference in relation to the levels of ifosfamide at 12 and 24 h (Table I).
Effect of allelic variants on CYP450 in treatment response
The genotype of all patients and their response at the end of the treatment with ifosfamide was evaluated according to RECIST criteria. For patients with CC + TC genotype with CYP3A4*1B gene rs2740574 variant, it was associated with an increased risk of non-response to treatment compared to patients with TT genotype (normal) (RR = 1.3, 95% CI: 1.07–1.59, p = 0.03). However, in the comparison of genotypes and response to treatment in the other allelic variants of CYP2B6, CYP2C9, and CYP3A5 there was no statistically significant genotype dependent difference in patients who did not achieve a response to ifosfamide (Table II).
Table II
Genotype and treatment response according to CYP450 genes
| Genotype | N = 131 | Responder | Non-responder | P-value* | RR | 95% CI |
|---|---|---|---|---|---|---|
| CYP2B6 rs8192709: | ||||||
| T/T + C/T | 20 | 4 | 16 | 0.3 | 1.15 | 0.89–1.48 |
| C/C | 111 | 34 | 77 | |||
| rs3211371: | ||||||
| T/T + C/T | 38 | 3 | 35 | 0.7 | 1.0 | 0.75–1.50 |
| C/C | 93 | 9 | 84 | |||
| rs3745274: | ||||||
| T/T + G/T | 80 | 22 | 58 | 0.4 | 1.11 | 0.81–1.37 |
| G/G | 51 | 17 | 34 | |||
| CYP2C9 rs1799853: | ||||||
| T/T + C/T | 13 | 4 | 9 | 0.8 | 0.96 | 0.65–1.40 |
| C/C | 118 | 33 | 85 | |||
| rs1057910: | ||||||
| C/C + A/C | 38 | 1 | 37 | 0.8 | 1.05 | 0.59–1.88 |
| A/A | 93 | 3 | 90 | |||
| CYP3A4 rs2740574: | ||||||
| C/C + T/C | 25 | 3 | 22 | 0.03 | 1.3 | 1.07–1.59 |
| T/T | 106 | 35 | 71 | |||
| CYP3A5 rs776746: | ||||||
| T/T + T/C | 48 | 15 | 33 | 0.6 | 0.95 | 0.75–1.20 |
| C/C | 83 | 23 | 60 | |||
Discussion
We studied genetic polymorphisms in CYP450: CYP2B6*2, CYP2B6*5, CYP2B6*6, CYP2C9*2, CYP2C9*3, CYP3A4*1B and CYP3A5*3 in pediatric patients with solid embryonal tumors treated with ifosfamide. The polymorphisms in these genes showed low allelic frequencies similar to those reported in databases such as NCBI. The most important finding in this study suggests that two of these polymorphisms (rs1799853 and rs2740574) affect IFA levels. Additionally, a poor therapeutic effect was observed for patients with the mutant allele for the rs2740574 variant. In this study, the findings are similar to those that have been described for other drugs such as dihydropyridines, cyclosporine and midazolam but it is the first association for ifosfamide.
Hoyo-Vadillo et al., Castañeda and Flores-Murrieta et al. reported that patients with rs2740574 variant (CYP3A4*1B) are poor metabolizers of dihydropyridines [15], cyclosporine [16] and sildenafil [17], which are substrates of this gene. However, high bioavailability of drugs such as midazolam has been reported in healthy Mexican volunteers compared to Caucasians, probably due to clearance reduction secondary to altered biotransformation by CYP3A4 [18]. Of note, the localization of the polymorphism is within the regulatory region (-392 T>C) and therefore it is expected that it will affect ligand binding regardless of the amount of protein synthesized by the liver. It is suggested that a decrease in drug clearance would cause ifosfamide to remain longer circulating in the body and not in its site of action, being able to cause a higher risk of adverse events such as toxicity and a lower rate of therapeutic response.
In conclusion, we found that the polymorphisms in CYP2C9 and CYP3A4 genes are associated with higher ifosfamide blood levels; the rs2740574 variant was associated with higher IFA blood levels and also with worse therapeutic response in Mexican patients with solid tumors. Finally, this study suggests the need to study this gene in pediatric cancer patients requiring the use of ifosfamide as treatment scheme before its application. In future research, ifosfamide metabolite levels and its interactions with the enzyme should be analyzed for a clearer understanding about the association with a poor therapeutic response in patients treated with this antineoplastic drug.