Introduction
Cardiovascular disease (CVD) and neoplasms are the two leading causes of mortality and disability globally, together accounting for over 50% of all deaths worldwide [1]. These conditions present serious health hazards and impose a substantial healthcare burden, particularly in low-income and middle-income countries. Without effective interventions, the global burden owing to these two conditions is projected to continue rising.
The global distribution and evolution of CVD and neoplasms can be understood through the framework of epidemiological transition theory, originally proposed by Omran and subsequently refined to encompass non-communicable diseases [2]. This theory describes the systematic shift in disease patterns as populations undergo socioeconomic development, transitioning from infectious disease predominance to chronic disease predominance [3]. Within this framework, researchers have documented distinct phases of “cardiovascular revolution” and “cancer transition”, wherein different populations experience varying stages of CVD decline and cancer burden increase [4, 5]. These concepts suggest that the relative burden of CVD versus cancer may serve as indicators of epidemiological development stage, with important implications for resource allocation and intervention strategies.
Substantial evidence suggests that CVD and neoplasms share common risk factors and underlying mechanisms [6–8]. Metabolic syndrome components, including hypertension, diabetes, dyslipidemia, and obesity, influence both conditions [9]. Environmental factors (such as air pollution and occupational exposures), dietary factors (including high sodium intake, low fruit and vegetable consumption, and trans-fat consumption), and behavioral factors (particularly tobacco use and physical inactivity) also contribute substantially to the development of these two disease categories [10]. Moreover, cardiovascular complications represent a leading cause of morbidity and mortality among cancer patients, while individuals with CVD face elevated cancer risk through shared pathophysiological pathways [11, 12]. Considering that most of the disease burden stems from modifiable risk factors, research on these factors is of paramount importance for preventing both diseases and reducing their global impact.
Previous research has made substantial contributions to understanding CVD and cancer burden globally. Large-scale analyses using disability-adjusted life years (DALYs) have comprehensively characterized the global burden of cardiovascular diseases and cancer independently, documenting temporal trends and regional variations [13, 14]. Recent studies have also begun applying machine learning approaches to predict disease burden and identify high-risk populations. Furthermore, the concepts of cardiovascular revolution and cancer transition have been well established in epidemiological literature, describing how different populations progress through predictable stages of disease burden evolution [15].
However, several critical research gaps remain. First, while individual disease burdens have been thoroughly characterized, systematic analysis of the co-occurrence patterns of CVD and neoplasms at a global scale remains limited, particularly in identifying distinct epidemiological profiles that combine both disease categories. Second, although machine learning has been applied to disease burden prediction, integration of machine learning interpretability methods (such as SHAP values) with traditional population attributable fraction approaches to distinguish intervention priorities has not been systematically explored. Third, existing analyses of temporal trends have focused on single diseases, and comprehensive characterization of divergent trajectories in CVD-cancer co-occurrence patterns across different development stages, and their implications for widening health inequalities, remains incomplete. These gaps are especially important for low-income and middle-income countries, where the burden of non-communicable diseases is already disproportionately high and continues to increase.
Furthermore, temporal trends in disease burden reveal concerning patterns of divergence across global populations. While high-income countries have achieved substantial reductions in age-standardized CVD burden through comprehensive prevention programs, many low-income and middle-income countries are experiencing an increasing burden from both CVD and cancer simultaneously [14, 16, 17]. Understanding these divergent trajectories and their underlying determinants is essential for identifying populations requiring urgent intervention and for allocating limited resources effectively. Traditional population attributable fraction approaches identify risk factors contributing to overall disease burden, but emerging machine learning methods offer complementary insights for individual-level risk stratification [18, 19]. Integrating these analytical frameworks could enable more sophisticated intervention targeting, optimizing both population-level policies and clinical strategies.
Building upon epidemiological transition theory and addressing the identified research gaps, we hypothesized that: (1) global populations exhibit distinct co-occurrence patterns of CVD and neoplasms that correspond to different stages of epidemiological transition; (2) these patterns are associated with specific combinations of modifiable risk factor exposures; and (3) temporal evolution of these patterns reflects widening health inequalities between populations at different development stages.
The objective of this study was to investigate the co-occurrence of CVD and neoplasms from both spatial and temporal perspectives, using data from the Global Burden of Disease, Injuries, and Risk Factors Study (GBD) 2021 database spanning 1990 to 2021. Through systematic exploration, we aimed to: (1) identify and characterize distinct global co-occurrence patterns of CVD and neoplasms; (2) quantify 32-year temporal trends in these patterns and assess the evolution of health inequalities; and (3) integrate population attributable fraction analysis with machine learning interpretability approaches (SHAP values) to distinguish population-level intervention priorities from individual-level risk stratification opportunities across different epidemiological contexts. Precisely characterizing these patterns and pinpointing risk factors at the country level can offer guidance and evidence-based support for tailored prevention and control strategies. The ultimate goal is to reduce the burden of CVD and neoplasms and alleviate the widening global health inequalities.
Material and methods
Data source
The data used in this study were extracted from the Global Burden of Disease Study 2021 (GBD 2021) (GHDx: https://vizhub.healthdata.org/gbd-results/). GBD 2021 provides a comprehensive assessment of the burden attributable to 371 diseases and 88 risk factors across global, regional, and national levels from 1990 to 2021 [20]. This investigation examines global co-occurrence patterns and spatial distributions of age-standardized DALY rates for CVD and neoplasms, alongside their attributable risk factor burdens. Age-standardized rates were calculated using the direct method with the GBD 2021 world standard population as the reference, which removes the confounding effect of population age distribution and enables valid comparisons across populations with different age structures [21]. Advanced statistical modeling and machine learning techniques – including age-specific age-standardized rate calculations and SHapley Additive exPlanations (SHAP) analysis – were employed to identify critical risk factors and quantify their contributions to disease burden. The study adheres to the Guidelines for Accurate and Transparent Health Estimates Reporting (GATHER). Ethical approval, including a waiver of informed consent due to the use of de-identified data, was granted by the Institutional Review Board at the University of Washington (https://www.healthdata.org/research-analysis/gbd).
Disease definitions
CVD was defined as 12 distinct subtypes, namely rheumatic heart disease, ischemic heart disease, stroke, hypertensive heart disease, non-rheumatic valvular heart disease, cardiomyopathy and myocarditis, pulmonary arterial hypertension, atrial fibrillation and flutter, aortic aneurysm, lower extremity peripheral arterial disease, endocarditis, and other cardiovascular and circulatory disorders. For standardized criteria defining these CVD conditions, detailed guidelines are available in a recently published comprehensive review article [22]. Neoplasms include 37 subtypes. Their detailed codes in the Tenth Revision of the International Classification of Diseases (ICD-10) are listed and can be viewed on the following website: (https://ghdx.healthdata.org/record/ihme-data/gbd-2021-cause-icd-code-mappings).
Disease burden as quantified using years lived with disability (YLDs), years of life lost (YLLs), and DALYs. LDs were calculated as prevalence multiplied by condition-specific disability weights (ranging from 0 [perfect health] to 1 [equivalent to death]), with microsimulation adjustment for comorbidity effects. YLLs were estimated by multiplying mortality counts by the standard life expectancy at the age of death. DALYs were computed as the sum of YLLs and YLDs, representing the total disease burden in a population, with YLDs capturing health loss from non-fatal conditions.
Calculation of DALYs
DALYs represent a comprehensive metric quantifying total disease burden by combining mortality and morbidity into a single measure [22]. The fundamental principle underlying DALY calculation is to estimate the sum of years of life lost due to premature mortality and years lived with disability. Specifically, DALYs are computed using the following formula: DALY = YLL + YLD.
Definition of comorbidity patterns and regional stratification for CVD and neoplasms
To examine the global co-occurrence characteristics and spatial heterogeneity of CVD and neoplasms, countries were stratified into four categories based on median percentiles of age-standardized DALY rates: low-burden regions, neoplasm-dominant regions, CVD-dominant regions, and dual-burden regions. Classification criteria were defined as follows: A country was categorized as a low-burden region if both its CVD and neoplasm age-standardized DALY rates fell below the 50th percentile globally. Neoplasm-dominant regions comprised units where neoplasm DALY rates exceeded the 50th percentile, whereas CVD rates were below this threshold. CVD-dominant regions included units with CVD DALY rates above the 50th percentile but neoplasm rates below it. Units exhibiting both CVD and neoplasm DALY rates above the 50th percentile were designated dual-burden regions. This stratification framework delineates four distinct geographic patterns of disease predominance, enabling systematic analysis of spatial disparities in comorbid burden.
Risk factor selection
This study extracted age-standardized DALY rates for CVD and neoplasms across 204 countries and territories in 2021, alongside exposure metrics for all 88 most granular risk factors encompassing environmental, occupational, and behavioral domains [23, 24]. We identified 27 risk factor subcategories associated with CVD and 34 subcategories linked to neoplasms. To evaluate variable importance, we implemented SHapley Additive exPlanations (SHAP) analysis within an XGBoost framework – a gradient-boosted tree-based ensemble machine learning algorithm. This approach quantified the differential contributions of individual risk factors to predictive outcomes, establishing a rigorous variable selection framework [25].
SHapley Additive exPlanations (SHAP) analysis
SHAP is a unified framework for interpreting machine learning model predictions based on cooperative game theory. The methodology derives from Shapley values, originally developed in game theory to fairly distribute payoffs among players based on their contributions. In the context of machine learning, SHAP values quantify each feature’s contribution to the prediction for individual observations [26]. The fundamental principle of SHAP is to compute the marginal contribution of each feature by considering all possible combinations of features. To distinguish risk factor profiles across four disease burden regions, this study adopted a pairwise comparison framework in the XGBoost algorithm: instead of a single multi-class model, six binary XGBoost classifiers were constructed (each discriminating between two specific regions), with input features as age-standardized exposure levels of relevant risk factors [27]. SHAP analysis was performed on each binary model: the mean absolute SHAP value of each feature reflects its overall importance in distinguishing the two regions, while the sign of SHAP values indicates the impact direction. Finally, a ranked list of critical risk factors was generated for each regional contrast.
Relative risk (RR) estimation
GBD 2021 generated spatiotemporally comparable relative risk (RR) estimates by systematically integrating RR data from randomized controlled trials, cohort studies, and case-control studies through evidence synthesis. This methodology incorporated multi-source exposure data – including demographic and health surveys, censuses, ground-based and remote sensing monitoring systems, and administrative records – to construct comprehensive risk exposure assessment models. Spatiotemporal Gaussian process regression was subsequently applied to characterize exposure level distributions across geographic units and time periods, yielding rigorously standardized RR metrics [28].
Theoretical minimum risk exposure level (TMREL)
The theoretical minimum risk exposure level (TMREL) represents the counterfactual exposure distribution at which population health risk is minimized. Detailed specifications of low-risk exposure thresholds are provided in the website (https://ghdx.healthdata.org/record/ihme-data/gbd-2021-burden-by-risk-1990-2021).
Population attributable fraction (PAF)
The population attributable fraction (PAF) is defined as the proportion of disease burden that could be reduced if exposure to a specific risk factor were lowered to the TMREL. For each risk factor, PAF was computed using the continuous exposure formula:
where l denotes the minimum exposure level, m represents the maximum exposure level, RR(x) indicates the relative risk at exposure level x, TMREL signifies the counterfactual exposure distribution, and P(x) describes the current population exposure distribution. All variables were calculated with covariates stratified by age, sex, geographical location, and year. Attributable DALYs were estimated by multiplying the total DALYs for a specific outcome by its corresponding PAF, quantifying each risk factor’s proportional contribution to disease burden.Socio-demographic index (SDI)
The socio-demographic index (SDI) is a composite metric of development status (integrating fertility rates, educational attainment, and income per capita) that correlates with population health outcomes. SDI values range from 0 to 1, representing a theoretical development continuum relevant to health [5].
Statistical analysis
Age-standardized rates for populations were computed using the formula:
where αi denotes the age-specific rate in age group i, Wi represents the corresponding proportion of the GBD 2021 standard population, and N is the total number of age groups. Rates were standardized to the GBD world standard population using the ageadjust. direct function from R’s epitools package. All GBD burden estimates report 95% uncertainty intervals (UIs) encompassing the true value with 95% probability, accounting for sampling variance, model uncertainty, and data quality limitations. AAPC in disease burden were quantified through joinpoint regression analysis. Machine learning implementation utilized R’s xgboost and shapviz packages for XGBoost modeling and SHAP value computation, respectively.Results
Four distinct global patterns of CVD and neoplasm co-occurrence
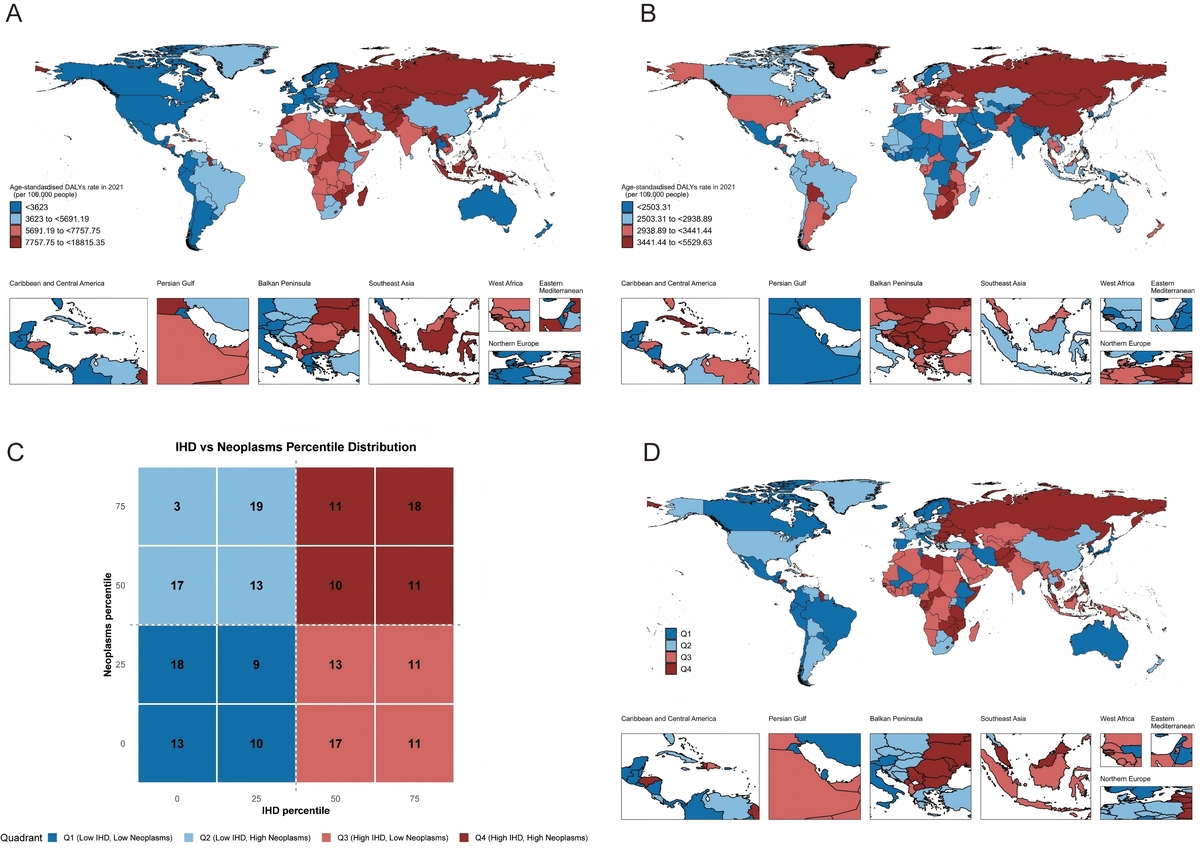
This analysis of 204 countries and territories from 1990 to 2021 revealed four distinct epidemiological patterns defined by the co-occurrence of CVD and neoplasm burden (Figure 1). This classification represents the first global framework integrating these two leading causes of mortality and provides critical insights into differential stages of epidemiological transition worldwide.
Figure 1
Global distribution maps showing the age-standardized disability-adjusted life year rate for CVD (A) and neoplasms (B) in 2021 As well as characteristics (C) of the co-occurrence of CVD and neoplasms (D) in 2021
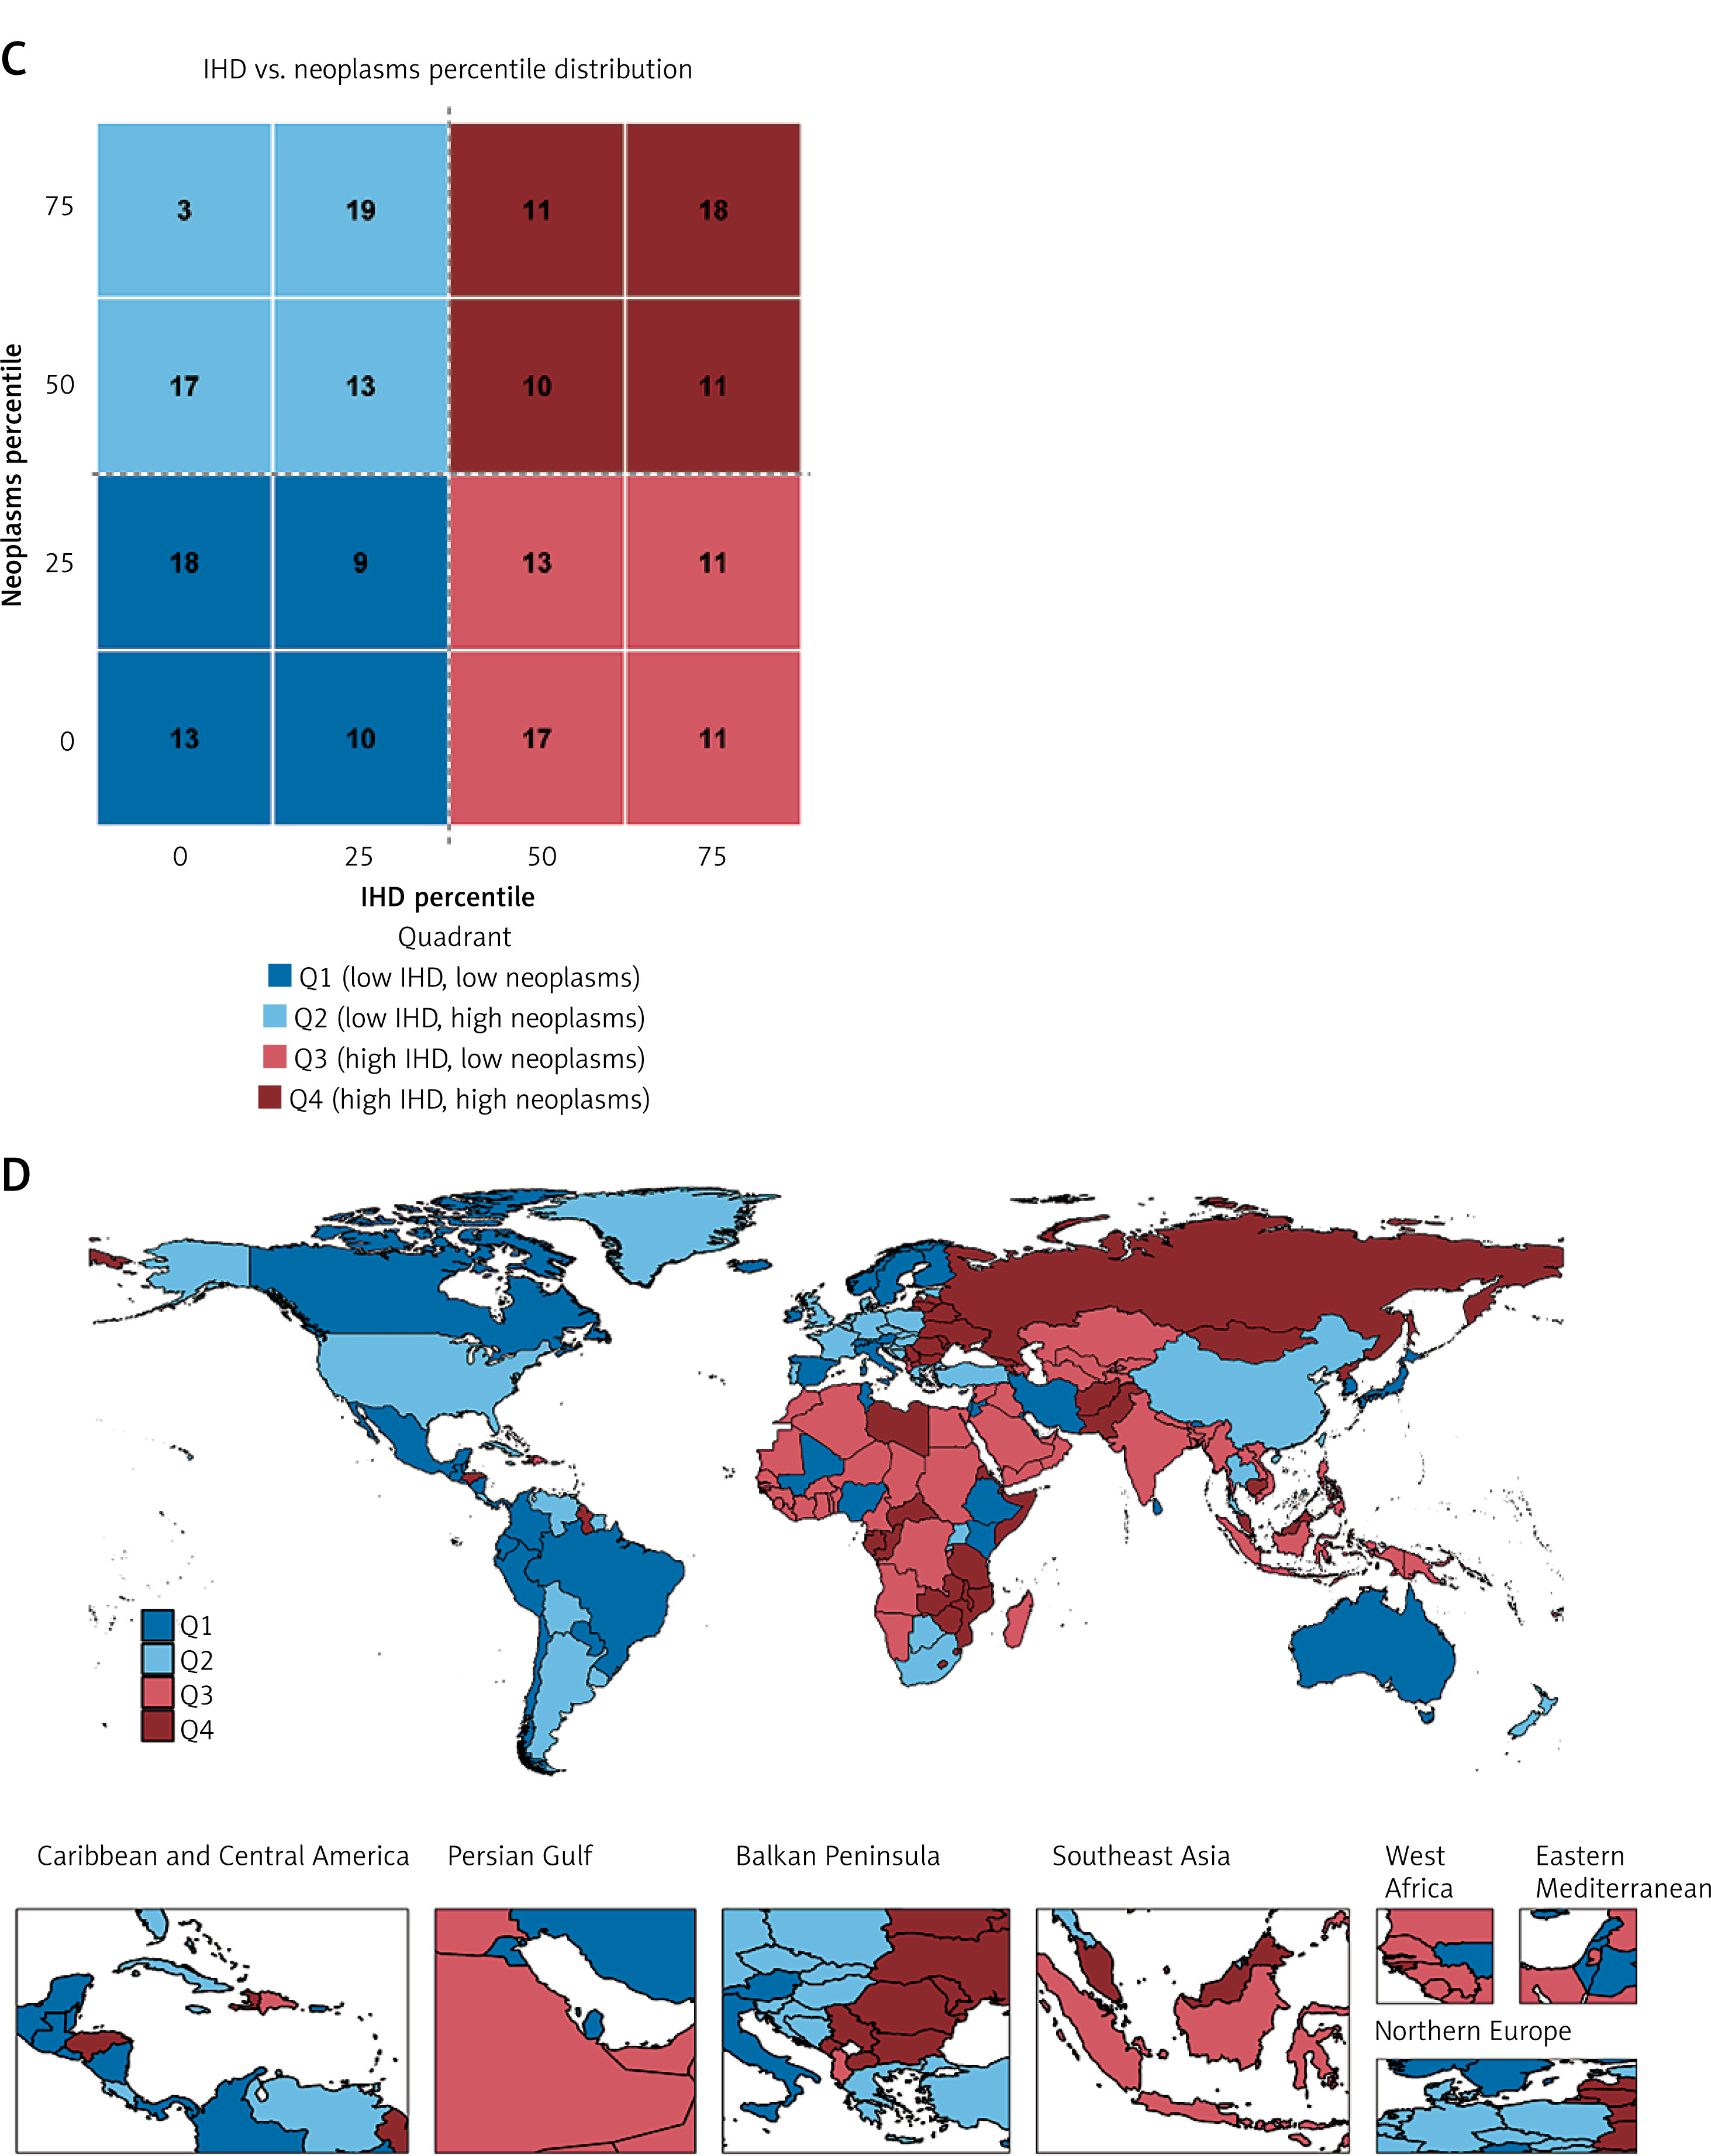
Pattern 1 (low-burden regions, 52 countries, 25.49%) comprised predominantly high-income countries that have achieved successful control of both disease categories through comprehensive prevention and treatment systems. Switzerland exemplified this pattern with a CVD burden of 1,467 per 100,000 and neoplasm burden of 2,290, alongside Japan (CVD 1,651, neoplasms 2,526) and Australia (CVD 1,804, neoplasms 2,738). These countries demonstrated that substantial disease burden reduction is achievable through sustained investment in health systems and risk factor control.
Pattern 2 (neoplasm-dominant regions, 50 countries, 24.51%) represented an advanced epidemiological transition stage where the neoplasm burden equaled or exceeded the CVD burden. Denmark demonstrated this transition, with the neoplasm burden (3,211 per 100,000) substantially exceeding the CVD burden (1,794), reflecting successful cardiovascular disease prevention, while cancer emerged as the predominant health challenge. Uruguay (neoplasms 4,475, CVD 3,178), Hungary (neoplasms 4,300, CVD 5,266), and Poland (neoplasms 4,077, CVD 4,101) similarly exemplified this pattern, concentrated in high-income Western nations and parts of Latin America. Pattern 3 (CVD-dominant regions, 50 countries, 24.51%) was characterized by a disproportionately high CVD burden relative to neoplasms. Egypt demonstrated extreme CVD predominance (12,208 per 100,000) compared to neoplasms (2,663), alongside India (CVD 6,151, neoplasms 2,016) and Kazakhstan (CVD 8,782, neoplasms 2,669). This pattern predominated across South Asia, North Africa, and parts of Latin America, reflecting inadequate CVD prevention infrastructure despite the ongoing epidemiological transition. Pattern 4 (dual-burden regions, 52 countries, 25.49%) faced the most challenging scenario, with an elevated burden from both disease categories simultaneously. Russia exemplified this double burden (CVD 8,262 per 100,000, neoplasms 3,509), representing populations experiencing the intersection of persistent traditional disease burdens and rising non-communicable disease rates. This pattern predominated across Eastern Europe, sub-Saharan Africa, and parts of Central Asia, highlighting regions requiring urgent attention and integrated disease control strategies.
Widening global inequality in disease control
Temporal trends from 1990 to 2021 revealed markedly divergent trajectories across epidemiological patterns, indicating growing global inequality in disease control capacity (Figure 2, Supplementary Tables SI–SVIII).
Figure 2
Average annual percentage change in age-standardized disability-adjusted life year rate for CVD (A–D) and neoplasms (E–F) across four characteristic regions from 1990 to 2021 Neoplasms (G–H) across four characteristic regions from 1990 to 2021
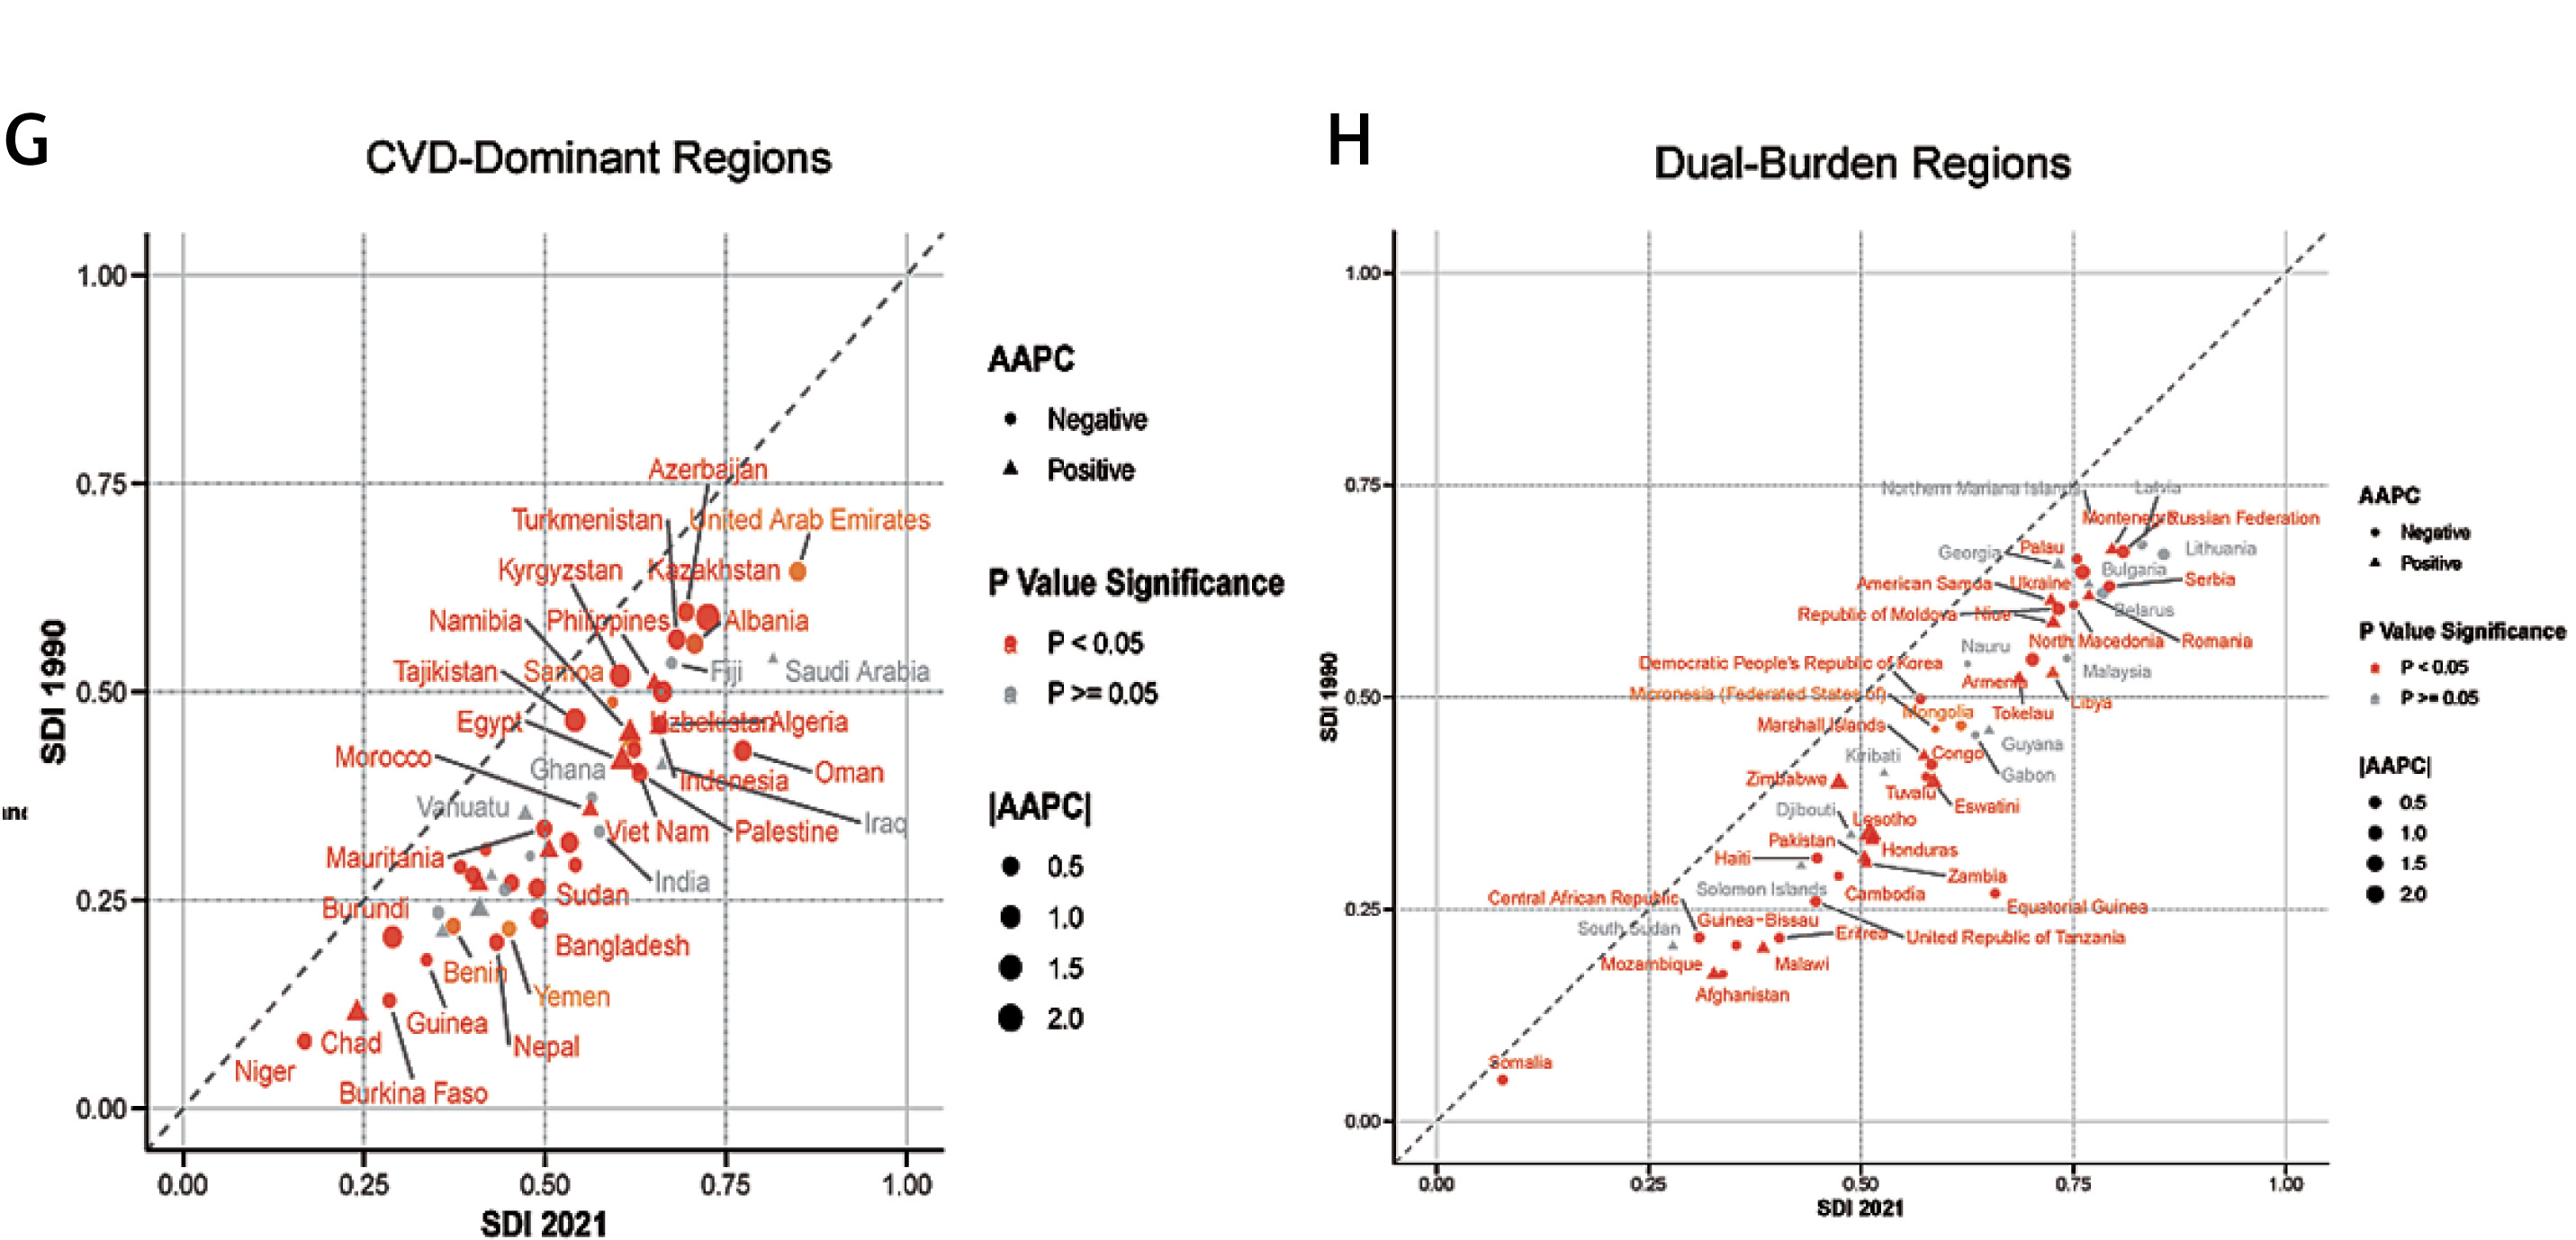
Pattern 1 regions achieved substantial CVD burden reductions with AAPC ranging from –2.0% to –4.3%, led by the Republic of Korea (AAPC = –4.3%), Singapore (–3.9%), and Ireland (–3.9%) (Figure 2 A, Supplementary Table SI). These declines reflected comprehensive prevention programs combining population-level policies (tobacco taxation, trans fat elimination, salt reduction) with widespread access to evidence-based clinical care (antihypertensives, statins, revascularization). Neoplasm burden also declined substantially, with the strongest progress in the Maldives (AAPC –2.3%), Singapore (–2.0%), and Ireland (–1.7%), though a few countries showed modest increases (Figure 2 E, Supplementary Table SV). The predominant downward trend reflected both advances in cancer prevention and early detection, alongside population aging that unmasked cancer as CVD mortality declined. Pattern 2 regions demonstrated moderate CVD burden reduction (AAPC –2.0% to –3.8%), with Denmark achieving the steepest decline (–3.8%) alongside Portugal (–3.8%) and Estonia (–3.3%) (Figure 2 B, Supplementary Table SII). Neoplasm burden showed more modest declines overall, with the strongest progress in Greenland (AAPC –1.8%) and Denmark (–1.2%) (Figure 2 F, Supplementary Table SVI). This pattern exemplified the epidemiological transition paradox: successful CVD control unmasks cancer as the predominant cause of premature mortality, requiring health system pivots toward cancer prevention, screening, and treatment infrastructure. Pattern 3 regions showed slower CVD burden reduction (AAPC –0.1% to –2.5%) with substantial heterogeneity reflecting variable health system capacity (Figure 2 C, Supplementary Table SIII). India demonstrated minimal progress (AAPC –0.6%), while Oman achieved more substantial improvement (–1.9%). Of concern, several Pattern 3 countries experienced increasing neoplasm burden, including Gambia (0.45%) and Indonesia (AAPC 0.25%), indicating that cancer control programs have failed to keep pace with population aging and rising cancer risk factor exposures during the ongoing epidemiological transition (Figure 2 G, Supplementary Table SVII). However, the majority of Pattern 3 countries achieved modest cancer burden reductions, demonstrating that progress is possible even in resource-limited settings. Pattern 4 regions exhibited the most heterogeneous and concerning trajectories, with CVD burden changes ranging from –2.0% to +1.5% (Figure 2 D, Supplementary Table SIV). Multiple countries experienced an increasing CVD burden despite global improvements, including Lesotho (AAPC +1.5%) and Zimbabwe (+1.3%), reflecting intersecting challenges of political instability, armed conflict, HIV/AIDS epidemic impacts on health system capacity, and inadequate resources for non-communicable disease prevention. Others achieved modest progress, with Lithuania showing the steepest decline (AAPC –2.0%). Neoplasm burden increased dramatically in multiple Pattern 4 countries, including Lesotho (AAPC +2.2%) and Zimbabwe (+1.2%), underscoring catastrophically inadequate cancer screening and treatment infrastructure in settings with overwhelming competing disease priorities (Figure 2 H, Supplementary Table SVIII). Nearly half of Pattern 4 countries (44%) experienced a rising cancer burden, representing a public health crisis requiring urgent international attention.
The divergence between Pattern 1 regions achieving 3–4% annual CVD burden reductions and Pattern 4 regions experiencing an increasing burden represents a growing global health crisis. This creates a 5.8 percentage point gap in AAPC between best (Pattern 1: –4.3%) and worst performers (Pattern 4: +1.5%), representing unprecedented inequality in global disease control. While technical solutions for both CVD and cancer prevention are well established and Pattern 1 countries demonstrate their feasibility, Pattern 4 populations face deteriorating conditions. This widening gap demands urgent global attention, resource redistribution, and solidarity to prevent further divergence that would represent an unconscionable moral failure.
High systolic blood pressure: the dominant CVD risk factor
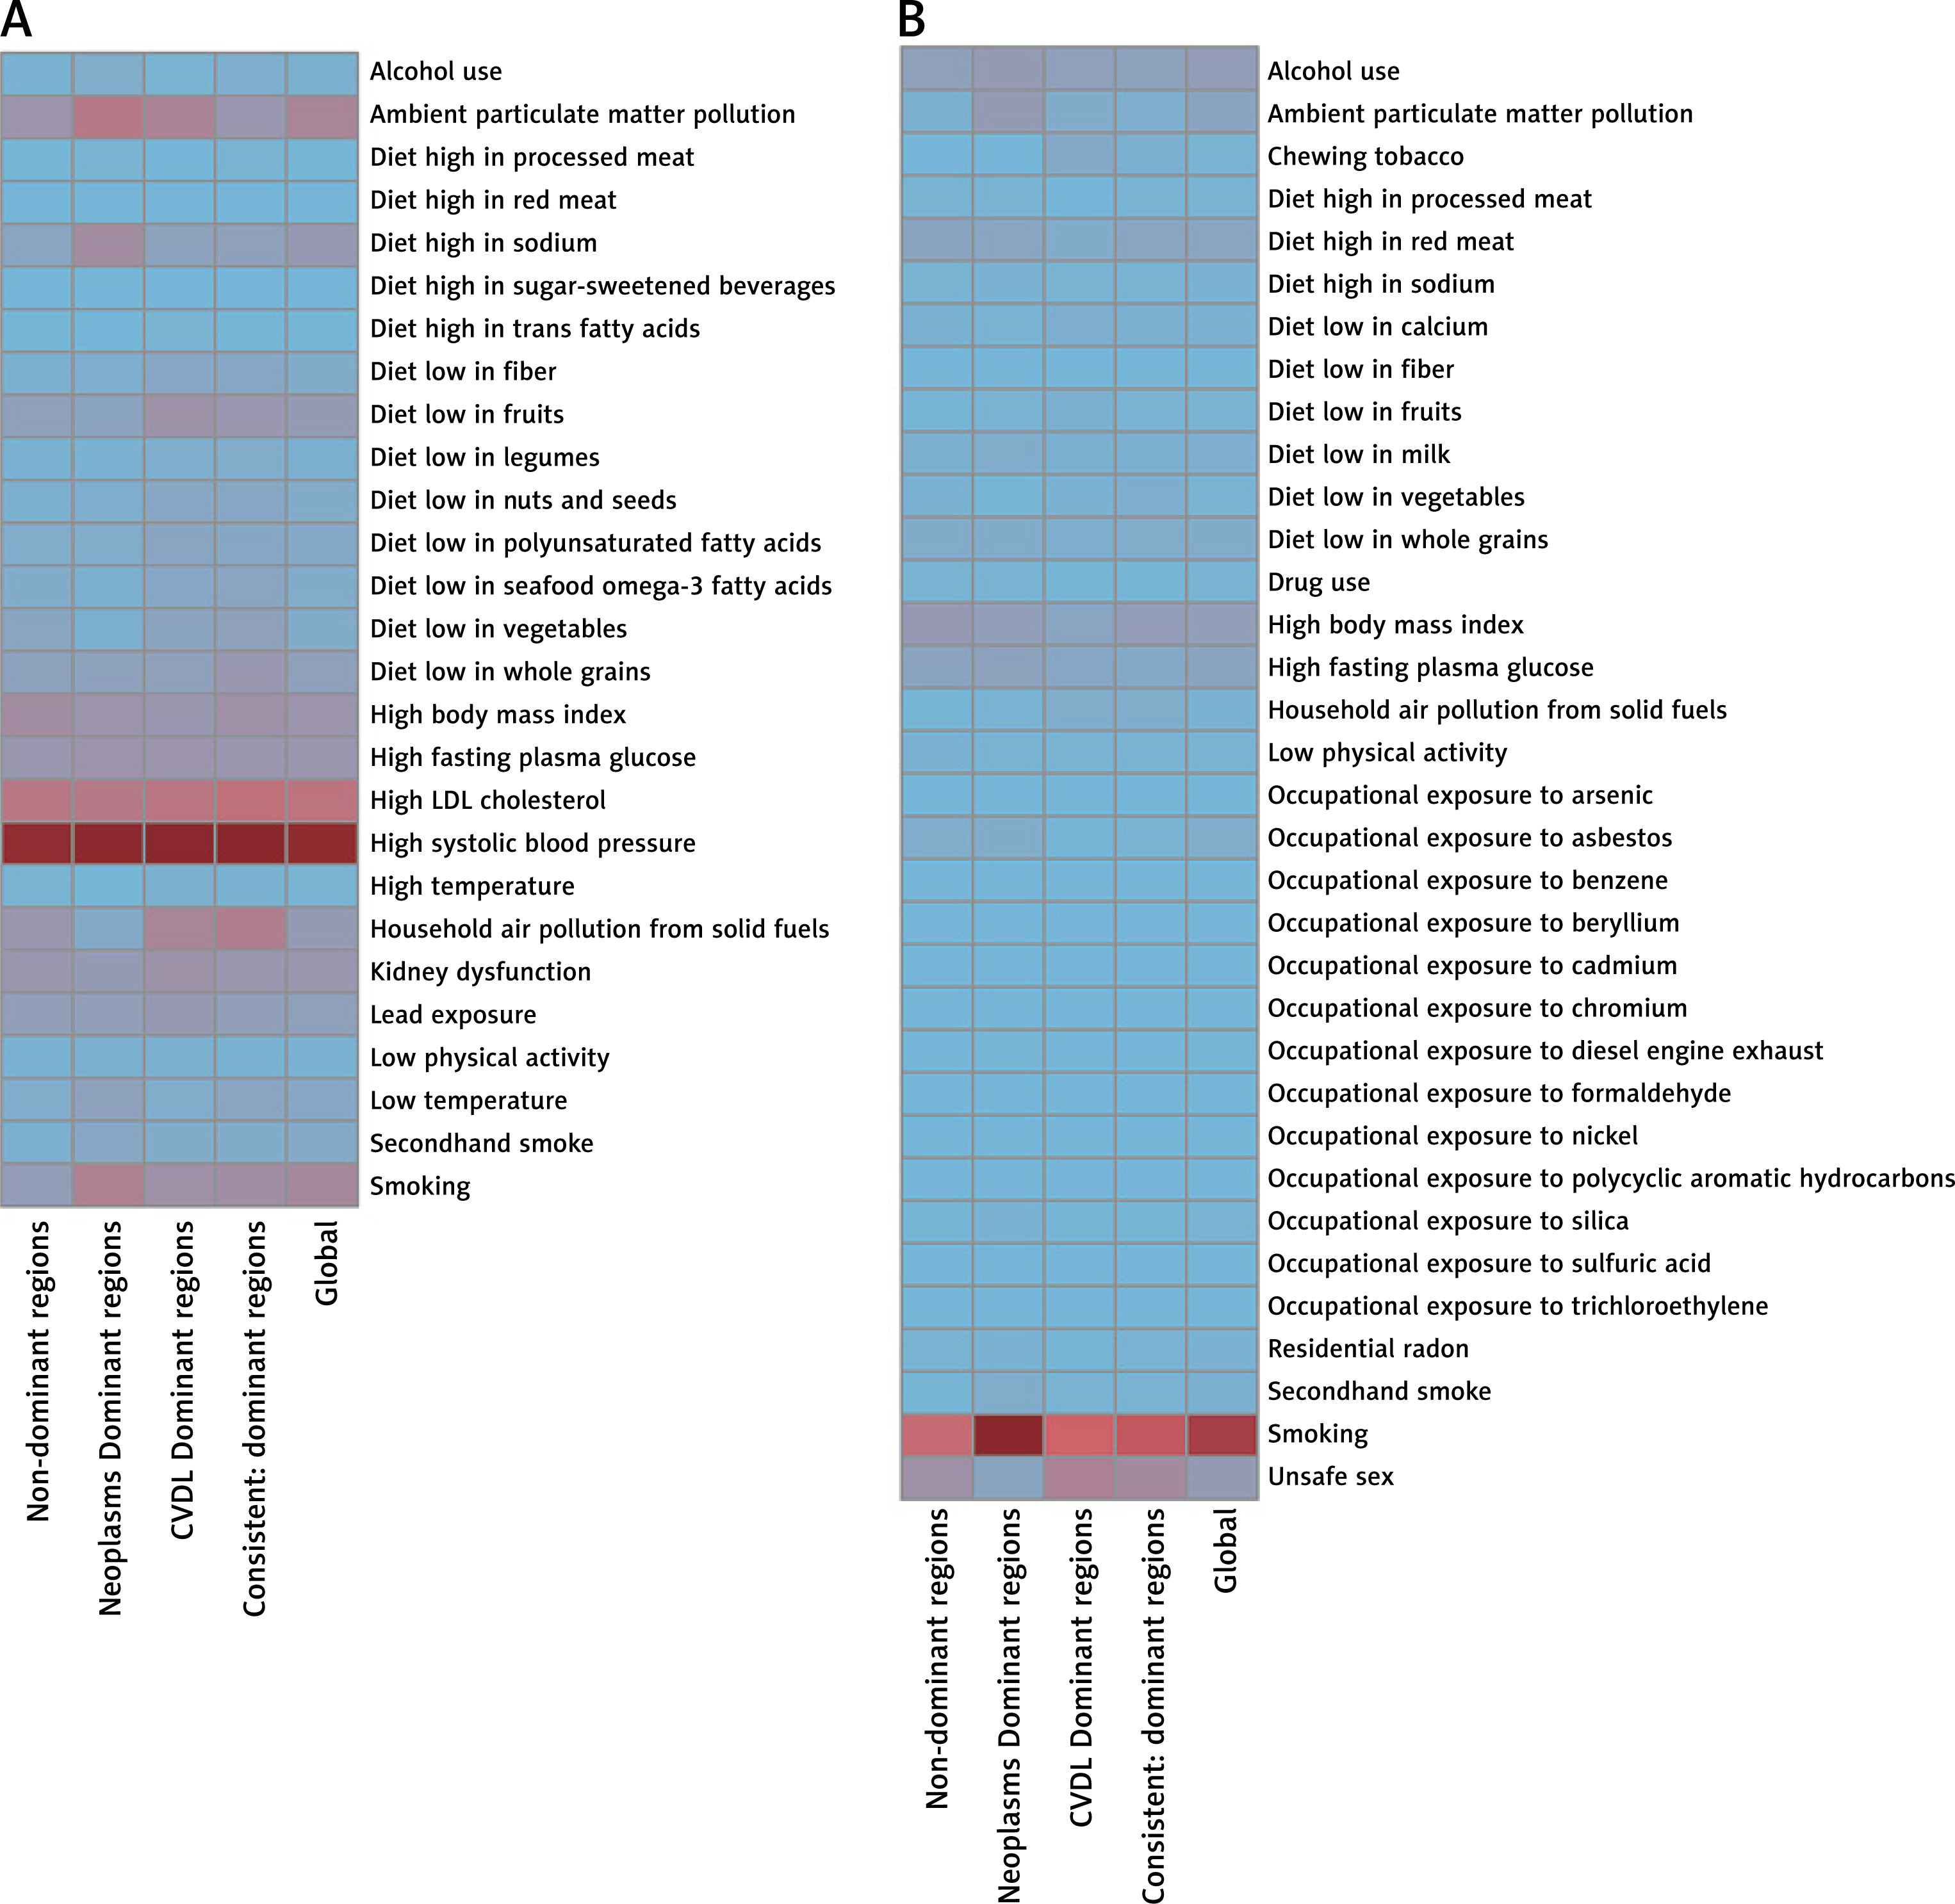
Population attributable fraction analysis identified high systolic blood pressure as the single largest modifiable risk factor for CVD globally, accounting for 49.7% of burden – substantially exceeding all other contributors (Table I, Figure 3 A). This finding remained remarkably consistent across all epidemiological patterns: 49.2% in Pattern 1, 51.0% in Pattern 2, 51.7% in Pattern 3, and 52.4% in Pattern 4. Combined with high LDL cholesterol (20.2% globally, ranging from 18.5% to 21.3% across patterns), these two metabolic risk factors accounted for approximately 70% of global CVD burden.
Table I
Population attributable fractions for CVD of various risk factors in 2021
Figure 3
Proportion of the age-standardized disability-adjusted life year rate for CVD (A) and neoplasms (B) attributable to various risk factors across four characteristic regions in 2021
The universal predominance of hypertension across diverse populations, income levels, and epidemiological contexts establishes blood pressure control as the paramount CVD prevention priority worldwide. Pattern 1 countries demonstrated the feasibility of achieving low CVD burden through comprehensive hypertension management programs, providing proof of concept for global scale-up. The consistency of this finding across patterns indicates that, unlike many risk factors showing substantial geographic variation, hypertension control represents a universal intervention target with applicability across all settings.
Low fruit intake (8.1% globally), low whole grain consumption (7.0%), and high sodium intake (8.7%) emerged as the predominant dietary contributors. Pattern 3 regions showed the highest dietary risk burden (43.5%), reflecting ongoing nutritional transitions, while Pattern 1 regions achieved lower dietary contributions (35.2%) through sustained population-level interventions. Environmental factors including ambient particulate matter pollution (14.7%) and household air pollution (8.3%) showed marked geographic clustering, with the highest burden in Pattern 3 and 4 regions, where rapid industrialization and continued reliance on solid fuels persist.
Smoking: the leading modifiable cancer risk factor
For neoplasms, smoking emerged as the single most important modifiable risk factor, accounting for 18.5% of global cancer burden (Table II, Figure 3 B). However, this contribution varied dramatically across epidemiological patterns, revealing distinct stages of the tobacco epidemic. Pattern 2 regions, having experienced earlier tobacco adoption and longer exposure duration, demonstrated the highest smoking-attributable cancer burden, at 23.4%. Pattern 1 regions achieved substantial reductions to 10.4% through decades of comprehensive tobacco control, while Pattern 3 (11.7%) and Pattern 4 (13.8%) regions faced intermediate but rising burdens.
Table II
Population attributable fractions for neoplasms of various risk factors in 2021
The remarkably high burden in Pattern 2 regions – nearly one-quarter of all cancer deaths attributable to smoking – underscores the long-term consequences of historical tobacco use and provides a sobering preview of the burden that Pattern 3 and 4 regions will face without aggressive tobacco control implementation. Conversely, Pattern 1’s reduction to 10.4% demonstrates that comprehensive tobacco control policies can achieve approximately 50% reduction in smoking-attributable cancer burden, establishing tobacco control as the single most cost-effective cancer prevention strategy globally.
Beyond smoking, pattern-specific variations were observed for unsafe sex (highest in Pattern 3 at 7.1%, reflecting inadequate HPV vaccination and cervical screening), alcohol use (highest in Pattern 2 at 4.0%), and high BMI (highest in Pattern 1, at 4.0% where obesity has reached epidemic proportions). Occupational exposures contributed approximately 3% globally, with asbestos exposure (1.6%) showing pronounced variation: the highest in Patterns 1 and 2 (1.5% and 1.7%), reflecting historical industrial exposure, but lower in Patterns 3 and 4 (0.5% and 0.7%), where industrialization occurred more recently, with better workplace safety standards.
Machine learning insights: SHAP values reveal individual-level risk stratification priorities
Machine learning analysis using SHAP values provided complementary insights to population attributable fractions, identifying the risk factors most important for individual-level prediction of disease burden (Figures 4 and 5). For CVD, high systolic blood pressure demonstrated both high PAF and high SHAP values across all patterns, confirming its role as both a population-level policy priority and individual-level clinical intervention target (Figure 4). High LDL cholesterol similarly showed consistent importance for both population and individual prediction.
Figure 4
SHAP summary plot of CVD in four characteristic regions. Plots display variables ranked by importance in terms of risk factor exposure from top to bottom. The SHAP value on the horizontal axis represents the influence of the factor on the outcome, with positive values indicating promotion and negative values indicating inhibition. The larger the absolute value of SHAP, the greater its impact on population attributable fractions for CVD
CVD – cardiovascular disease, LDL – low-density lipoprotein, SHAP – Shapley additive explanations.
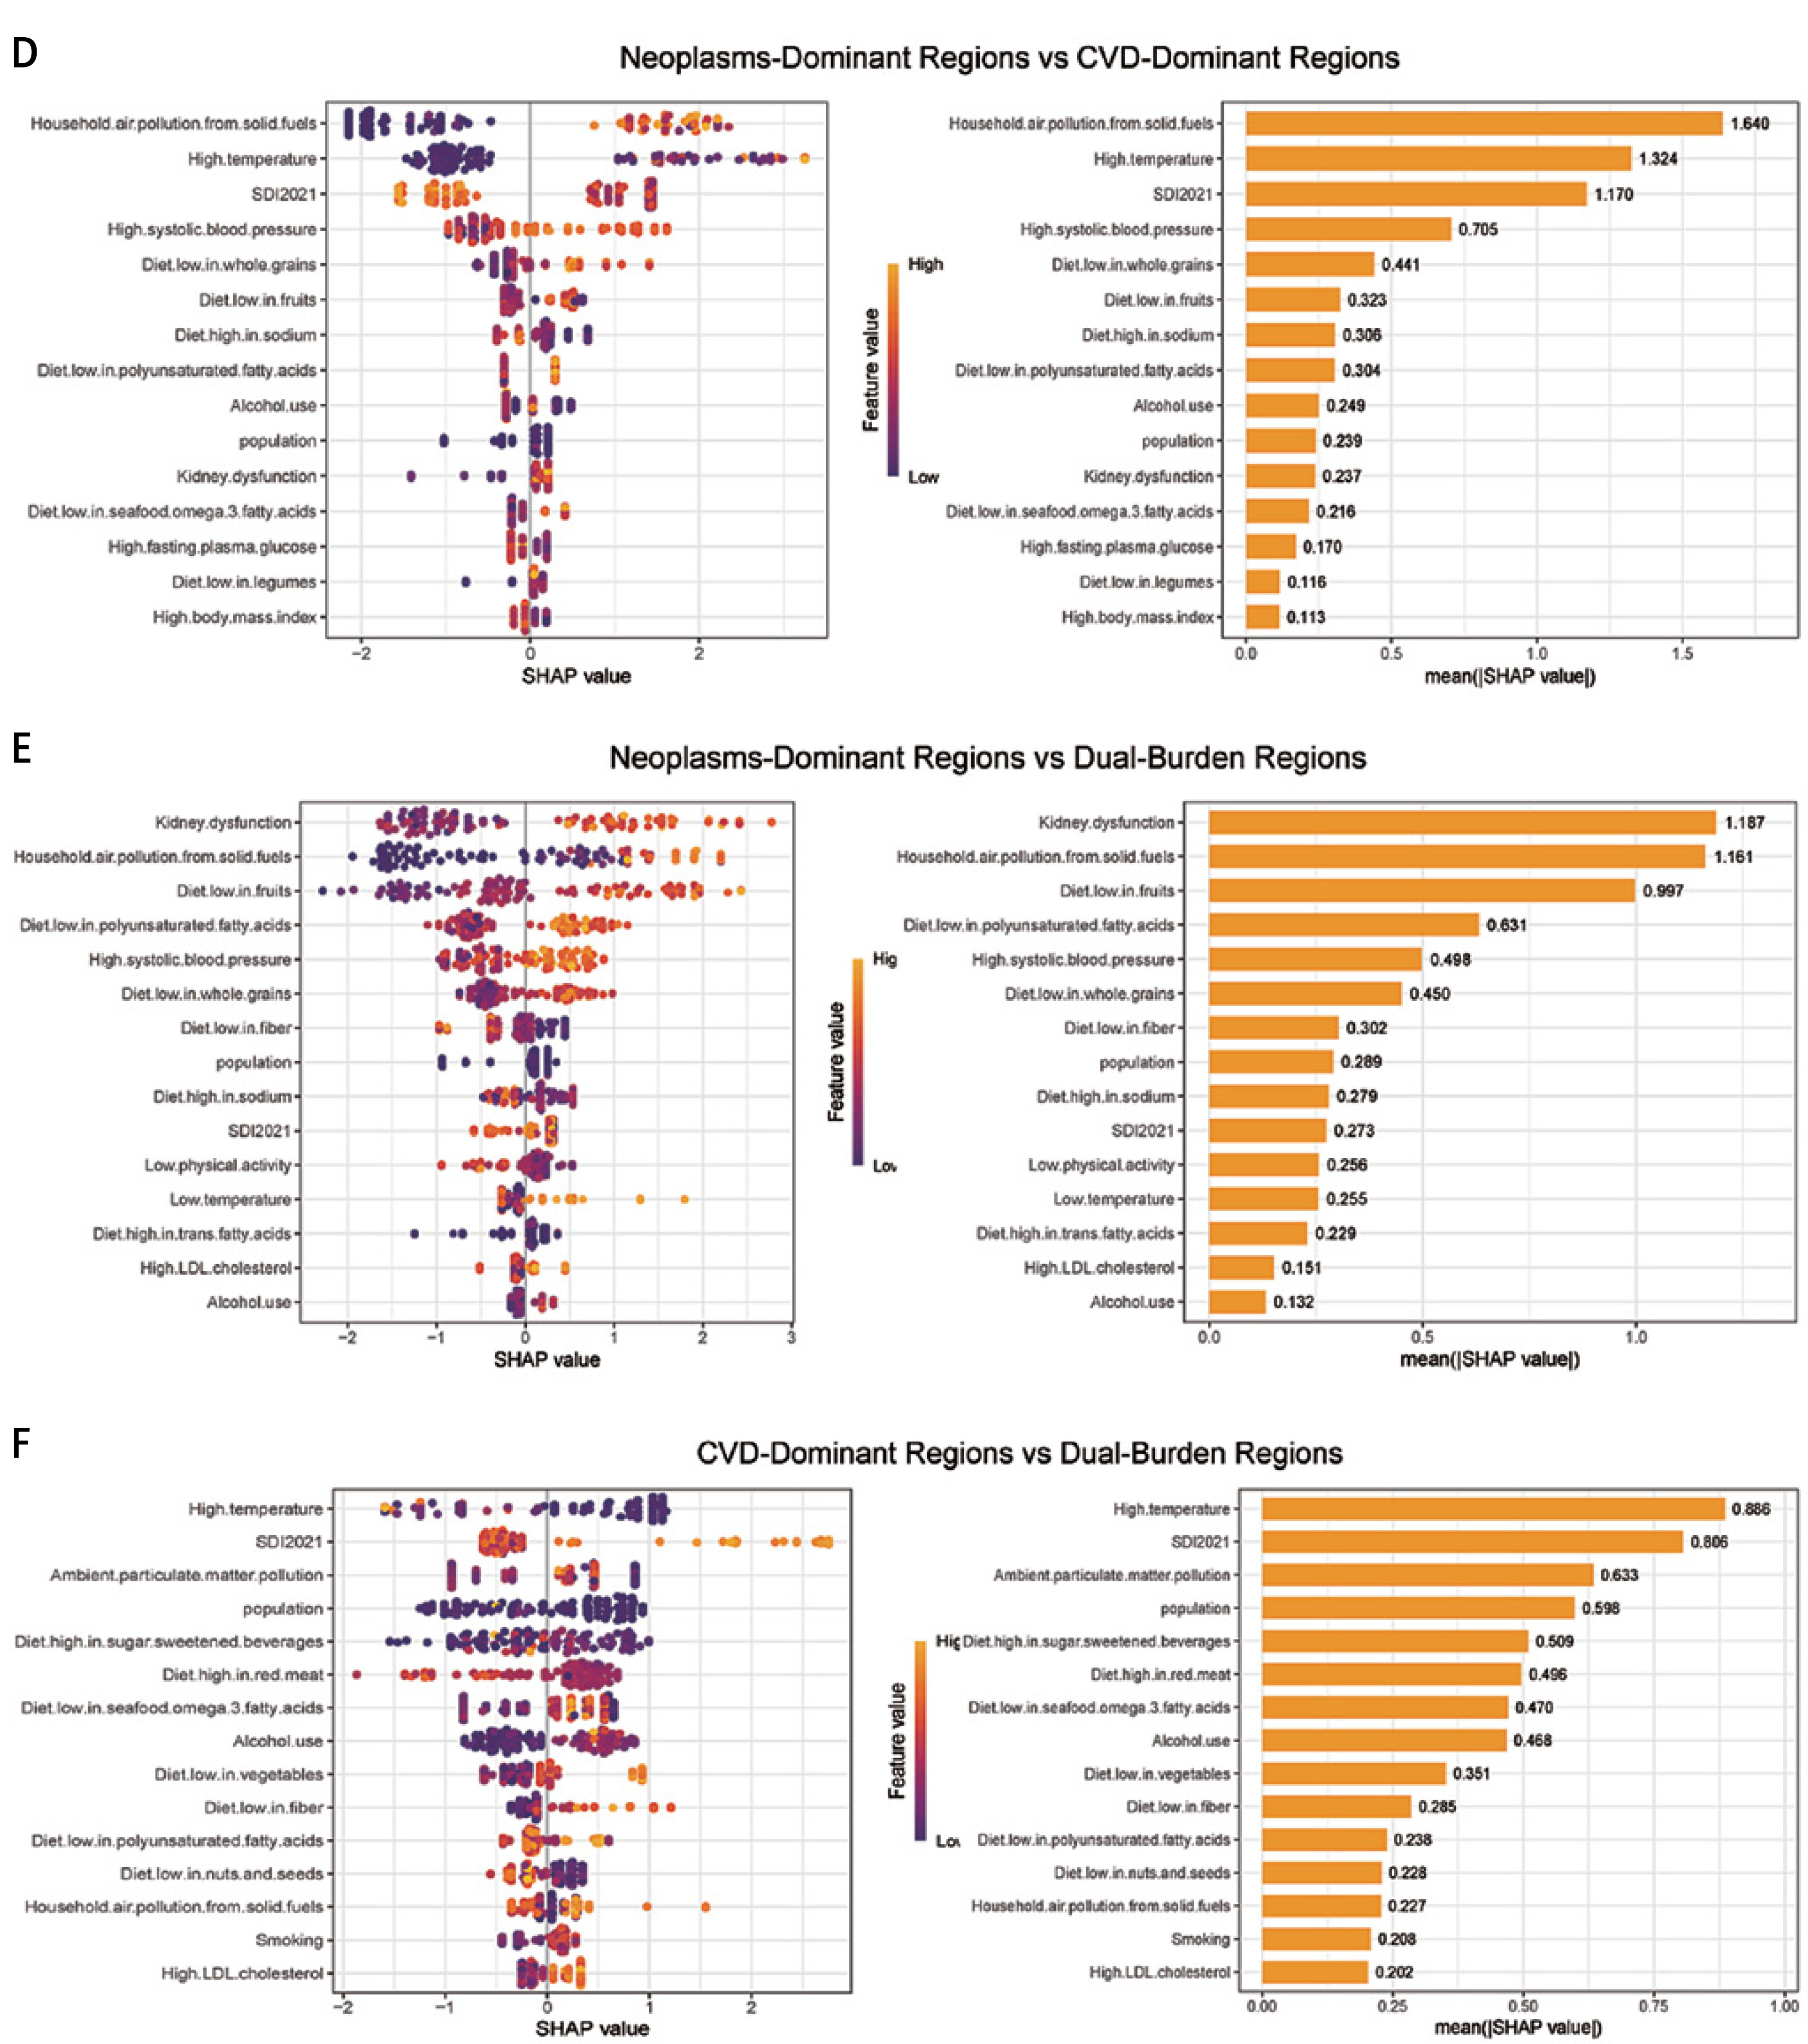
Notably, several risk factors with moderate PAF showed elevated SHAP values, indicating strong dose-response relationships useful for clinical risk stratification even if population exposure levels were moderate. For example, while lead exposure contributes modestly at the population level, its high SHAP value suggests that targeted screening in high-risk occupations proves more efficient than population-wide interventions. Similarly, kidney dysfunction and high fasting plasma glucose demonstrated this pattern, supporting targeted screening and intervention for high-risk individuals rather than universal population-wide approaches.
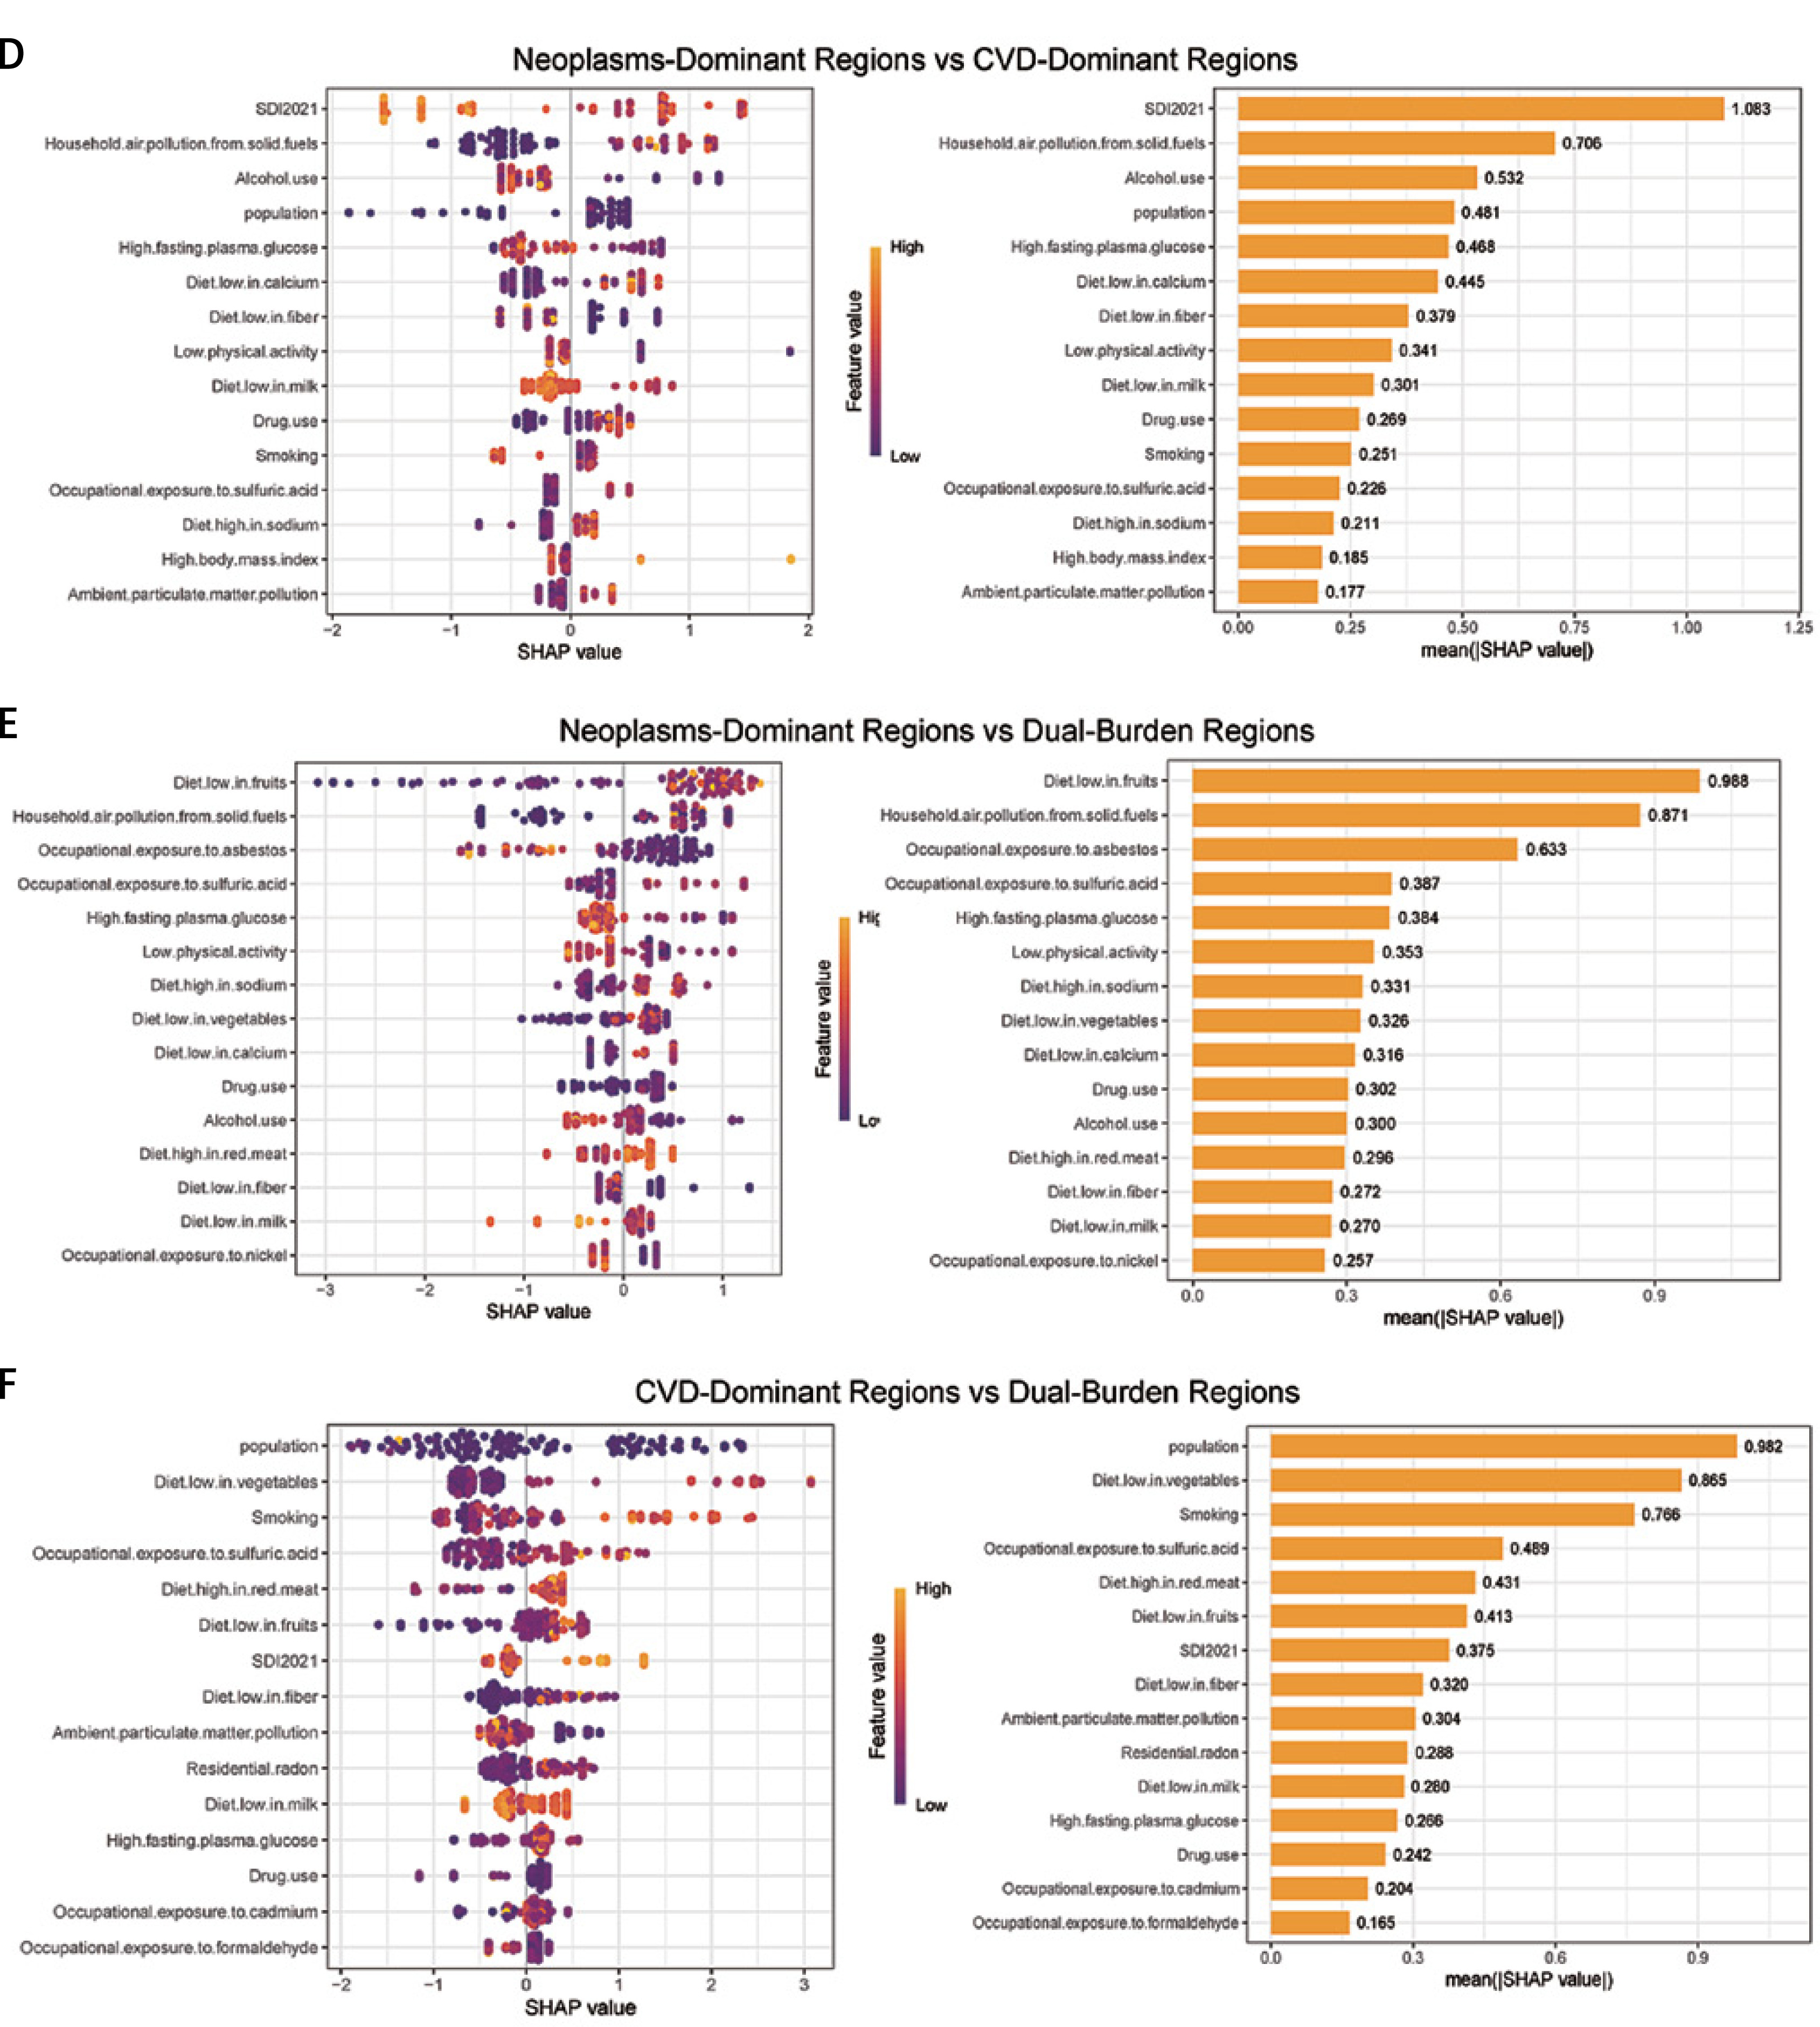
For neoplasms, smoking demonstrated consistently high predictive importance across all patterns, confirming its role as the leading modifiable cancer risk factor for both population-level policy targeting and individual-level risk stratification (Figure 5). In Pattern 3 and 4 regions, unsafe sex showed elevated predictive importance beyond PAF, reflecting strong dose-response relationships for infection-related cancers and identifying high-risk populations requiring targeted HPV vaccination and screening programs.
Figure 5
SHAP summary plot of neoplasms in four characteristic regions. Plots display variables ranked by importance in terms of risk factor exposure from top to bottom. The SHAP value on the horizontal axis represents the influence of the factor on the outcome, with positive values indicating promotion and negative values indicating inhibition. The larger the absolute value of SHAP, the greater its impact on population attributable fractions for neoplasms
SHAP – Shapley additive explanations
This integration of traditional epidemiological methods (PAF) with machine learning approaches (SHAP) provides methodological advancement for prevention prioritization: PAF identifies population-level policy targets for maximum public health impact, while SHAP values identify individual-level risk factors warranting clinical attention for personalized risk prediction. High PAF with high SHAP (e.g., blood pressure, smoking) represents universal priorities requiring both policy and clinical intervention. High PAF with lower SHAP suggests population-wide exposures with limited individual variation, indicating policy interventions as the primary approach. Lower PAF with high SHAP identifies factors with strong dose-response relationships, where targeting high-exposure individuals may prove most efficient.
Discussion
In this study, we established a comprehensive global framework characterizing the co-occurrence patterns of CVD and neoplasms across 204 countries and territories from 1990 to 2021. We identified four distinct epidemiological patterns based on disease burden distribution, quantitatively evaluated risk factor contributions within each pattern, and integrated population attributable fraction (PAF) analysis with machine learning approaches to distinguish population-level and individual-level intervention priorities. Our results demonstrated that global disease burden exhibits marked spatial clustering aligned with socioeconomic development stages, with Pattern 1 regions achieving sustained burden reductions while Pattern 4 regions experience deteriorating trends despite proven technical solutions existing.
Overall, 49.7% of CVD burden and 18.5% of neoplasm burden can be attributed to the single risk factors of high systolic blood pressure and smoking, respectively, with specific combinations and variations of risk factors greatly influencing global disparities in disease burden trajectories.
CVD and neoplasms represent the two leading causes of global mortality, together accounting for over 50% of deaths worldwide [5, 29, 30]. Previous studies have predominantly analyzed these disease categories separately or focused on specific geographic regions. A 2019 Global Burden of Disease analysis examined CVD burden across 195 countries but did not integrate cancer patterns or assess their co-occurrence [31]. Similarly, comprehensive global cancer burden assessments have typically excluded CVD considerations [32]. Recent studies have begun exploring shared risk factors between CVD and cancer, particularly metabolic syndrome components [33], but a systematic global framework integrating both disease categories across all countries has been lacking. Our study addresses this gap by demonstrating that CVD and neoplasm burdens exist not as independent phenomena but as interconnected manifestations of populations at different epidemiological transition stages. Our study addresses this gap by providing the first systematic classification of global CVD-cancer co-occurrence patterns across all 204 countries and territories, demonstrating that these diseases exist not as independent phenomena but as interconnected manifestations of populations at different epidemiological transition stages. This represents a novel contribution beyond previous literature that has examined CVD and cancer burden separately, by revealing how the relative burden of these two disease categories can serve as indicators of epidemiological development stage with important implications for intervention targeting.
The four-pattern classification revealed in our analysis provides new insights that build upon but extend previous frameworks. The epidemiological transition model proposed by Omran and refined by subsequent researchers has traditionally described shifts from infectious to non-communicable disease predominance but has not systematically addressed the divergent trajectories of CVD versus cancer burden during this transition [2]. Our Pattern 2 regions, where neoplasm burden equals or exceeds CVD burden, represent an advanced transition stage that has received limited attention in existing literature. Denmark exemplified this pattern with neoplasm burden (3,211 per 100,000) substantially exceeding CVD burden (1,794), consistent with recent epidemiological reports from Nordic countries documenting cancer overtaking CVD as the leading cause of death in certain age groups [34]. This transition reflects successful cardiovascular disease prevention while cancer emerges as the predominant health challenge, requiring substantial health system reorientation toward cancer screening, diagnosis, and treatment infrastructure.
The geographic distribution of our four patterns overlaps substantially with global economic development levels, consistent with previous reports that disease burden correlates closely with socioeconomic status [35, 36]. Pattern 1 countries, concentrated in Western Europe, East Asia (particularly Japan and South Korea), and Oceania, are predominantly high-income nations with well-developed health systems. Pattern 3 countries, characterized by a disproportionately high CVD burden, are concentrated in South Asia, North Africa, and Central Asia – regions with documented high prevalence of hypertension and diabetes, and inadequate CVD prevention infrastructure. However, our analysis revealed important exceptions to this general pattern. Several middle-income countries, including Brazil and Iran, achieved Pattern 1 status through sustained health system investment, while some high-income nations in Eastern Europe remain in Pattern 4 due to historical factors including Soviet-era health system collapse. These exceptions underscore that disease burden trajectories are not predetermined by current economic status but are modifiable through policy choices and health system investment [37].
Our finding that global disease burden trajectories are diverging rather than converging represents a concerning departure from the optimistic projections of recent decades. The 2015 Sustainable Development Goals anticipated convergence in health outcomes through universal health coverage and increased development assistance [38]. However, our analysis documenting a 5.8 percentage point gap in average annual percentage change between Pattern 1 countries achieving the steepest burden reductions (best performer: –4.3%) and Pattern 4 countries experiencing increases (worst performer: +1.5%) suggests that global health inequality is widening. This divergence has been noted in other contexts, with recent analyses documenting increasing disparities in life expectancy and child mortality between high and low-income countries following initial convergence. The COVID-19 pandemic likely exacerbated these disparities through disproportionate impacts on health systems in resource-limited settings, although our analysis extends only through 2021 and cannot fully characterize pandemic effects [39].
The identification of high systolic blood pressure as the dominant CVD risk factor, accounting for 49.7% of burden globally (ranging from 49.2% to 52.4% across all epidemiological patterns), provides robust evidence for hypertension control as the paramount prevention priority worldwide. Previous studies have established hypertension as a major CVD risk factor, but the remarkable consistency of its contribution across diverse populations, income levels, and epidemiological contexts has not been previously quantified at global scale [40, 41]. The PURE study, analyzing populations across 21 countries, reported hypertension prevalence exceeding 50% in low- and middle-income countries, with awareness and treatment rates below 40% [42, 43], suggesting a substantial opportunity for burden reduction through improved hypertension management. Our PAF estimates align with previous modeling studies suggesting that global hypertension control could prevent approximately 50% of CVD events, though achieving this potential requires overcoming substantial implementation barriers including inadequate screening, medication access, and adherence support.
The methodological innovation of integrating PAF analysis with SHAP machine learning approaches addresses a longstanding challenge in prevention science regarding optimal allocation of resources between population-level and individual-level interventions. The Rose paradox posits that most cases of common diseases arise from the large portion of the population at moderate risk rather than the small portion at high risk [44], suggesting that population-wide interventions prove more effective than high-risk targeting. However, resource constraints, particularly in Pattern 3 and 4 countries, necessitate prioritization. Our finding that certain risk factors show high PAF but moderate SHAP values (indicating population-wide exposures) versus others showing moderate PAF but high SHAP values (indicating strong dose-response relationships in high-risk individuals) enables more sophisticated targeting. For instance, lead exposure contributes modestly to population-level CVD burden but shows high SHAP importance, suggesting that occupational screening and intervention in high-exposure industries may prove more cost-effective than population-wide approaches. This precision public health framework represents an advancement beyond traditional dichotomous population versus high-risk strategies.
Our analysis revealed substantial geographic clustering of specific risk factors that helps explain the observed disease burden patterns. Household air pollution from solid fuels contributed 8.3% globally to CVD burden but showed marked regional variation, with Pattern 3 and 4 countries experiencing disproportionate exposure. Previous studies have established household air pollution as a major CVD risk factor, with estimated attributable fractions ranging from 10% to 15% in South Asia and sub-Saharan Africa [45, 46]. The persistence of solid fuel use reflects energy poverty and inadequate access to clean cooking technologies – issues closely linked to broader development challenges. Recent initiatives promoting liquefied petroleum gas access and electric cooking in low-income countries have demonstrated feasibility and health benefits [47], suggesting that energy transition represents both climate and health co-benefit opportunities.
The pattern-specific variation in smoking’s contribution to cancer burden – ranging from 10.4% in Pattern 1 countries to 23.4% in Pattern 2 regions – reflects distinct stages of the tobacco epidemic described by Lopez et al. [48]. Pattern 2 countries, having experienced earlier tobacco adoption and peak consumption several decades ago, now manifest a maximal smoking-attributable cancer burden as the latency period for tobacco-induced cancers spans 20–30 years [49]. Pattern 1 countries, implementing comprehensive tobacco control beginning in the 1970s–1980s, have achieved substantial reductions in smoking-attributable burden. Pattern 3 and 4 countries, at earlier epidemic stages, face a rising burden in the absence of aggressive control implementation. This temporal pattern is consistent with previous analyses projecting that smoking-attributable deaths will peak in low- and middle-income countries during the 2020s–2030s [50]. The achievement of Pattern 1 countries in reducing the smoking-attributable cancer burden by approximately 50% through comprehensive tobacco control – including taxation, smoke-free policies, advertising bans, and cessation support – provides proof of concept for global scale-up [51].
The substantial contribution of dietary factors to CVD burden (approximately 40% globally) and their marked pattern-specific variation reflect distinct nutritional transition stages across global populations. Pattern 3 countries showed the highest dietary risk contributions, characterized by low fruit and whole grain consumption combined with high sodium intake. This pattern aligns with the nutrition transition framework describing shifts from traditional to Westernized diets during economic development, often involving increased ultra-processed food consumption before populations achieve dietary diversity [52]. The Global Dietary Database project documented substantial global variation in dietary quality, with the lowest scores in South Asia, North Africa, and parts of Latin America – regions largely corresponding to our Pattern 3. Importantly, dietary risks contributed substantially across all patterns, including Pattern 1 countries, where obesity and associated dietary risks remain prevalent despite the overall low disease burden. This suggests that dietary interventions represent universal priorities, though specific targets vary by context – salt reduction in Pattern 3, trans-fat elimination and sugar reduction in Patterns 1 and 2.
The integration of traditional epidemiological approaches with machine learning methods represents a methodological contribution with implications beyond the specific findings. While previous applications of machine learning in disease burden research have predominantly focused on prediction or risk factor identification rather than intervention prioritization, our study demonstrates how SHAP interpretability frameworks can be systematically integrated with traditional PAF analysis to address practical policy questions. This represents a novel application of machine learning interpretability methods to global health epidemiology. Previous applications of machine learning in disease burden research have predominantly focused on prediction or risk factor identification rather than intervention prioritization. The SHAP framework provides interpretable machine learning outputs that can guide policy decisions but has seen limited application in global health contexts. Our demonstration that SHAP values provide complementary insights to PAF estimates – identifying factors important for individual risk stratification even when population-level contributions are moderate – suggests broader applicability to other disease categories and intervention domains. This precision population health approach may prove particularly valuable in resource-constrained settings where optimal targeting is essential for maximal impact.
The finding that Pattern 4 regions exhibit heterogeneous and often deteriorating trajectories despite global availability of proven interventions warrants particular attention. Nearly half of Pattern 4 countries (44%) experienced a rising cancer burden between 1990 and 2021, while multiple countries showed an increasing CVD burden. This pattern contradicts the conventional assumption that health burden naturally declines with development. Analysis of specific countries provides insights into driving factors. Lesotho and Zimbabwe, experiencing the most dramatic burden increases (CVD AAPC +1.5% and +1.3%, respectively; cancer AAPC +2.2% and +1.2%, respectively), both faced intersecting challenges including HIV/AIDS epidemic impacts on health system capacity, political instability, and inadequate non-communicable disease resources [53–55]. The HIV epidemic created competing priorities and devastated healthcare workforces, while treatment scale-up diverted resources from other health domains. This experience underscores that health system strengthening must address multiple disease categories simultaneously rather than pursuing vertical disease-specific approaches that may inadvertently weaken overall capacity.
The policy implications of our findings warrant emphasis given the growing recognition that global health governance structures inadequately address non-communicable disease prevention. Current global health financing mechanisms heavily prioritize infectious diseases despite non-communicable diseases causing 70% of global mortality [56]. The Global Fund to Fight AIDS, Tuberculosis and Malaria, Gavi the Vaccine Alliance, and other major funding mechanisms lack equivalent counterparts for CVD and cancer prevention. Several factors contribute to this imbalance, including historical precedent, donor preferences, and greater political salience of infectious disease threats. However, the COVID-19 pandemic highlighted that health system fragility affects all disease categories, suggesting that integrated health system strengthening provides broader benefits than disease-specific vertical programs. Our finding that Pattern 4 countries face dual burdens requiring simultaneous attention strengthens the case for horizontal approaches emphasizing primary care capacity, essential medication access, and health workforce development.
From a clinical perspective, our findings support multidisciplinary approaches integrating cardiovascular and cancer care. Shared risk factors, particularly metabolic syndrome components, suggest opportunities for integrated screening and intervention. Cardio-oncology has emerged as a subspecialty addressing cardiovascular complications of cancer treatment, but our results suggest broader integration encompassing primary prevention [57]. For instance, comprehensive tobacco cessation programs benefit both CVD and cancer prevention, enabling resource sharing and efficiency gains. Similarly, addressing obesity through dietary and physical activity interventions provides dual benefits. Healthcare delivery systems, particularly in Pattern 3 and 4 countries building primary care capacity, should consider integrated non-communicable disease management platforms rather than separate cardiovascular and oncology services.
Our analysis has several limitations that warrant acknowledgment. First, we relied on Global Burden of Disease estimates subject to data quality constraints, particularly in countries with weak vital registration systems. Measurement error likely varies systematically across patterns, with Pattern 4 countries having the weakest data infrastructure. However, validation studies suggest that GBD estimates generally represent the best available data, and sensitivity analyses demonstrate that the main findings remain robust to plausible measurement error. Second, our cross-sectional pattern classification cannot capture dynamic transitions or identify countries at risk of deterioration. Longitudinal analyses tracking pattern transitions over time would enable early warning and preventive action. Third, while we identified risk factors contributing to disease burden, causal inference regarding specific interventions requires randomized controlled trials and quasi-experimental studies beyond the scope of our analysis. However, the interventions we recommend rest on extensive trial evidence from other settings, and our contribution lies in quantifying their potential impact across diverse global contexts.
Fourth, our focus on country-level burden does not capture within-country inequalities by socioeconomic status, geographic location, race/ethnicity, or other dimensions. Previous studies have documented that within-country health inequalities often exceed between-country disparities, suggesting that our analysis underestimates total global health inequality [58, 59]. Future work incorporating subnational data would provide a more complete picture. Fifth, machine learning analysis using SHAP values, while methodologically innovative, requires validation through prospective implementation studies. The utility of SHAP-guided targeting for identifying high-risk individuals warranting intensive intervention should be evaluated in diverse health system contexts.
Compared with existing research, our study makes several important contributions. First, we adopted a comprehensive global perspective systematically examining CVD and neoplasm co-occurrence across all countries, whereas previous studies typically focused on single diseases or specific regions. The country-level analysis captures influence of multiple factors including economic development, healthcare systems, and cultural contexts while maintaining statistical power and generalizability. Second, we integrated temporal trends (1990–2021) with cross-sectional patterns, enabling assessment of both current status and trajectories. This revealed the concerning divergence between improving and deteriorating regions that cross-sectional analysis alone would miss. Third, our methodological innovation integrating PAF and SHAP approaches addresses practical challenges in prevention prioritization that neither method alone can solve. This precision population health framework has broad applicability beyond the specific diseases examined.
Looking forward, several research directions warrant priority. First, analyzing determinants of pattern transitions would enable identification of countries at risk of deterioration and factors enabling progression toward a lower burden. Specific attention to countries that successfully transitioned from Pattern 3 or 4 to Pattern 1 (e.g., Brazil, South Korea) could identify transferable strategies. Second, economic modeling quantifying returns on investment for health system strengthening in Pattern 3 and 4 countries would strengthen policy arguments. While evidence suggests favorable cost-effectiveness, comprehensive economic analyses incorporating productivity gains, healthcare cost savings, and development impacts would inform resource allocation. Third, implementation research identifying effective strategies for translating evidence-based interventions to diverse contexts is urgently needed. The gap between knowing which interventions work and successfully implementing them at scale represents the critical barrier to global progress.
Fourth, subnational analyses examining within-country inequalities would provide more granular understanding and enable more targeted interventions. Many countries exhibit substantial internal variation that country-level analysis obscures. Fifth, expansion to include other non-communicable diseases (respiratory diseases, diabetes, mental health conditions) would provide a more comprehensive picture of global health transitions. Our framework focusing on CVD and cancer provides a foundation for broader analyses. Finally, prospective monitoring of Pattern 4 countries’ trajectories, particularly in the COVID-19 pandemic aftermath, is essential for understanding long-term impacts and enabling early warning of health system deterioration.
In conclusion, this comprehensive analysis reveals four distinct global patterns of CVD and neoplasm co-occurrence representing different epidemiological transition stages, with concerning divergence between regions achieving sustained burden reductions and those experiencing deterioration. The universal predominance of high blood pressure as a CVD risk factor and smoking as a cancer risk factor, combined with substantial pattern-specific variation in other risk factors, indicates that prevention strategies must balance universal interventions applicable across all settings with tailored approaches addressing local epidemiological profiles. The methodological integration of PAF and machine learning approaches provides a framework for optimizing resource allocation between population-level and individual-level interventions. Addressing widening global health inequalities requires moving beyond knowledge generation to focus on implementation capacity building, particularly in Pattern 3 and 4 regions where proven interventions remain inadequately deployed. Only through comprehensive approaches integrating vertical disease-specific expertise with horizontal health system strengthening can the global burden of CVD and cancer be effectively prevented and controlled.