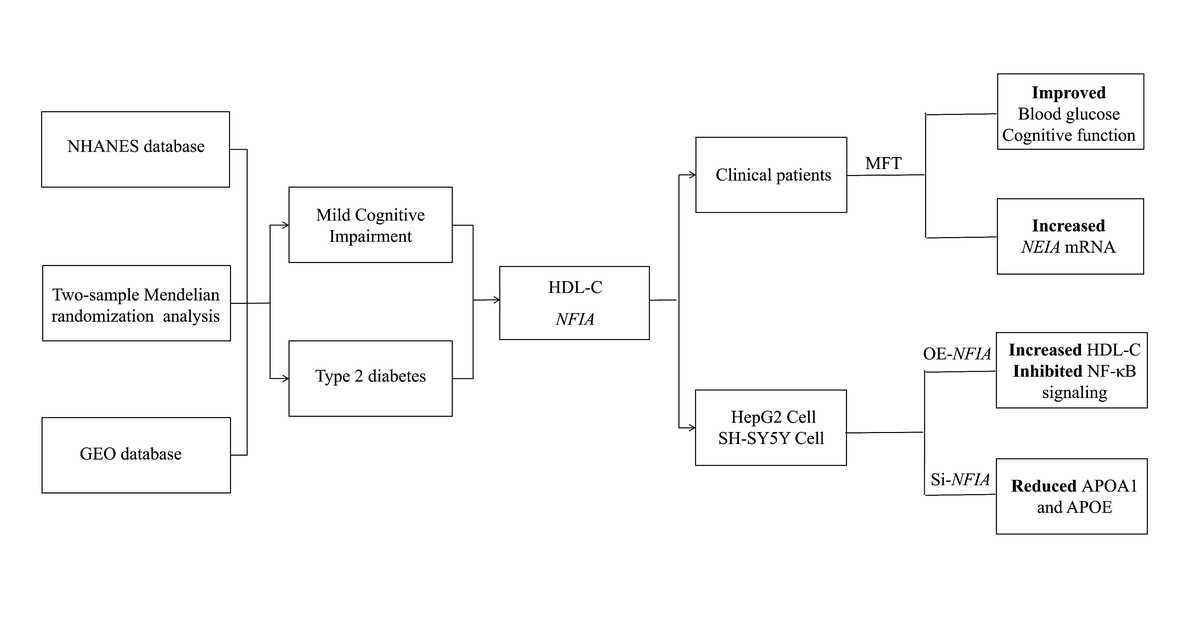
Introduction
Type 2 diabetes (T2D) is a chronic metabolic disorder characterized by persistent hyperglycemia, primarily driven by insulin resistance and β-cell dysfunction, with both genetic and environmental contributors [1]. Its growing prevalence – particularly among older adults – substantially increases the risk of cardiovascular disease, kidney dysfunction, dementia, and other complications, resulting in significant healthcare and economic burdens. For instance, in China, diabetes-related healthcare costs are projected to rise from 250.2 billion yuan in 2020 to 460.4 billion yuan by 2030, an average annual increase of 6.32% [2]. As disease management advances, attention is increasingly turning to previously overlooked comorbidities, including cognitive decline, cancer, and depression [3].
Mild cognitive impairment (MCI), a clinical state between normal aging and dementia, is closely linked to neurodegenerative diseases such as Alzheimer’s and Parkinson’s [4]. Metabolic abnormalities – such as T2D, prediabetes, and impaired glucose regulation – accelerate cognitive decline through mitochondrial dysfunction, chronic inflammation, vascular damage, and neuronal loss [5–7]. Greater amyloid burden was associated with increased functional impairment, but this relationship was observed only in veterans with T2DM [8]. Emerging research indicates that fasting may enhance insulin sensitivity, promote β-cell regeneration, and improve glycemic control [9, 10]. Animal studies further suggest that fasting supports memory, motor function, and hippocampal neurogenesis, highlighting its potential in treating both T2D and MCI [11].
T2D commonly coexists with dyslipidemia, typically characterized by elevated triglycerides (TG), reduced high-density lipoprotein cholesterol (HDL-C), and increased low-density lipoprotein cholesterol (LDL-C) [12]. HDL-C facilitates reverse cholesterol transport and provides vascular protection through anti-inflammatory, antioxidant, and antithrombotic effects [13]. In T2D, high TG levels enhance cholesteryl ester transfer protein activity, lowering HDL-C further and impairing insulin secretion and glucose uptake [14]. Notably, small HDL particles can cross the blood–brain barrier, suggesting that peripheral HDL-C levels may influence brain function. Higher HDL-C concentrations have been linked to a lower risk of cognitive decline, likely by reducing cerebrovascular inflammation and preserving neuronal activity [15].
Therefore, this study aimed to identify a shared biomarker for assessing the risk of T2D-related cognitive impairment and to evaluate a non-pharmacological intervention for its regulation. We investigated the causal role of HDL-C and its regulatory gene at the metabolic-cognitive interface. This integrated approach provides novel insights into potential strategies for the prevention and treatment of comorbid T2D and MCI.
Material and methods
Study design
The study was structured in four stages. Initially, disease-associated indicators were identified by comparing individuals with T2D and MCI to healthy controls, using data from the National Health and Nutrition Examination Survey (NHANES). Genetic causality of key indicators was subsequently assessed through Mendelian randomization (MR), supported by transcriptomic analysis. The clinical efficacy of modified fasting therapy (MFT) was then evaluated in a prospective cohort. Finally, functional validation of candidate genes was carried out through cellular experiments.
NHANES data analysis
NHANES datasets from 1999 to 2018 were analyzed to evaluate health and nutritional status. Participants were excluded if aged under 18, missing essential clinical variables, or lacking survival information. For MCI-related analysis, only individuals with valid Digit Symbol Substitution Test (DSST) scores were included (Supplementary Figure S1).
Definitions of T2D and prediabetes
T2D was defined by hemoglobin A1c (HbA1c) levels ≥ 6.5% or current use of glucose-lowering medication. Prediabetes was defined by HbA1c levels ranging from 5.7% to 6.5%. Participants not meeting either criterion were classified as normoglycemic [16, 17].
MCI diagnosis
MCI was defined in individuals aged ≥ 65 years with DSST scores within the lowest quartile during the 1999–2000, 2001–2002, 2011–2012, or 2013–2014 NHANES cycles [18].
Statistical analysis of NHANES
Statistical analyses were conducted using R software (version 4.2.3) with the application of appropriate survey weights. Continuous variables were reported as means ± standard deviations or medians with interquartile ranges, while categorical variables were expressed as percentages. Group comparisons were performed using χ2 tests for categorical variables and ANOVA or Kruskal-Wallis tests for continuous variables. Spearman correlation was employed to examine associations. Statistical significance was defined as p < 0.05.
Mendelian randomization
A two-sample MR analysis was conducted using single nucleotide polymorphisms (SNPs) from the GWAS Catalog, filtered by genome-wide significance (p < 5 × 10⁻⁸), low linkage disequilibrium (r2 < 0.05), and a 10,000 kb window. Alzheimer’ s GWAS summary statistics were used as a proxy for MCI. SNPs associated with confounders were excluded using LDlink. The inverse-variance weighted (IVW) method was used as the primary analytic approach, complemented by MR-Egger regression, weighted median, and mode-based estimators. Horizontal pleiotropy and heterogeneity were assessed using the MR-Egger intercept, Cochran’s Q test, and MR-PRESSO. All analyses were performed using the “TwoSampleMR” and “MRPRESSO” R packages (Supplementary Table SI).
Transcriptomic analysis
The RNA-seq datasets from peripheral blood samples of patients with type 2 diabetes in the GEO database (GSE151683, GSE19790, GSE23561, GSE41767, and GSE69528; n = 151) were analyzed. Differentially expressed genes (DEGs) were identified using the “limma” and “sva” packages, applying thresholds of |log FC| > 0.3 and p < 0.05. Heatmaps were generated using the “pheatmap” package. Functional enrichment analysis was performed with “clusterProfiler” and “org.Hs.eg.db”. HDL-C–related genes were retrieved from the GeneCards database.
Modified fasting therapy
MFT was implemented in three phases: (1) a 1–2-day pre-fasting period with a fruit-only diet; (2) a 5-day fasting phase with ≤ 550 kcal/day and 3 l/day of water or herbal tea; and (3) a structured refeeding phase. Intravenous L-carnitine (2 g, twice daily) was administered to reduce hunger and promote lipid metabolism [19–21].
Patient recruitment and data collection
A total of 27 patients diagnosed with type 2 diabetes were recruited from the Seventh Affiliated Hospital of Sun Yat-sen University (Ethics Approval No. KY-2021-108-01). Informed consent was obtained from all participants. Clinical parameters, laboratory results, and cognitive assessments were collected before and after the intervention. Diabetes diagnoses were established according to standardized clinical criteria [16].
Cognitive assessment
Cognitive function was assessed before and after the intervention using the Montreal Cognitive Assessment (MoCA) and the DSST. MoCA scores below 26 were interpreted as indicative of cognitive impairment. Higher DSST scores were considered reflective of better cognitive performance [22].
Transcriptome sequencing
Total RNA was extracted using Vazyme reagents, quantified with Nanodrop and Qubit instruments, and assessed for integrity. Sequencing libraries with approximately 300 bp inserts were prepared and sequenced on the Illumina NovaSeq 6000 platform. Sequence reads were aligned to the human reference genome, and differential expression analysis was conducted using the “DESeq2” package.
Cell culture
HepG2 and 293T cells were maintained in DMEM supplemented with 10% fetal bovine serum and 1% penicillin-streptomycin at 37°C in a 5% CO2 incubator. SH-SY5Y cells were maintained in DMEM/F12 with the same supplements and conditions. Cells were seeded at 60–80% confluency prior to experimental procedures.
Western blotting
Proteins were extracted, separated by SDS-PAGE, and transferred to PVDF membranes. Immunoblotting was performed using primary antibodies against NFIA, p65, phosphorylated p65 (p-p65), IκBα, phosphorylated IκBα (p-IκBα), and GAPDH (Cell Signaling Technology). Detection was carried out using HRP-conjugated secondary antibodies (ABclonal) and enhanced chemiluminescence reagents (Vazyme).
Quantitative RT-PCR
Complementary DNA was synthesized using the HiScript III RT Kit (Vazyme). Quantitative PCR was performed with SYBR Green Master Mix (Vazyme). Relative gene expression was normalized to GAPDH and calculated using the 2–ΔΔCt method. Primer sequences are provided in Supplementary Table SII.
Detection of intracellular HDL-C
Cells were washed with PBS, lysed via sonication, and analyzed using a commercial HDL-C assay kit (Nanjing Jiancheng) following the manufacturer’s protocol.
Nuclear factor I A (NFIA) siRNA and overexpression plasmid transfection
HepG2 and SH-SY5Y cells were transfected with either NFIA-specific siRNA (si-NFIA) or negative control siRNA (si-NC) or a plasmid encoding NFIA for overexpression using Lipofectamine 3000 (Invitrogen), following the manufacturer’s instructions. Plasmid DNA or siRNA and transfection reagent was diluted in Opti-MEM, incubated for complex formation, and applied to cells. After 6 h, the medium was replaced. Cells were harvested 48 h after transfection for subsequent qPCR and Western blot analysis.
APOE and APOA1 quantification by enzyme-linked immunosorbent assay (ELISA)
Cellular APOE and APOA1 levels were measured using ELISA kits (FineTest). After lysis, samples were centrifuged at 1000 × g for 10 min at 4°C to remove debris. Supernatants (100 µl) and standards were added to antibody-coated 96-well plates and incubated at 37°C for 1.5 h. Following washing, 100 µl of detection antibody was added and incubated for another hour. After additional washes, 100 µl of HRP-conjugated secondary antibody was applied and incubated for 30 min. Then 90 µl of substrate solution was added and incubated in the dark for 10–20 min. Reactions were stopped with 50 µl of stop solution. Absorbance was measured at 450 nm, and concentrations were calculated using standard curves.
Statistical analysis
Data were analyzed using t-tests or Mann-Whitney U tests for two-group comparisons, and one-way ANOVA or Kruskal-Wallis tests with post hoc analysis for multiple groups. Paired t-tests or Wilcoxon signed-rank tests were used for pre- vs. post-treatment comparisons. Statistical significance was defined as p < 0.05.
Results
Baseline characteristics
This study included 49,078 participants (23,916 men and 25,169 women), categorized as normal, prediabetic, or T2D based on HbA1c levels and medication use. As summarized in Table I, 66.4% were normal (n = 32,586), 20.7% were prediabetic (n = 10,316), and 13.0% had T2D (n = 6,356). Mean age increased significantly across groups (41.78, 55.67 and 58.86 years; p < 0.001). Most participants were non-Hispanic White with a high school education. The prevalence of hypertension, overweight/obesity, and central obesity, as well as mean values of blood pressure, BMI, waist circumference, triglycerides, and HbA1c, all differed significantly among groups (p < 0.001).
Table I
Demographic and individual characteristics
Cognitive data were available for 5,011 individuals (2,539 women, 2,471 men), of whom 1,138 (22.7%) were classified with MCI and 3,873 (77.3%) as cognitively normal. As shown in Table I, the MCI group was older and had lower educational attainment, consistent with prior studies [23]. HbA1c levels and rates of hypertension and T2D were significantly higher in the MCI group, while BMI and overweight/obesity status showed no significant differences.
Observational analysis of T2D and MCI indicators in NHANES
NHANES examination and laboratory data were analyzed by quartiles (Supplementary Table SIII). Q4 values were used for comparative analysis of T2D and MCI-related biomarkers (Supplementary Table SIV) as well as for subgroup analysis (Supplementary Tables SV–SVIII). Most biomarkers varied significantly across T2D groups (p < 0.001), while fewer differences were observed in MCI. Shared indicators are listed in Table II. This disparity likely reflects the systemic nature of T2D – characterized by metabolic dysfunction and multi-organ involvement – whereas MCI is primarily a neurocognitive condition with more localized physiological effects.
Table II
Important common differential laboratory characteristics
Correlation between key biomarkers and T2D or MCI
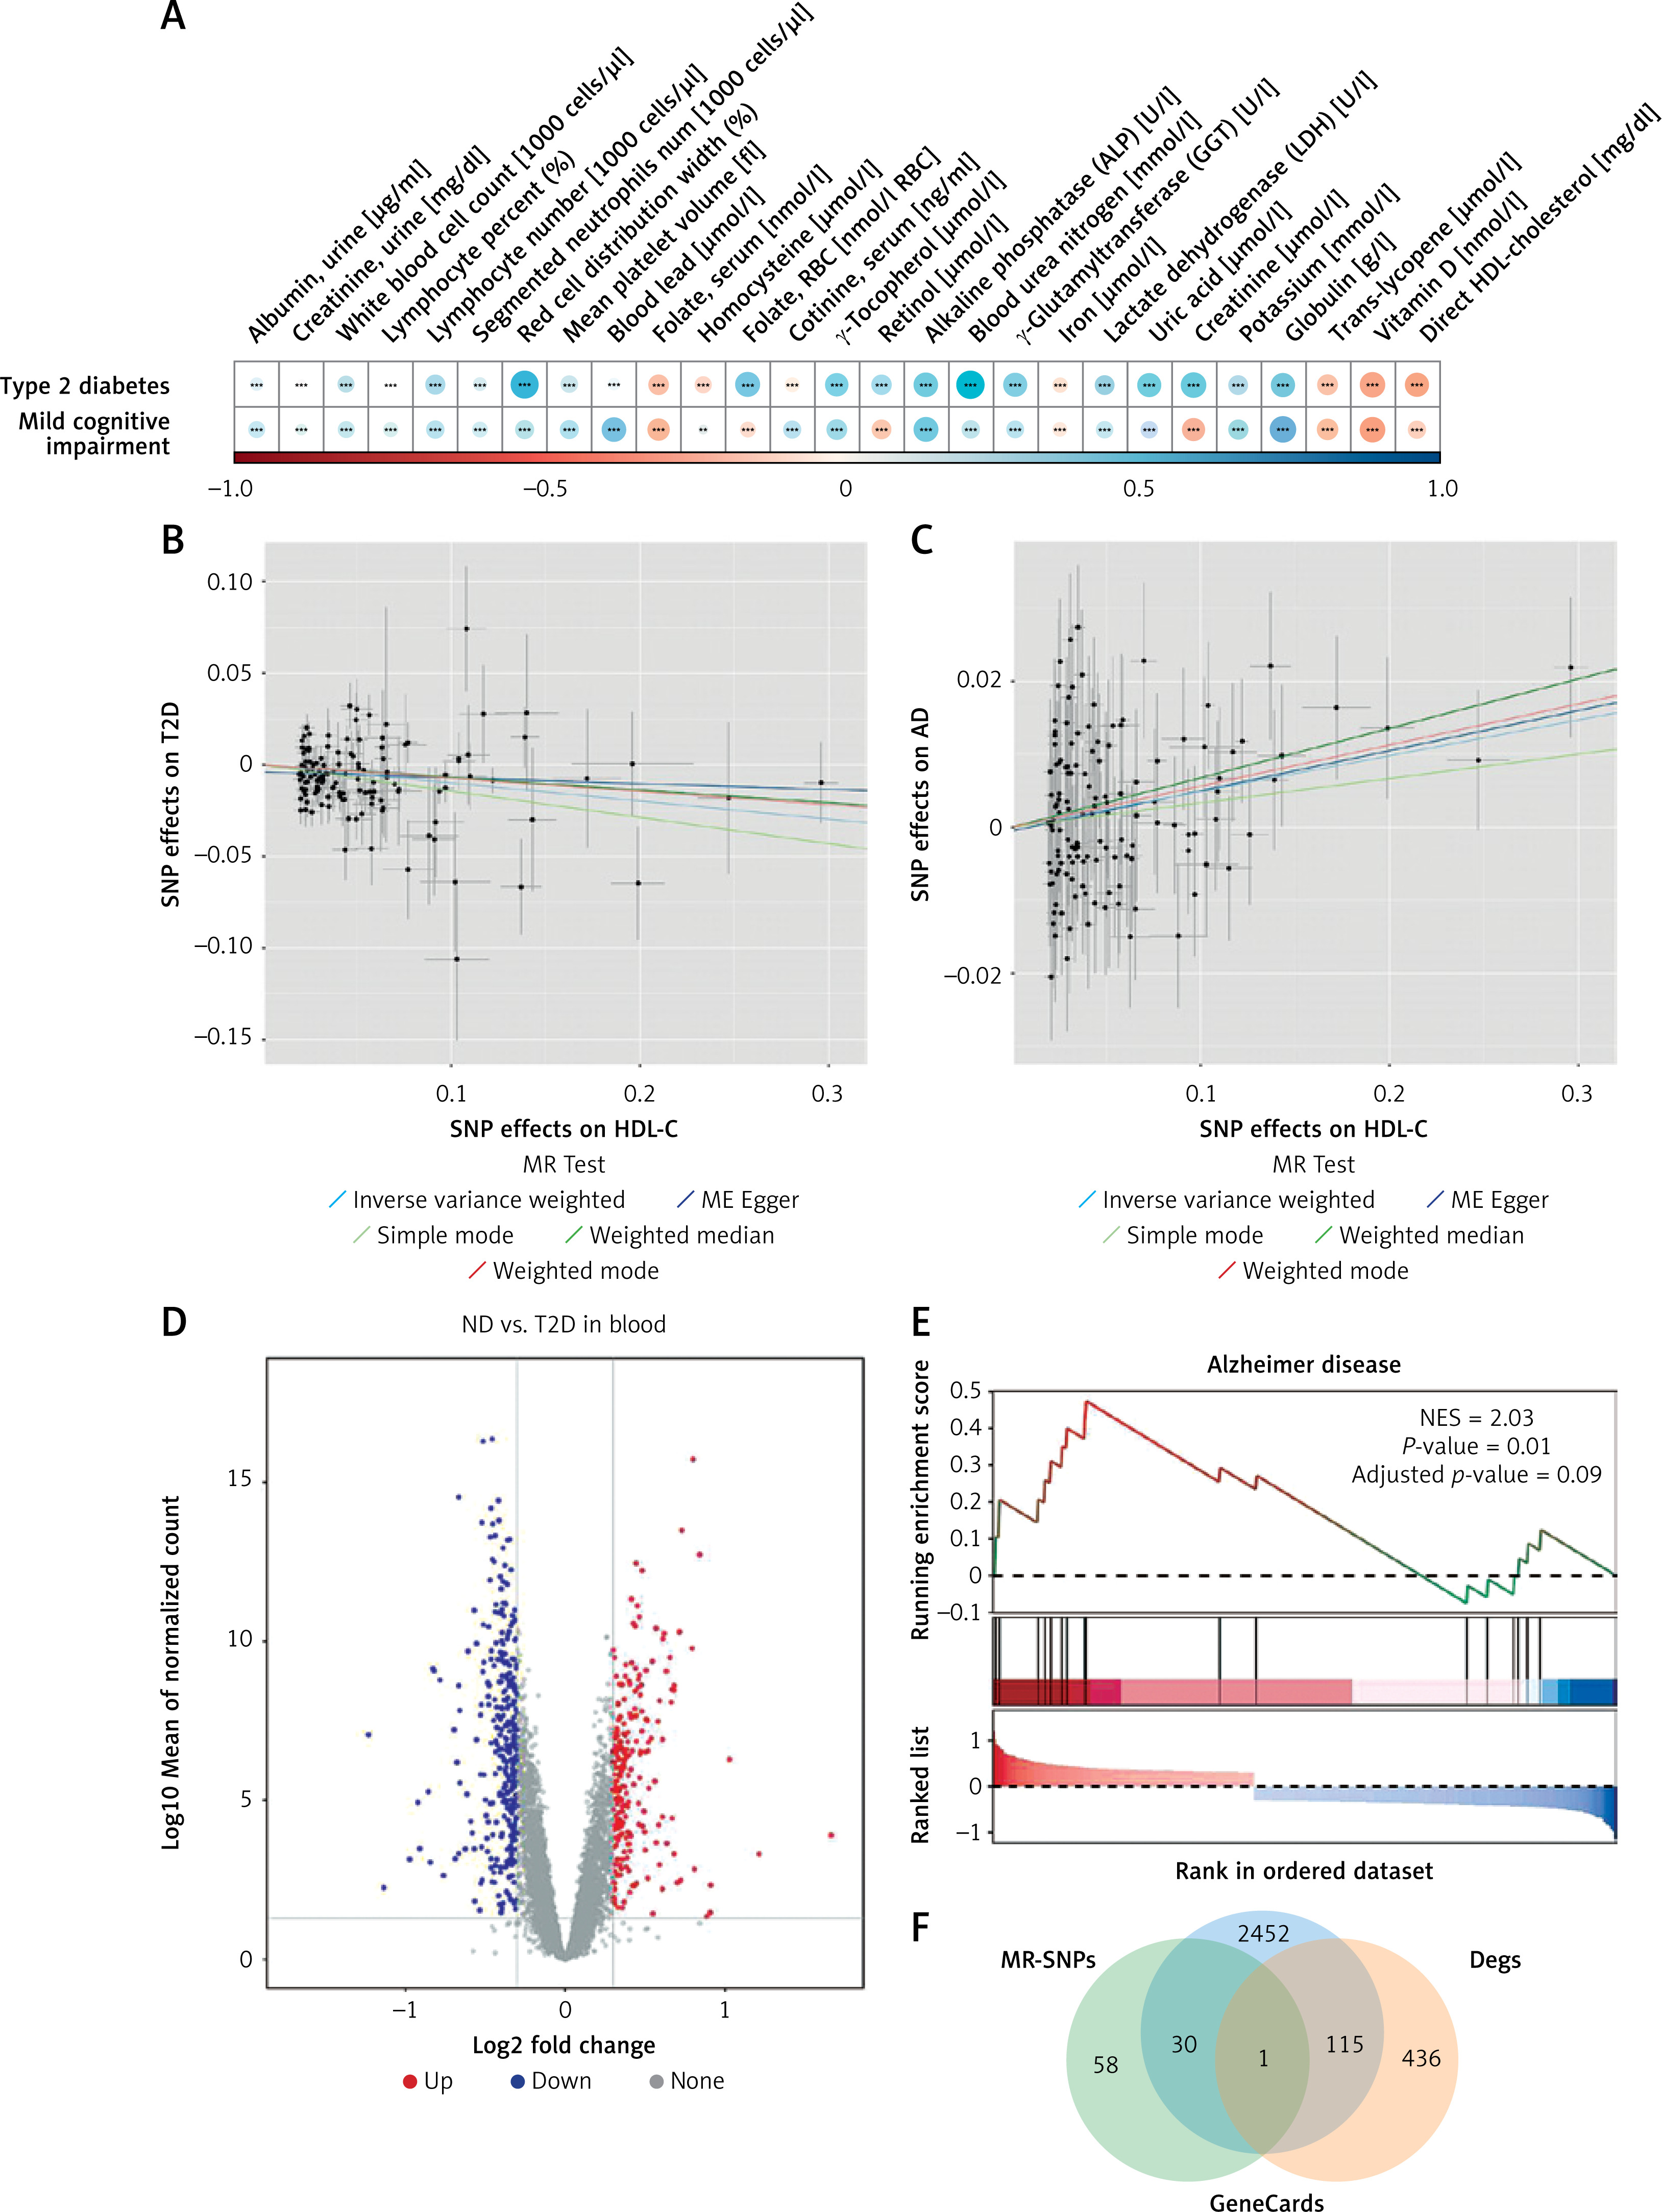
Indicators showing significant group differences were further analyzed for correlations with T2D and MCI outcomes. As anticipated, glycohemoglobin, fasting glucose, C-peptide, and 2-hour plasma glucose were strongly correlated with T2D (r > 0.55, p < 0.01) (Supplementary Table SIX). Blood urea nitrogen and red cell distribution width also showed positive correlations (r > 0.4) (Figure 1 A). In the MCI group, globulin levels were positively associated (r > 0.4), whereas vitamin D and creatinine were negatively correlated (r < –0.3). These moderate correlations (r = 0.3–0.5) indicate potential biochemical differences in cognitive impairment, though their clinical significance is limited.
Figure 1
Integrated analysis of molecular correlates and gene signatures in T2D, MCI, and AD. A – Correlation heatmap of differential indicators with T2D and MCI. B, C – Scatter plots showing the association between HDL-C and the risk of T2D and MCI. D – Distribution of upregulated and downregulated genes. E – GSEA enrichment plot for the Alzheimer disease-related gene set. F – Venn diagram showing the overlapping genes among ND-T2D DEGs (orange), GeneCards (blue), and MR-SNPs (green). *p < 0.05, **p < 0.01, ***p < 0.001
Causal effects of HDL-C on T2D and MCI: Mendelian randomization analysis
Given the established causal role of blood glucose and insulin in T2D, we investigated additional factors potentially influencing both T2D and MCI. Biomarkers significantly correlated with either condition (|r| > 0.3, p < 0.05), such as direct HDL-C and uric acid, were selected for MR to assess potential causality.
As presented in Table III, IVW MR identified a significant causal link between HDL-C and both outcomes. Genetically higher HDL-C levels were associated with a lower risk of T2D (odds ratio [OR] = 0.9059, 95% CI: 0.8666–0.9470) but a higher risk of MCI (OR = 1.0482, 95% CI: 1.0216–1.0755). These results were consistent across four additional MR methods, reinforcing their reliability (Figures 1 B, C).
Table III
Genetically predicted HDL-C and T2D/MCI risk
MR-Egger analysis revealed significant heterogeneity in HDL-C’s effects on T2D (p = 1.10 × 10⁻⁸) and MCI (p = 0.0367), prompting the use of a multiplicative random-effects IVW model to account for this variability. Tests for horizontal pleiotropy using MR-Egger (p > 0.05) and MR-PRESSO indicated potential pleiotropy but detected no outlier SNPs. Leave-one-out analysis confirmed that the associations were not driven by any single SNP but rather reflected contributions from multiple variants. Supplementary Figure S2 and Supplementary Table SX provide detailed SNP information and MR results for other biomarkers.
Transcriptomic profiling and identification of HDL-C-related targets in T2D
To identify molecular targets linking HDL-C and T2D, transcriptomic analysis was performed using 151 samples from five GEO datasets. Batch effects were corrected before downstream analysis (Supplementary Figures S3 A, B). In total, 552 DEGs were identified in the T2D group compared to non-diabetic (ND) controls, with 232 genes upregulated and 320 downregulated (Figure 1 D). KEGG analysis of the DEGs revealed significant enrichment in pathways such as mitophagy, PI3K-Akt signaling, autophagy, cholinergic synapse, and apoptosis (Supplementary Figure S3 C). In parallel, GSEA demonstrated that these DEGs were closely associated with Alzheimer’s disease (AD) (Figure 1 E), suggesting a potential link between T2D and increased risk of AD.
To further explore HDL-C-related genes implicated in T2D, genes associated with HDL-C (GeneCards relevance score ≥ 1, Supplementary Table SXI) were cross-referenced with T2D DEGs and SNP-annotated loci. This integrative approach identified one candidate gene, NFIA (Figure 1 F), potentially bridging HDL-C regulation with T2D pathogenesis.
Therapeutic effects of MFT on T2D and MCI
Forty participants (17 with T2D and 23 controls) completed the MFT intervention. Baseline characteristics are provided in Supplementary Table SXII. After MFT, significant reductions were observed in BMI (p < 0.0001), fasting blood glucose (FBG; p < 0.0006), and HDL-C (p < 0.0001), while β-hydroxybutyrate (β-HB) levels rose markedly (p < 0.0001) (Figures 2 A–D). FBG decreased more substantially in the T2D group compared to controls (p = 0.0199) (Supplementary Figure S4 A). At 3 and 6 months, HDL-C levels rebounded above both baseline and immediate post-fasting levels (Figures 2 E, F). Cognitive function was assessed using the MoCA (n = 31) and the DSST (n = 27). Baseline MoCA scores were lower in the T2D group than in controls (p = 0.0248) (Figure 2 G). Following MFT, MoCA scores improved significantly overall, with the most pronounced gains observed in T2D patients with MCI (p = 0.0109) (Figure 2 J). DSST scores also improved in this subgroup (p = 0.0237) (Figure 2 I), although group-level changes were not statistically significant (Supplementary Figures S4 B, C). These results indicate that T2D is associated with elevated MCI risk, and that MFT can enhance both metabolic and cognitive outcomes, especially in patients with comorbid T2D and MCI.
Figure 2
Analysis of key indicators before and after MFT. A – BMI (n = 40); B – FBG (n = 40); C – β-HB (n = 40); D – HDL-C (n = 34); E – HDL-C levels were followed up for 3 months (n = 18); F – HDL-C levels were followed up for 3 months (n = 10); G – Baseline MoCA scores (Ctrl: n = 15, T2D: n = 16); H – MoCA score (n = 31); I – DSST scores in T2D&MCI group (n = 8). Data presented as mean } SD; J – MoCA score changes by group (Ctrl: n = 15, T2D: n = 16, MCI: n = 11, T2D&MCI: n = 8); K – NFIA expression in peripheral blood (n = 40). Data presented as mean } SD. *p < 0.05, **p < 0.01, ***p < 0.001, ****p < 0.0001
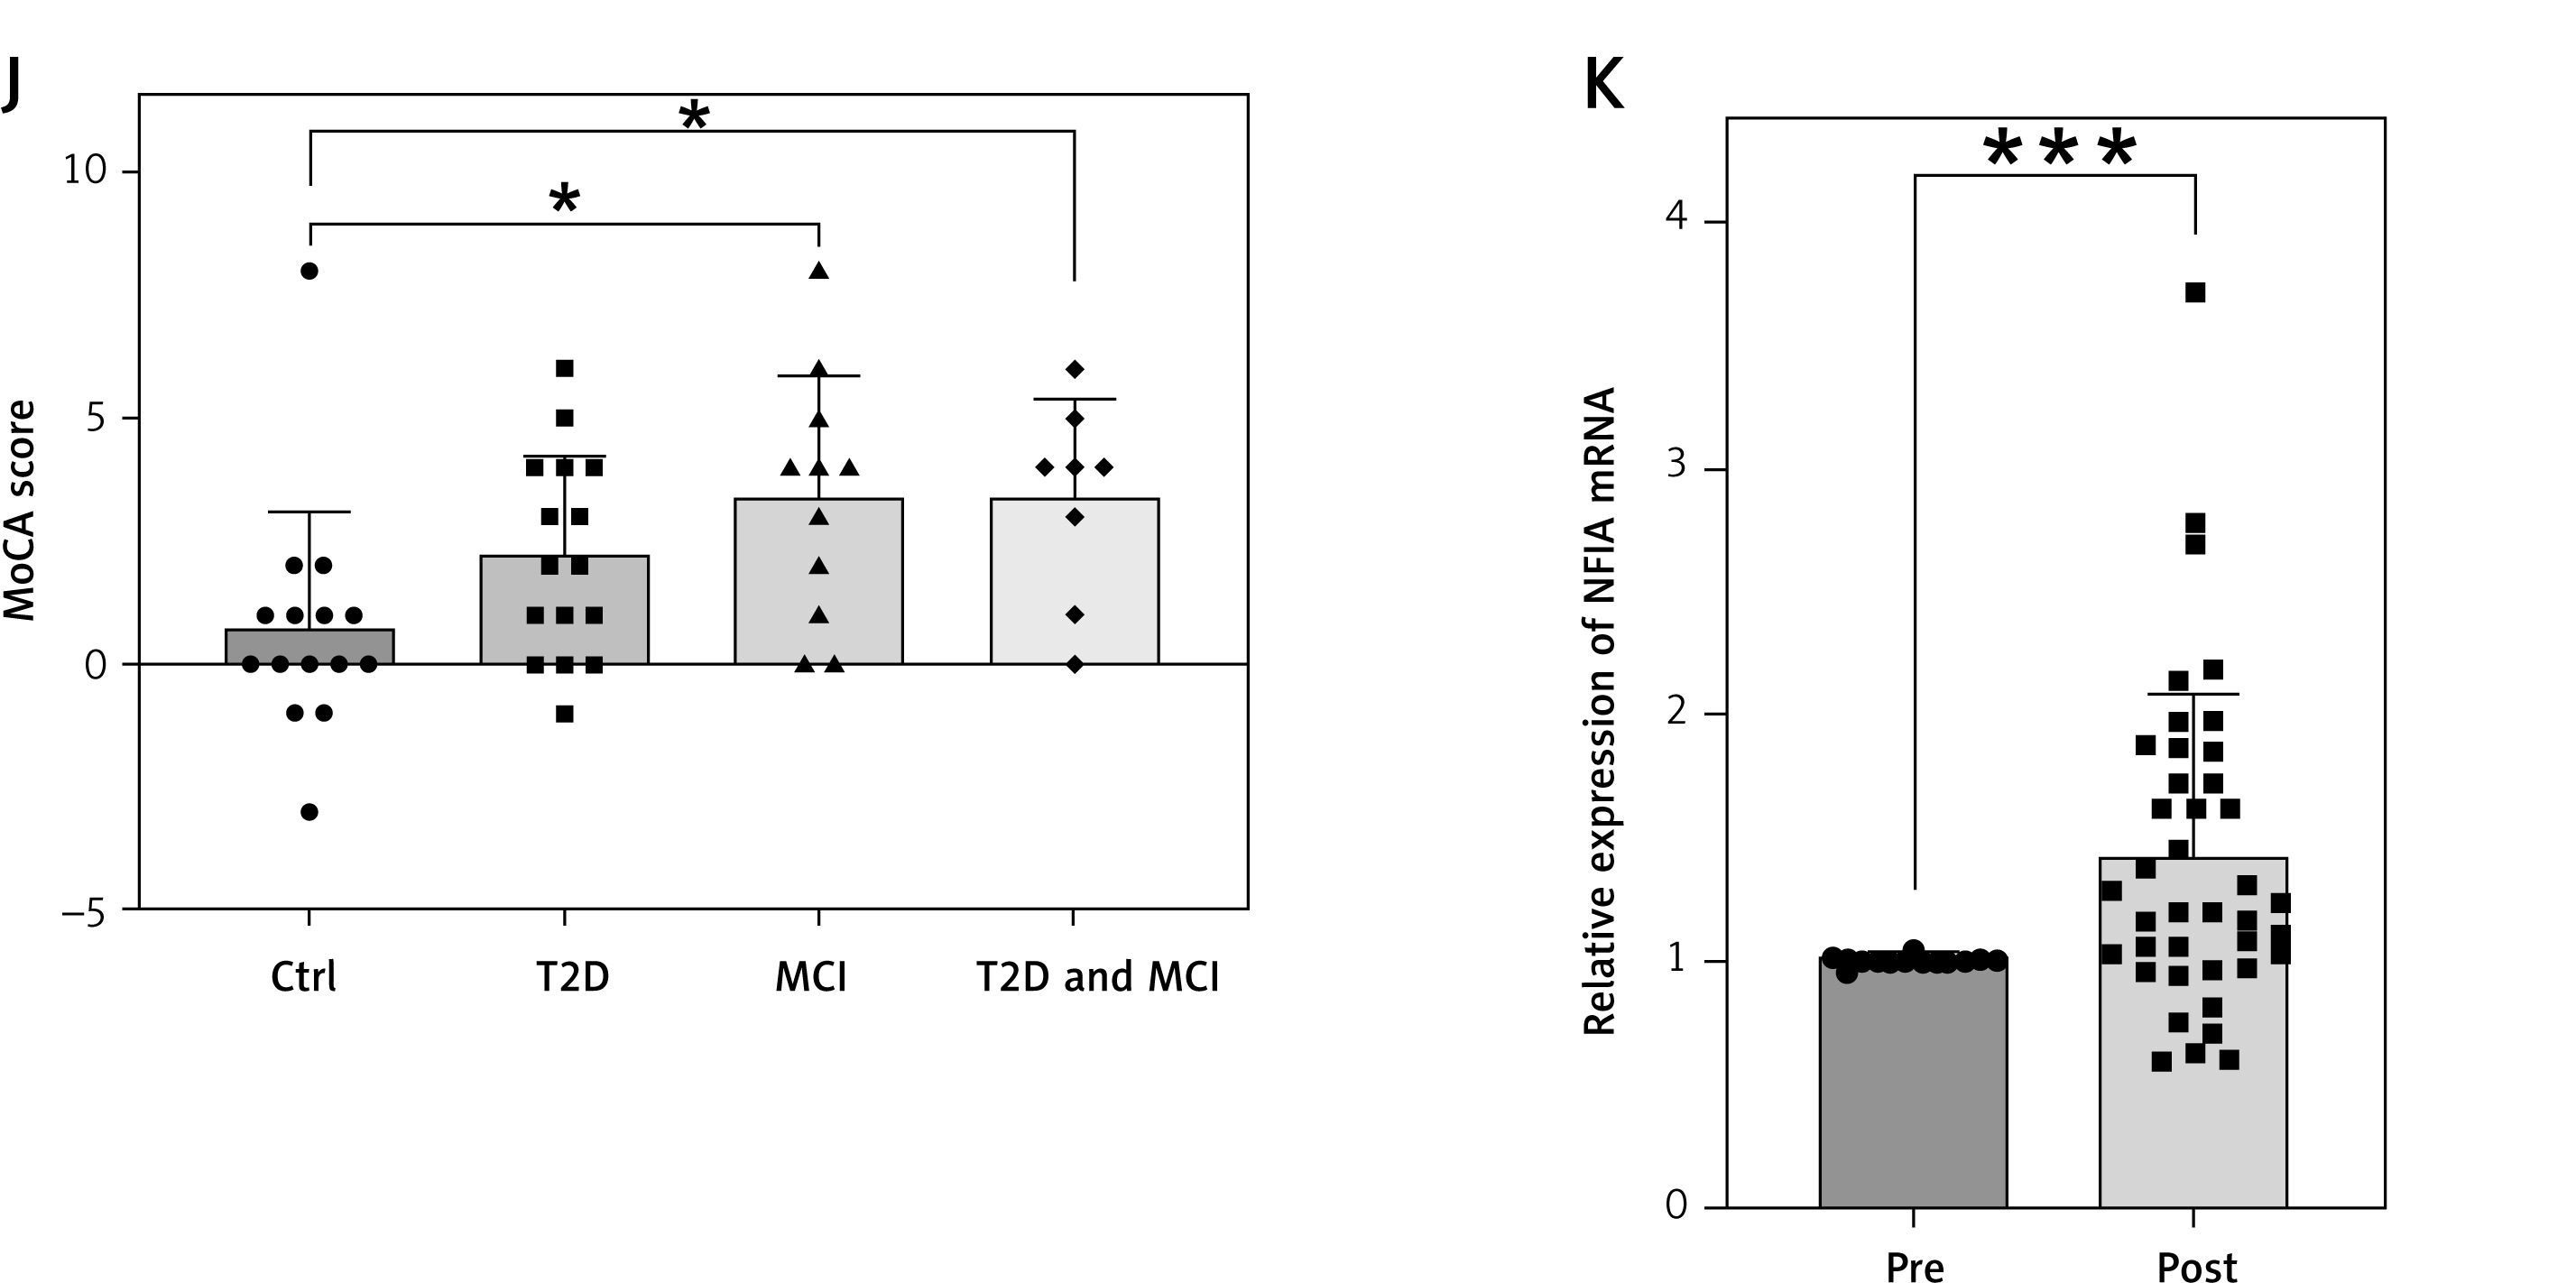
Expression of NFIA, a key gene identified through prior analyses, was significantly upregulated after MFT (p = 0.0002), particularly in participants with T2D (p = 0.0004) and MCI (p = 0.001), whereas changes in controls did not reach statistical significance (p = 0.098) (Figure 2 K, Supplementary Figures S4 D–F).
Transcriptomic analysis of MFT response
Peripheral blood RNA-seq was performed on samples from eleven randomly selected participants (5 T2D and 6 control) before and after MFT. Using thresholds of |log2FC| > 0.3 and p < 0.05, we identified 447 upregulated and 246 downregulated DEGs after MFT (Figure 3 A, Supplementary Table SXIII), with NFIA among the upregulated genes. KEGG enrichment analysis revealed that upregulated DEGs were involved in pathways related to unsaturated fatty acid biosynthesis, fatty acid metabolism, and PI3K-Akt signaling, suggesting that MFT may improve metabolic function and insulin sensitivity through these molecular pathways (Figure 3 B, Supplementary Figure S5).
Figure 3
Transcriptomic and functional validation analyses related to NFIA. A – Volcano plot of DEGs in peripheral blood before and after MFT; B – KEGG enrichment of up-regulated DEGs. Data presented as mean } SD. *p < 0.05; C – HDL-C levels in NFIA-overexpressing (OE-NFIA) HepG2 cells; D–F – Western blotting analysis of NF-κB signaling pathway in OE-NFIA HepG2 cells; G – APOA1 levels in si-NFIA HepG2 cells; H – APOA1 levels in si-NFIA SH-SY5Y cells; I – APOE levels in si-NFIA HepG2 cells; J – APOE levels in si-NFIA SH-SY5Y cells. Data presented as mean } SD. **p < 0.01, ***p < 0.001, ****p < 0.0001
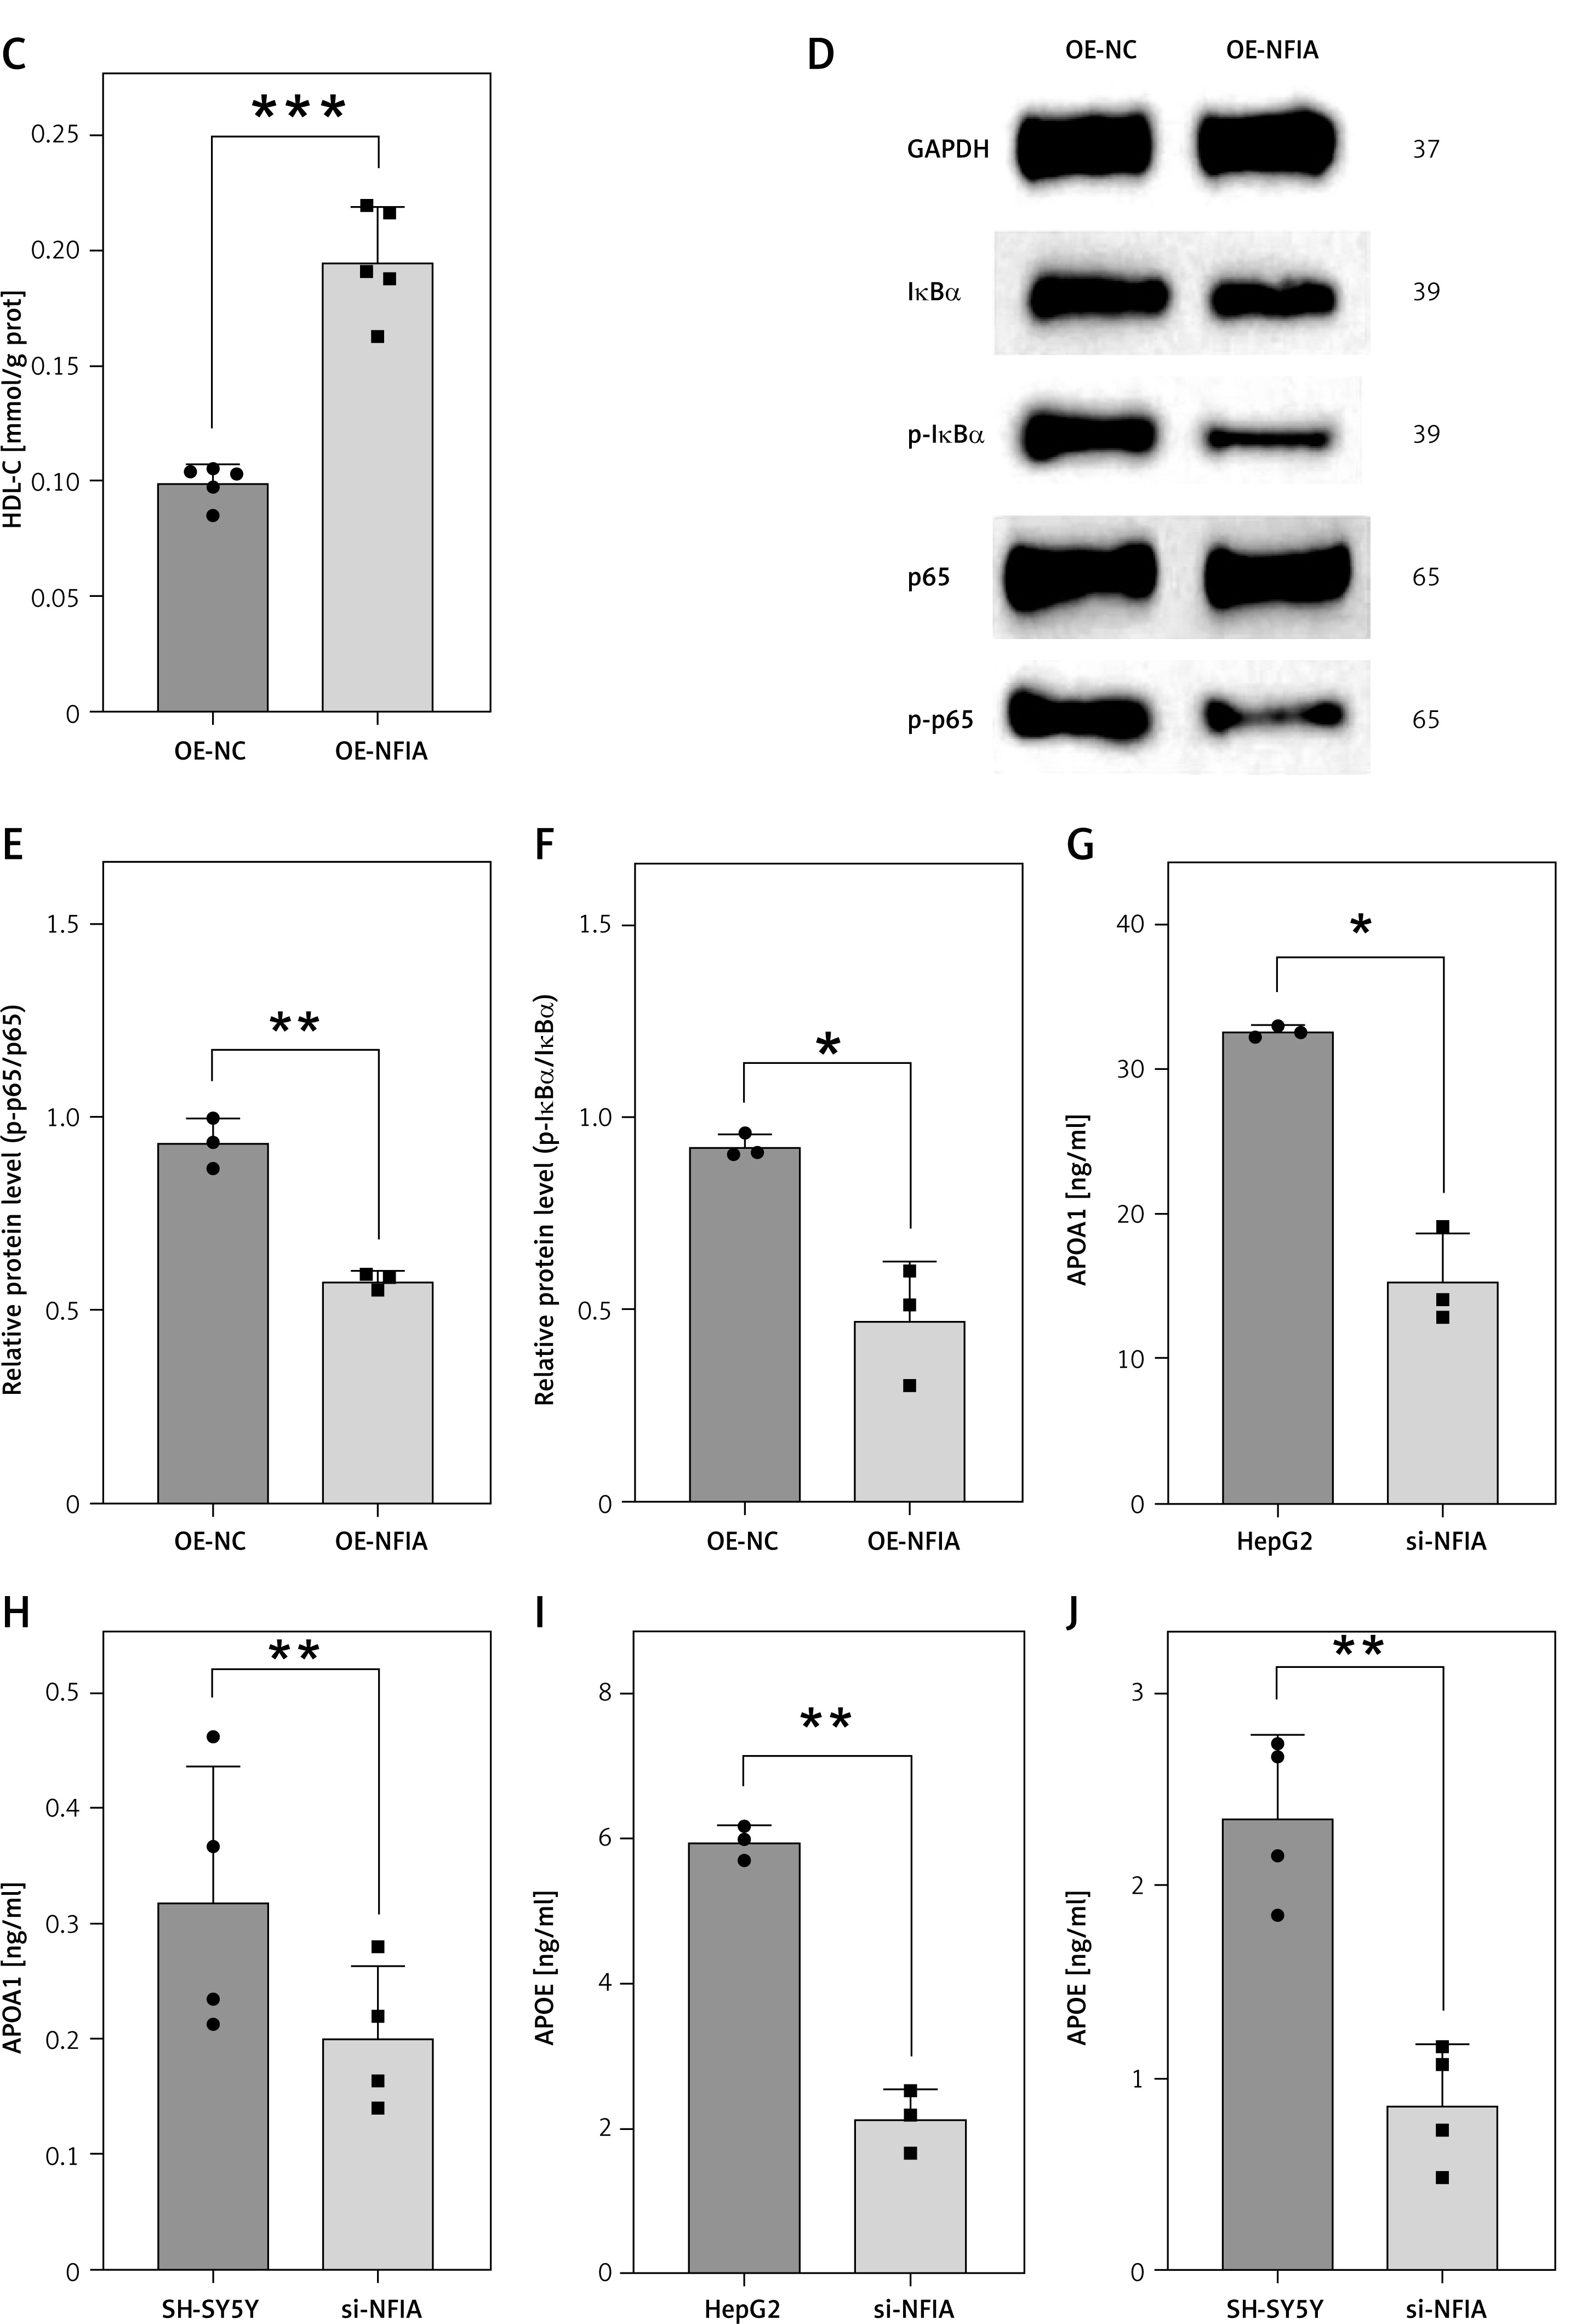
Functional role of NFIA in HepG2 and SH-SY5Y cells
The NFIA gene plays a key role in the regulation of HDL-C, which is primarily synthesized in the liver [24]. To investigate its function, we overexpressed NFIA in HepG2 cells. Overexpression was confirmed via qPCR and Western blotting (Supplementary Figures S6 A, B). Intracellular HDL-C levels were significantly higher in NFIA-overexpressing cells compared to controls (p = 0.0002; Figure 3 C). Additionally, NFIA overexpression reduced phosphorylation of NF-κB p65 and IκBα, indicating inhibition of the NF-κB signaling pathway (Figures 3 D–F). These findings suggest a potential anti-inflammatory mechanism. At the same time, following NFIA knockdown in HepG2 and SH-SY5Y cells (Supplementary Figures S6 C, D), ELISA results showed decreased levels of APOA1 (HepG2: p = 0.0228; SH-SY5Y: p = 0.0014) and APOE (HepG2: p = 0.0097; SH-SY5Y: p = 0.0023) (Figures 3 G–J, Supplementary Figures S6 E, F). These findings suggest that NFIA may play a regulatory role in HDL-C biosynthesis.
Discussion
Mounting evidence indicates a shared pathogenic pathway between T2D and MCI, driven largely by hyperglycemia, chronic inflammation, and neuronal dysfunction [25–27]. Hyperglycemia promotes systemic inflammation, contributing to widespread tissue damage, including the brain.
NHANES data revealed significant differences in serum vitamin D, globulin, and HDL-C levels among individuals with T2D, MCI, and healthy controls. MR analysis showed that genetically elevated HDL-C is associated with a lower risk of T2D but a higher risk of MCI. Vitamin D levels were inversely associated with both conditions. Supplementation may reduce the incidence of T2D and MCI, even in patients with existing diabetes. This protective effect is likely mediated by the regulatory role of vitamin D in insulin signaling, particularly through inhibition of pathways such as NF-κB and TLR4 [28]. Vitamin D receptors in pancreatic β-cells, skeletal muscle, and adipose tissue enhance insulin sensitivity and preserve β-cell function, slowing T2D progression [29]. Additionally, vitamin D supports neuroprotection, calcium balance, antioxidant activity, and anti-inflammatory processes [30]. Clinical studies associate higher serum vitamin D levels in older adults with better cognitive function [31].
An apparent contradiction exists regarding HDL-C. NHANES data suggest that higher HDL-C is protective against MCI, while MR analyses indicate that genetically elevated HDL-C increases MCI risk. This discrepancy stems from methodological differences: MR reflects lifelong genetic exposure and minimizes confounding and reverse causality [32, 33], whereas NHANES offers cross-sectional snapshots influenced by age, lifestyle, and comorbidities [34]. Moreover, HDL composition differs between the central nervous system (CNS) and periphery. CNS HDL includes peripheral APOA1 and glial-derived APOE. The APOE4 isoform, a major genetic risk factor for neurodegeneration, promotes amyloid-β accumulation, tau pathology, and blood–brain barrier disruption [35, 36]. Therefore, if peripheral HDL-C primarily reflects APOA1 rather than APOE, the protective association observed in NHANES remains biologically plausible.
To account for genetic effects driven by APOE, APOEε4-related SNPs were excluded in the two-sample MR analysis. Nonetheless, a direct positive causal relationship between HDL-C and MCI was still observed. This may be attributed to the fact that APOE4 protein levels are regulated not only at the transcriptional level by APOEε4 but also through post-transcriptional mechanisms. While genes involved in these regulatory processes may not directly cause MCI, they could influence disease progression by modulating APOE4 expression. In addition, HDL undergoes post-translational modifications that can generate functionally abnormal forms such as oxidized HDL and acetylated HDL [37, 38]. These altered HDL particles may induce endothelial dysfunction and elevate inflammation through multiple pathways, thereby contributing to neuronal injury and cognitive decline.
Conventional lipid-lowering therapies have limited efficacy in elevating HDL-C. Although niacin can increase HDL-C levels, its use is restricted by adverse side effects. As an alternative, we implemented MFT, a non-pharmacological intervention widely used in the management of obesity and diabetes. MFT enhances fatty acid mobilization and ketone body production, providing an alternative energy source – particularly for the brain – during fasting states [39]. Mild hyperketonemia, induced by fasting or ketogenic diets, has been shown to regulate inflammation, oxidative stress [40], glucose metabolism, insulin sensitivity, and synaptic plasticity [41, 42], thereby improving cognitive and motor function [43, 44]. In our MFT cohort, short-term improvements were observed in FBG, β-HB, and cognitive performance. Although HDL-C levels initially declined after the intervention, they increased significantly at 6 months, consistent with findings reported by Longo and Frigeri [45, 46].
Genome-wide association and transcriptomic analyses identified NFIA as a key regulator of HDL-C metabolism. Following MFT, NFIA expression was markedly upregulated in peripheral blood. NFIA has been shown to enhance circulating HDL-C [47, 48], suppress pro-inflammatory cytokines [49], and protect against hyperglycemia and weight gain in high-fat diet models [50]. It also plays a role in mitigating T2D and obesity-related metabolic dysfunction [47]. In vitro, NFIA overexpression elevated HDL-C levels and inhibited classical NF-κB signaling, suggesting dual roles in lipid regulation and inflammation. These results indicate that MFT may exert its beneficial effects, in part, through NFIA-mediated pathways. Given the lack of effective treatments for MCI, MFT offers a safe and promising strategy with therapeutic potential for both metabolic and cognitive disorders.
Despite the novel association we report between NFIA expression and MCI in T2D, its immediate clinical translatability is limited. NFIA remains a tissue-level transcription factor without validated circulating assays or prospective cohort data supporting its biomarker role. Moreover, the observed relationship between higher HDL-C and increased MCI risk in our cohort likely reflects qualitative HDL dysfunction rather than a true deleterious effect of cholesterol-rich lipoproteins. In T2D, HDL undergoes glycation and oxidative modifications – mediated in part by myeloperoxidase – that impair cholesterol efflux capacity and confer pro-inflammatory properties, potentially exacerbating neuroinflammation and cognitive decline [51, 52]. Thus, future studies should focus on assays of HDL functionality rather than HDL-C levels alone. Finally, although intermittent fasting has garnered considerable interest, large randomized trials demonstrate that its benefits for weight loss and metabolic health are not superior to those achieved by equivalent caloric restriction [53]. However, intermittent fasting may be more feasible over the long term than continuous caloric restriction [54], and Arciero et al. have shown that it is more effective at reducing visceral fat [55]. As such, the mechanistic impact of fasting regimens on HDL quality and neuroprotection in diabetic patients warrants rigorous, targeted investigation.
This study has several limitations. First, in the NHANES analysis, the number of participants who completed the DSST cognitive test was limited, resulting in a smaller MCI group compared to the T2D group. Second, the clinical study of MFT lacked longitudinal cognitive follow-up, which precluded the evaluation of its long-term effects on memory.
In conclusion, we identified HDL-C as an independent factor associated with both T2D and MCI, and observed significant alterations in NFIA expression among individuals with T2D. MFT, a non-pharmacological dietary intervention, was found to upregulate NFIA, leading to sustained increases in HDL-C, suppression of NF-κB signaling, and concurrent improvements in glycemic control and cognitive performance – particularly in T2D patients with MCI. These results suggest that NFIA and HDL-C may serve as dual biomarkers for early detection of metabolic-cognitive comorbidity. MFT offers a safe, practical approach to modulate this pathway. Further longitudinal studies in diverse populations are warranted to validate these findings and assess the potential of NFIA-targeted strategies in personalized prevention and treatment of T2D and MCI.