

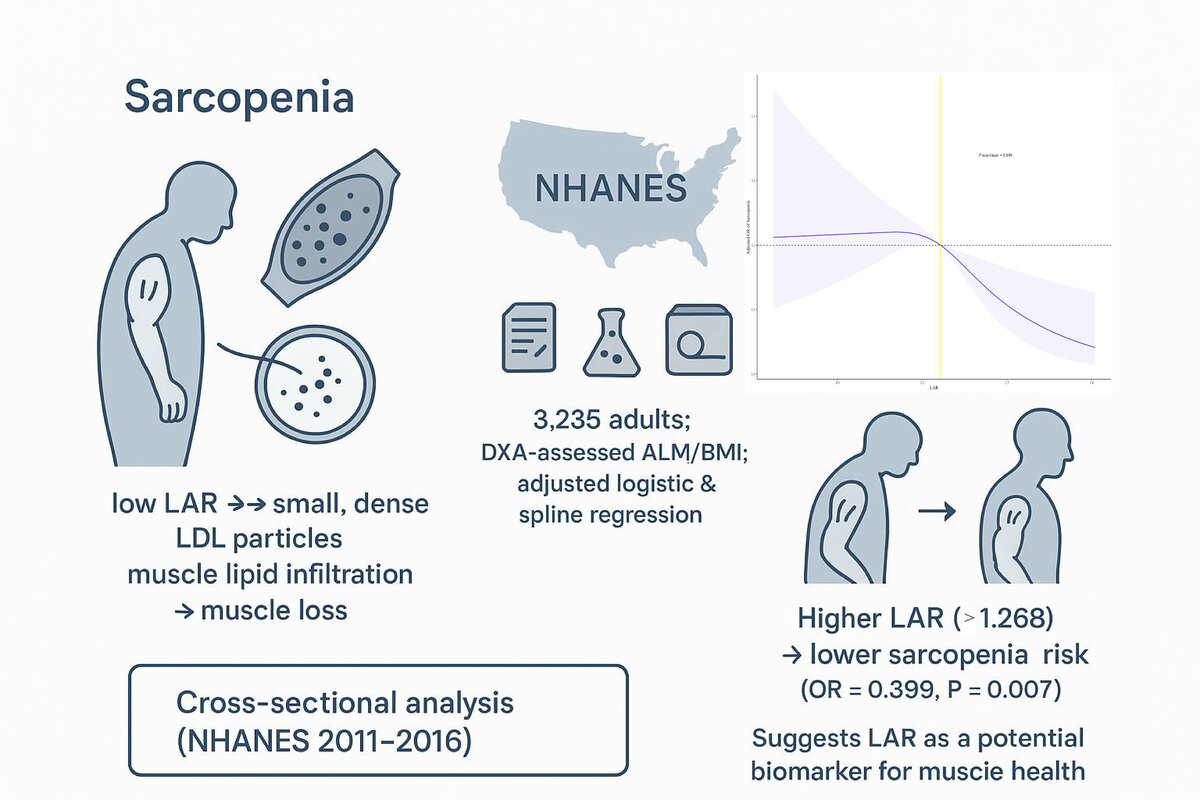
Introduction
Sarcopenia, a progressive and systemic syndrome characterized by the loss of skeletal muscle mass, strength, and function, has emerged as a critical public health challenge in aging populations. It is strongly associated with adverse clinical outcomes, including increased fracture risk, diminished quality of life, mobility impairment, and elevated mortality [1, 2]. While traditionally linked to aging, its prevalence is rising among younger individuals, likely driven by modern sedentary lifestyles and metabolic dysregulation [3, 4]. The pathophysiology of sarcopenia is multifactorial, encompassing hormonal imbalances, chronic inflammation, oxidative stress, and dysregulation in lipid metabolism [5, 6]. Among these factors, dyslipidemia – a hallmark of metabolic syndrome – has gained attention for its potential role in accelerating muscle deterioration, though the mechanisms remain incompletely understood [7, 8].
Conventional lipid markers, such as low-density lipoprotein cholesterol (LDL-C), have been implicated in sarcopenia risk. Elevated LDL-C levels correlate with reduced muscle strength and mass, possibly due to lipid accumulation in muscle tissue, which promotes lipotoxicity, mitochondrial dysfunction, and insulin resistance [9, 10]. However, LDL-C alone fails to capture the atherogenic heterogeneity of lipoprotein particles, which vary in size, density, and apolipoprotein composition. The LDL-C/apolipoprotein B (ApoB) ratio (LAR) has emerged as a superior indicator of cardiovascular risk, reflecting the cholesterol content per atherogenic particle [11, 12]. ApoB, a structural component of very-low-density lipoprotein (VLDL), intermediate-density lipoprotein (IDL), and LDL particles, provides a direct measure of circulating atherogenic particle count. A lower LAR signifies smaller, denser LDL particles with heightened atherogenic potential, whereas a higher ratio suggests larger, cholesterol-enriched particles [13, 14]. Beyond cardiovascular disease, this ratio may also offer insights into metabolic disturbances influencing muscle homeostasis. For instance, dysfunctional lipid metabolism could exacerbate sarcopenia through pathways such as oxidative stress, inflammation, and impaired myocyte repair [15, 16]. Despite its clinical relevance, the relationship between LAR and sarcopenia remains unexplored, representing a critical gap in understanding how lipid particle characteristics intersect with muscle health.
Recent advancements in lipid biomarkers have highlighted the utility of novel ratios, such as the non-high-density lipoprotein cholesterol to high-density lipoprotein cholesterol ratio (NHHR), in predicting sarcopenia risk. Yang and Zhong [17] demonstrated that elevated NHHR independently correlates with sarcopenia prevalence, underscoring the importance of balancing atherogenic and antiatherogenic lipid fractions. Similarly, the triglyceride (TG) to high-density lipoprotein cholesterol (HDL-C) ratio has been linked to muscle loss, suggesting that lipid ratios capturing systemic metabolic dysregulation may serve as robust predictors of sarcopenia [18, 19]. Building on these findings, the LAR – a marker of lipoprotein quality – warrants investigation as a potential biomarker for sarcopenia. Its ability to differentiate between cholesterol-rich and particle-dense LDL subsets could elucidate distinct pathways through which dyslipidemia contributes to muscle atrophy. For example, smaller LDL particles may exhibit greater propensity for infiltration into muscle tissue, inducing endoplasmic reticulum stress and activating proteolytic pathways, while cholesterol overload may impair mitochondrial b-oxidation, reducing energy availability for muscle maintenance [20, 21].
This study leverages data from National Health and Nutrition Examination Survey (NHANES), a nationally representative, cross-sectional survey of the non-institutionalized US population, to explore the association between LAR and sarcopenia in U.S. adults. We hypothesize that a lower LAR, indicative of atherogenic lipoprotein profiles, is associated with higher sarcopenia risk.
Material and methods
Ethical considerations
This study involving human participants, biological materials, and associated data was conducted in compliance with the Declaration of Helsinki. The protocol received ethical approval from the National Center for Health Statistics (NCHS) Institutional Review Board. Written informed consent was obtained from all participants prior to their inclusion in the research.
Study population
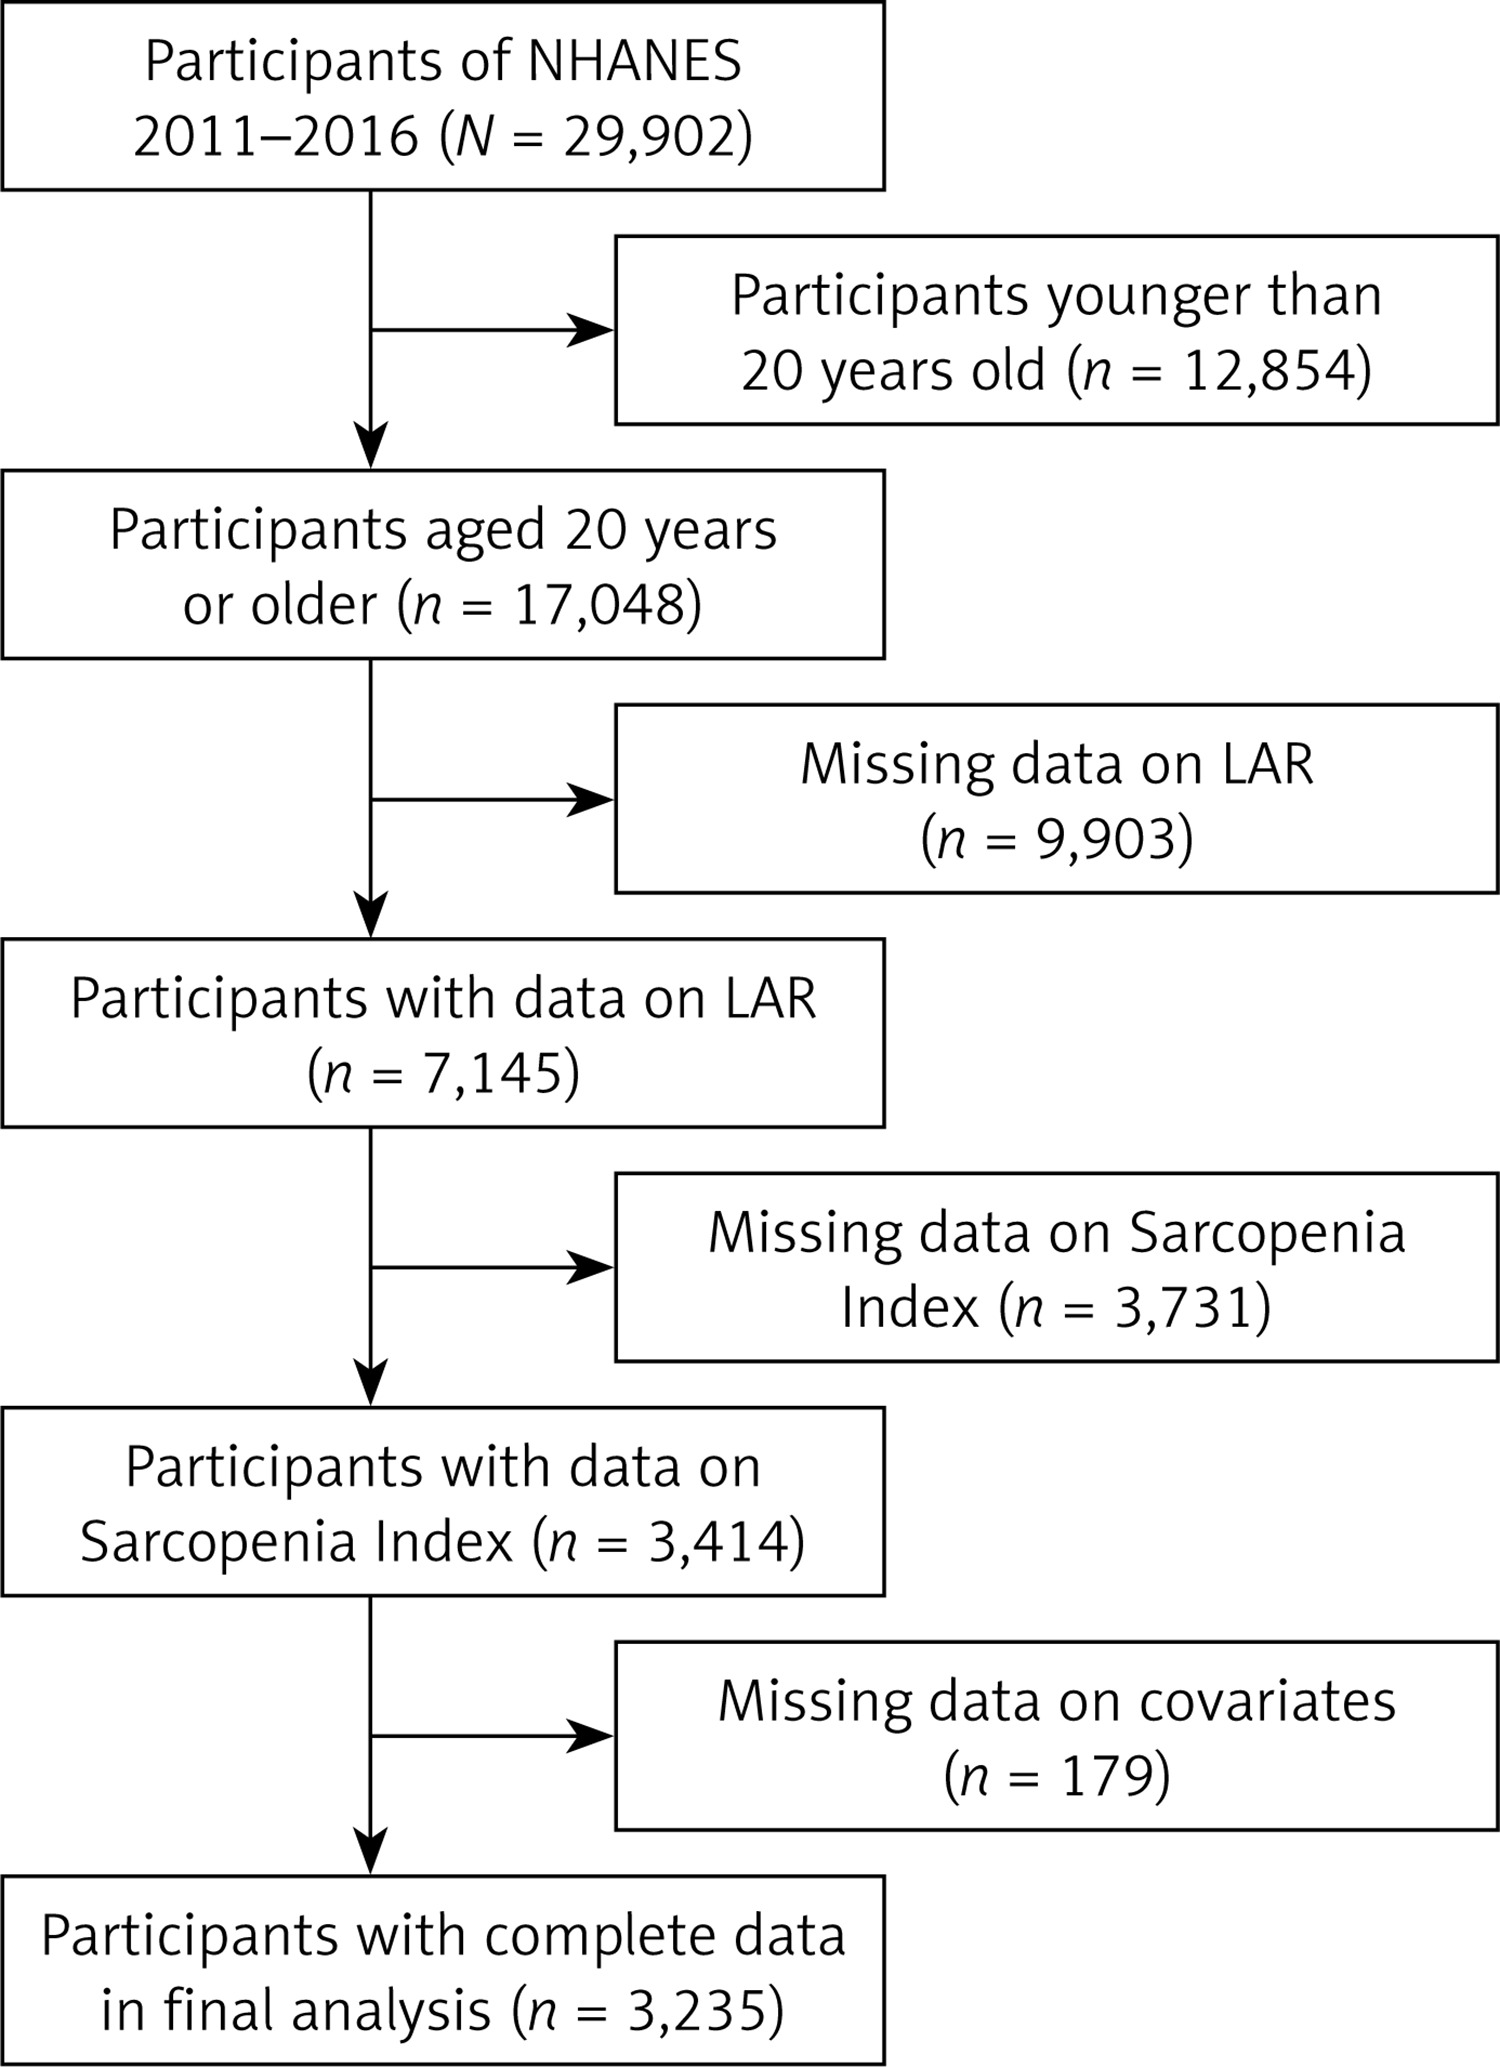
This cross-sectional study used data from the nationally representative NHANES conducted between 2011 and 2016. The study protocol was approved by the Ethics Review Board of the National Center for Health Statistics, and all participants provided written informed consent. Initially, the NHANES 2011–2016 included 29,902 participants. However, several exclusion criteria were applied: individuals under 20 years of age (n = 12,854), those with incomplete LAR data (n = 9,903), participants lacking dual-energy X-ray absorptiometry (DXA) data (n = 3,731), and those with missing covariate information (n = 179). Individuals under 20 years of age were excluded as the core adult data on muscle health and fasting lipid profiles in NHANES are primarily collected for participants aged 20 and above. After these exclusions, the final analytical sample comprised 3,235 participants (Figure 1). The detailed baseline characteristics of the included participants are presented in the Results section.
Assessment of LAR (exposure)
Low-density lipoprotein cholesterol with apolipoprotein B ratio was determined based on the lipid profiles of the participants. All subjects were required to provide fasting blood samples following a standardized protocol. ApoB concentrations were measured using immunonephelometry. LDL-C was calculated using the Friedewald formula: LDL-C = total cholesterol – HDL-C – triglycerides/5. The assays were performed using a Roche Cobas 6000 or Roche Modular P Chemistry Analyzer.
Sarcopenia assessment (outcome)
In this study, sarcopenia was defined as the primary outcome. It was evaluated by measuring appendicular lean mass (ALM), which is the combined muscle mass of the four limbs [22]. ALM was assessed using DXA, a method that offers a comprehensive and precise evaluation of muscle mass and composition, in accordance with NHANES protocols. Participants who were taller than 192.5 cm, weighed more than 136.4 kg, or were pregnant were excluded due to equipment limitations for DXA scanning. The sarcopenia index was calculated by normalizing ALM to body mass index (BMI), resulting in an ALM/BMI ratio. Sarcopenia was identified using sex-specific thresholds for the sarcopenia index, with values < 0.789 for men and < 0.512 for women indicating the presence of the condition [22].
Potential covariates
Covariates were selected based on previous literature [17] and theoretical considerations regarding their potential association with both LAR levels and sarcopenia prevalence. Demographic variables included gender (male, female), age groups (20–39 years, ≥ 40 years), race/ethnicity (Mexican American, non-Hispanic White, non-Hispanic Black, Other Hispanic, other races), and education level (less than 9th grade, 9–11th grade, high school graduate, some college or Associate’s degree, and college graduate or above). Marital status included categories: never married, married, living with partner, separated, divorced, and widowed. The poverty income ratio (PIR) was divided into two groups: below 1.3 and 1.3 or above. Anthropometric measurements included BMI (classified as normal weight, overweight, or obese). Smoking status was categorized as current, past, or never, and alcohol consumption was dichotomized based on having at least 12 drinks per year. Age was categorized into 20–39 and ≥ 40 years to examine potential differences in muscle mass and metabolic profiles between young adulthood and middle/older age.
Statistical analysis
Participants were categorized based on the presence or absence of sarcopenia. Continuous variables were expressed as medians with interquartile ranges (IQR) and categorical variables as frequencies with percentages. To compare continuous variables, Student’s t-test was used for normally distributed data, while the Mann-Whitney U test was applied for non-normally distributed data. χ2 tests assessed categorical differences between groups.
Multivariate logistic regression was used to evaluate the independent relationship between LAR and sarcopenia, with odds ratio (OR) and 95% confidence intervals (CI) reported. For linear trends, LAR was divided into quartiles, with the lowest quartile as the reference group. Three models were applied: model 1 – unadjusted, model 2 – adjusted for age and gender, and model 3 – adjusted for race, education, marital status, smoking, and alcohol use. Participants were also stratified into two groups based on initial LAR values above or below 1.2 to further investigate the relationship between LAR and sarcopenia [23]. Non-linear relationships between LAR and sarcopenia risk were evaluated using restricted cubic spline (RCS) regression. Subgroup analyses and interaction tests further explored variations across subgroups.
Statistical analyses were performed with R statistical software (version 4.3.3; R Foundation for Statistical Computing). The primary R packages used in our analysis include: survey, haven, tidyverse, gtsummary, arsenal, and rms. A two-tailed p-value threshold of 0.05 was adopted for determining statistical significance throughout the study.
Results
Baseline characteristics
This study comprised 3,235 participants, of whom 1,574 were male (48.66%), and the median age was 39 (29–49) years. In total, 91.68% (2,966) and 8.32% (269) of the participants were distributed in the normal group and sarcopenia group, respectively (Table I). The median LAR value was significantly lower (p < 0.001) in patients with sarcopenia (1.23; IQR: 1.13–1.31) compared to those without sarcopenia (1.27; IQR: 1.17–1.37). Additionally, non-sarcopenia participants were more likely to have low education levels, low annual family income, be a current drinker and smoker, have high BMI, and so on. However, there was no statistically significant difference in gender between people with and without sarcopenia.
Table I
Baseline characteristics of the study population
Multivariable logistic regression analysis
As shown in Table II, weighted logistic regression analysis was used to explore the association between LAR and sarcopenia. When LAR was analyzed as a continuous variable, each unit increase in LAR was associated with a reduction in the OR by 79.1%, 78.3%, and 60.1% for the occurrence of sarcopenia from model 1 to model 3, respectively.
Table II
Association between prevalence of sarcopenia and LAR as continuous and categorical variables
| Characteristic | Model 1† | Model 2‡ | Model 3§ | ||||||
|---|---|---|---|---|---|---|---|---|---|
| OR | 95% CI | P-value | OR | 95% CI | P-value | OR | 95% CI | P-value | |
| LAR | 0.209 | 0.124, 0.351 | < 0.001 | 0.217 | 0.128, 0.368 | < 0.001 | 0.399 | 0.224, 0.712 | 0.007 |
| LAR group: | |||||||||
| < 1.2 | — | — | — | — | — | — | |||
| ≥ 1.2 | 0.654 | 0.522, 0.818 | < 0.001 | 0.654 | 0.520, 0.822 | < 0.001 | 0.789 | 0.632, 0.986 | 0.038 |
| LAR Quartile: | |||||||||
| Q1 | — | — | — | — | — | — | |||
| Q2 | 0.865 | 0.637, 1.176 | 0.348 | 0.881 | 0.648, 1.199 | 0.413 | 0.971 | 0.690, 1.367 | 0.863 |
| Q3 | 0.734 | 0.545, 0.987 | 0.041 | 0.743 | 0.554, 0.997 | 0.048 | 0.935 | 0.686, 1.275 | 0.664 |
| Q4 | 0.406 | 0.303, 0.544 | < 0.001 | 0.406 | 0.297, 0.554 | < 0.001 | 0.560 | 0.408, 0.771 | < 0.001 |
When subjects were categorized into two groups based on whether their baseline LAR was above or below 1.2, individuals in the higher LAR group exhibited a 34.6%, 34.6%, and 21.1% decreased risk of sarcopenia incidence from model 1 to model 3, respectively. After LAR was transformed into a categorical variable by quartiles, individuals in the highest quartile (Q4) exhibited a lower risk of sarcopenia incidence in a fully adjusted model (OR – 0. 560, 95% CI: 0.408–0.771, p < 0.001) compared to those in the lowest quartile (Q1).
Analysis of RCS regression
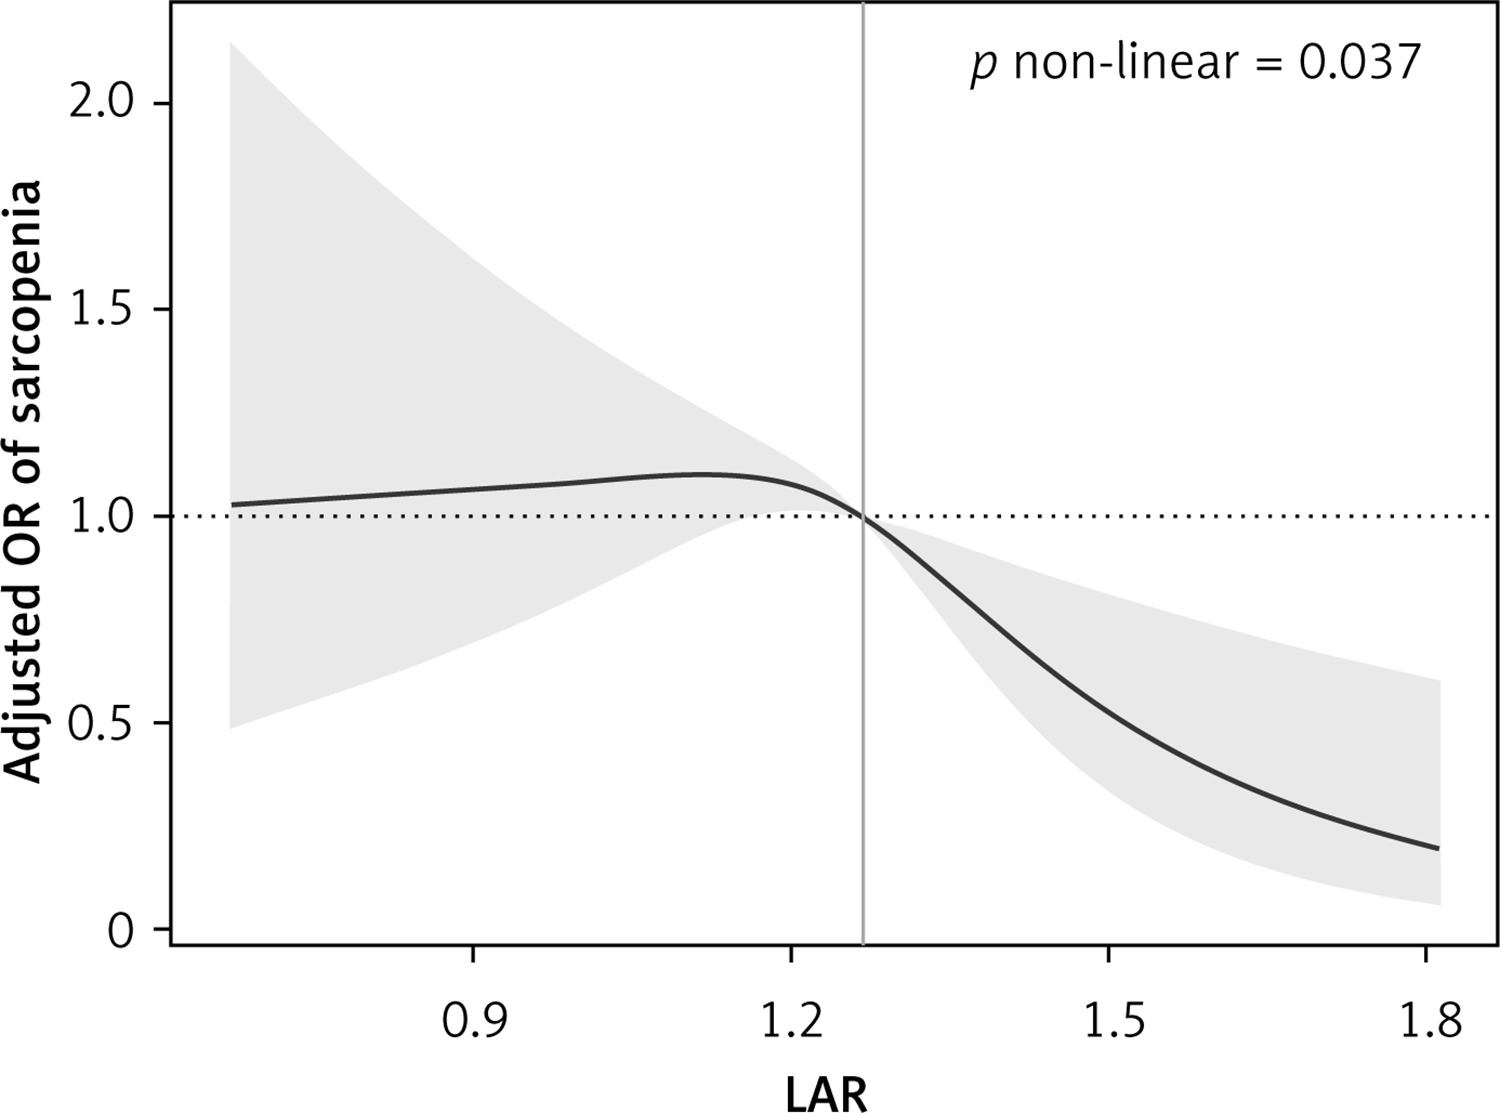
In restricted cubic spline regression, after the adjustment of potential covariates, a horizontally flipped J-shaped and significant non-linear relationship between LAR and sarcopenia (pnon-linear = 0.037) was detected (Figure 2), suggesting a threshold effect at higher LAR levels. Then, we conducted a segmented regression analysis, categorizing LAR into two groups based on the inflection point (≤ 1.268 vs. > 1.268). For individuals with LAR ≤ 1.268, the adjusted OR was 1.030 (95% CI: 0.221–4.799, p = 0.969), indicating no significant association with sarcopenia risk in this range. In contrast, LAR > 1.268 was strongly associated with reduced risk (OR = 0.039, 95% CI: 0.003–0.555, p = 0.018) (Table III).
Subgroup analyses
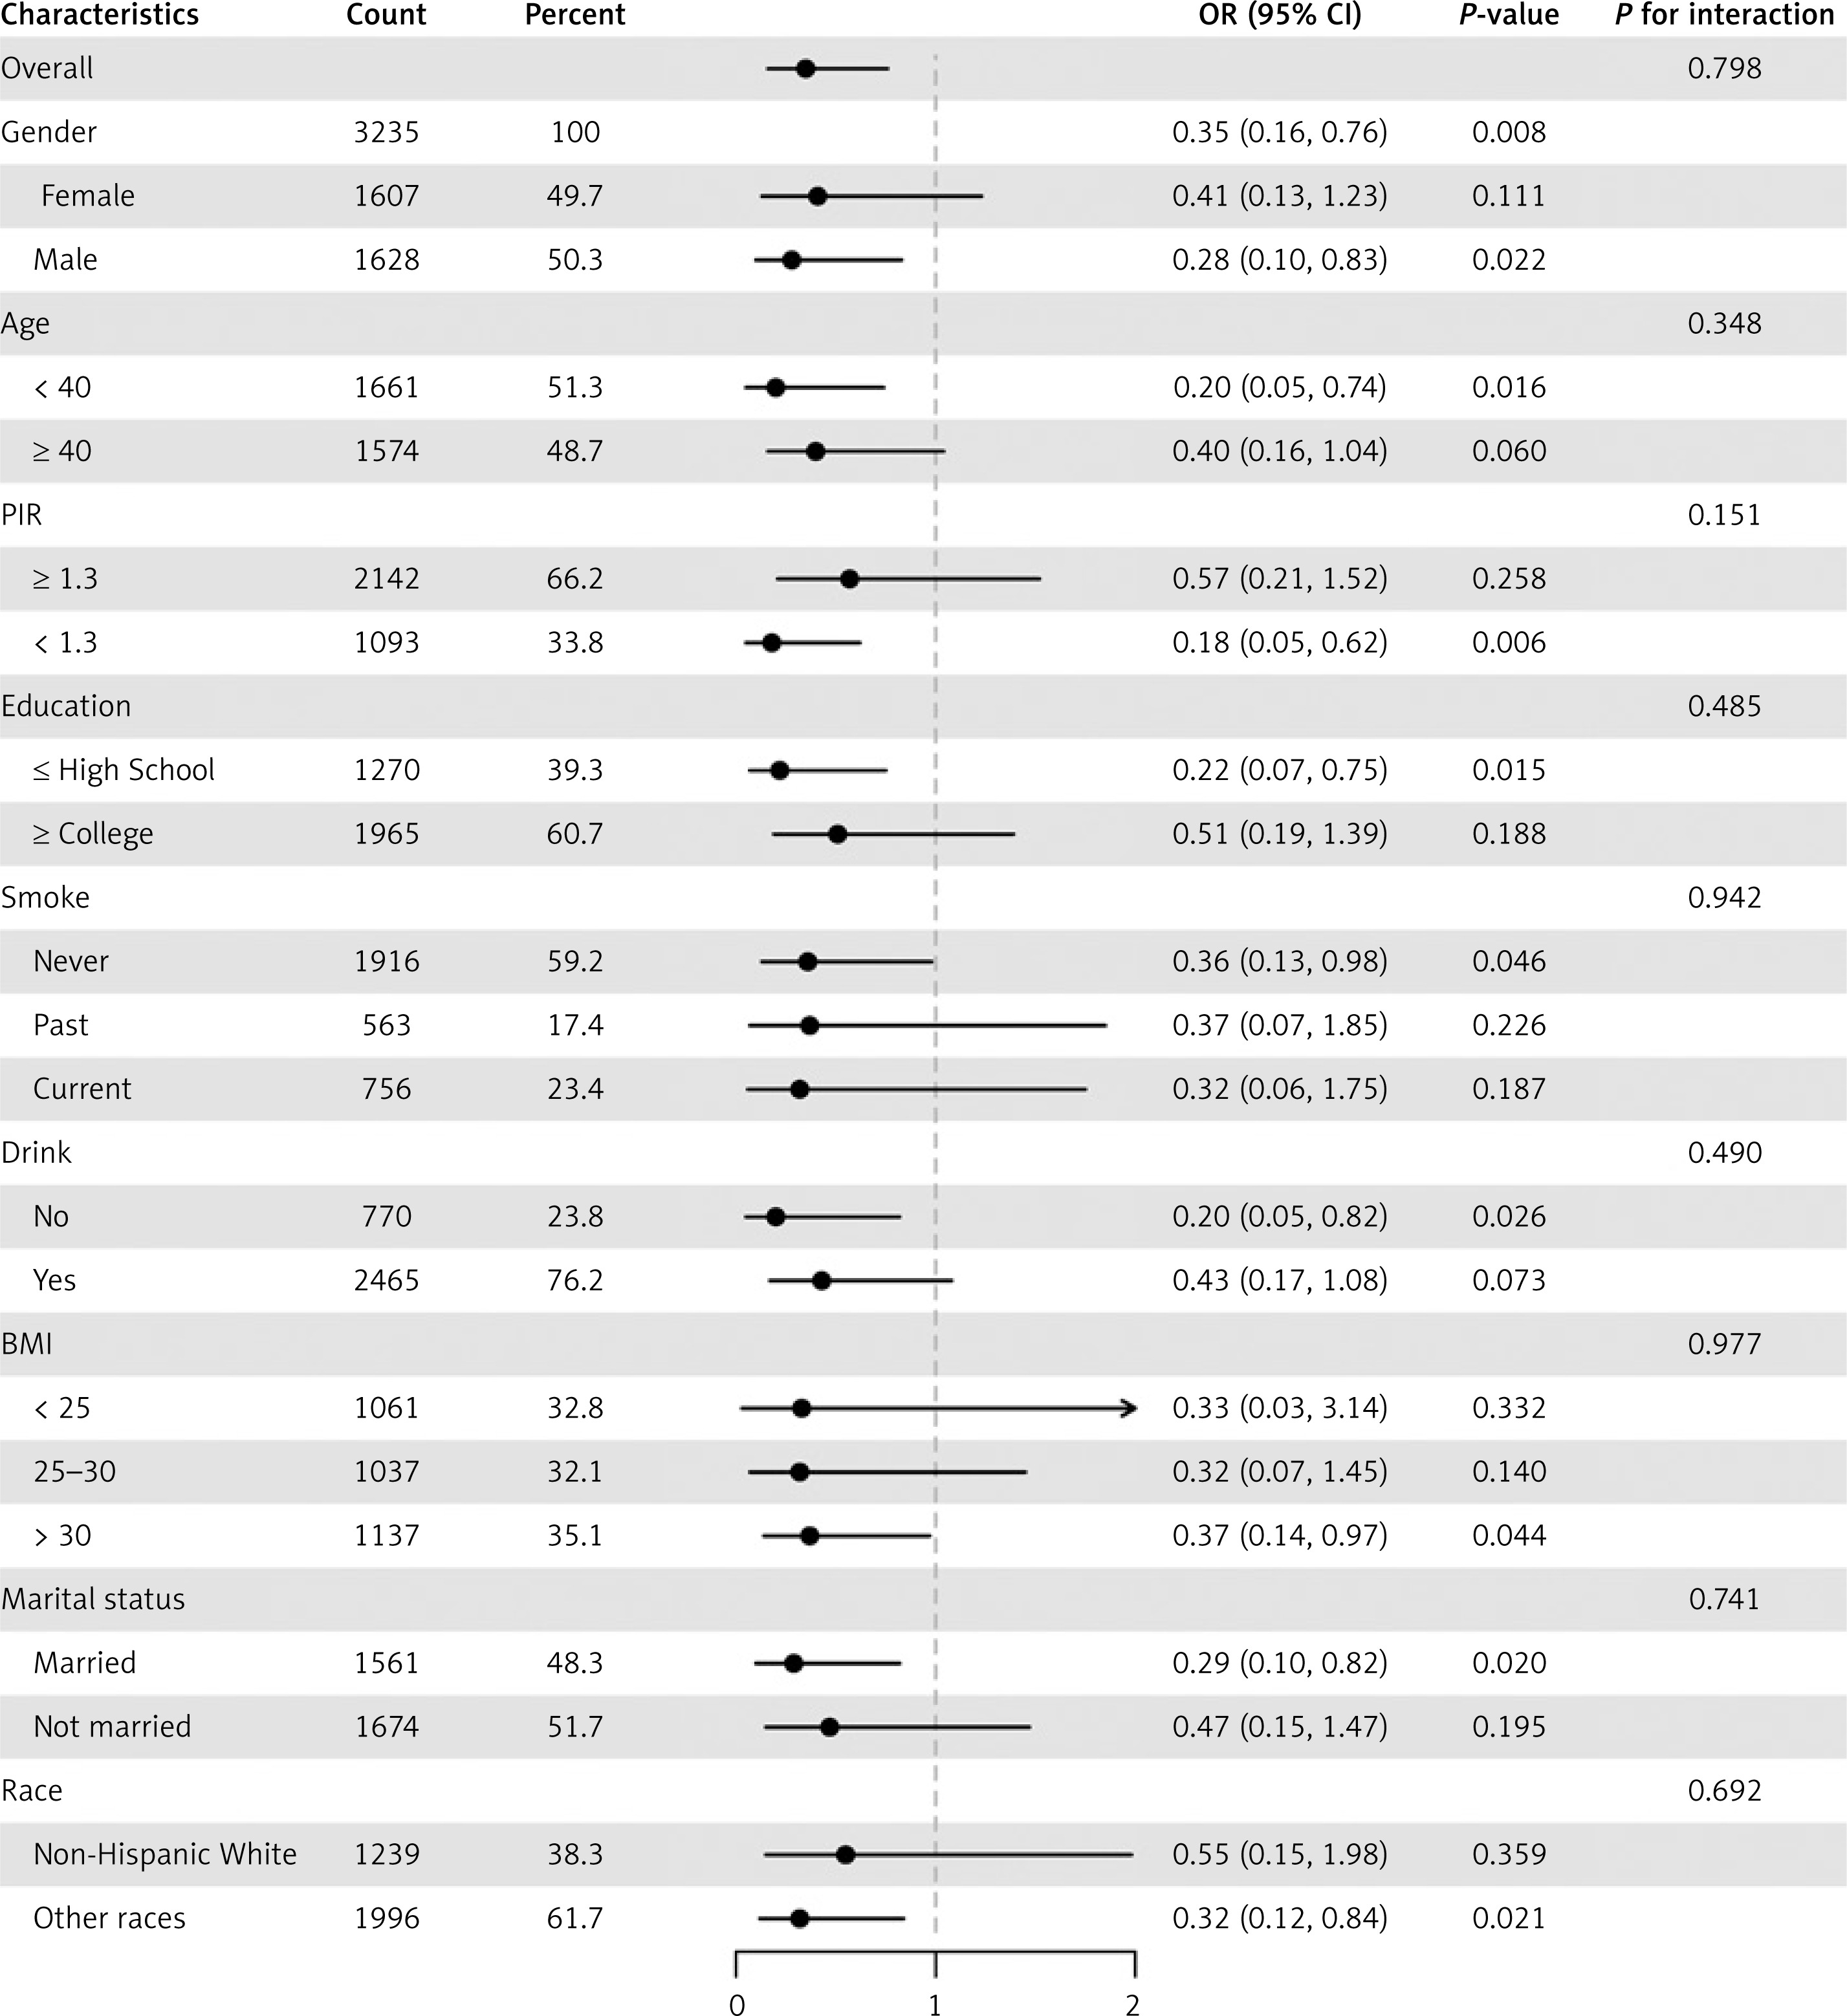
The subgroup analyses were conducted in order to scrutinize the reliability and robustness of the relationship between LAR and sarcopenia across different subgroups. The aim was to uncover potential disparities in the association between LAR and sarcopenia risk within specific demographic contexts, including gender, age, PIR, education level, smoking status, alcohol consumption, BMI, marital status, and race. Additionally, interaction tests revealed that such an association between LAR and sarcopenia was not modified by other covariates (all p for interaction > 0.05) (Figure 3).
Discussion
This cross-sectional study of 3,235 U.S. adults revealed a significant association between elevated LAR and decreased sarcopenia risk. Participants in the highest quartile of LAR exhibited a lower risk of sarcopenia compared to the lowest quartile. The RCS analysis further demonstrated a non-linear relationship. These findings are consistent with emerging evidence associating dysregulation of lipid metabolism with the deterioration of muscle health [5, 7].
The observed association between LAR and sarcopenia likely reflects the interplay between atherogenic lipoproteins and skeletal muscle pathophysiology. Smaller, denser LDL particles – indicated by a lower LAR – are more prone to oxidative modification and endothelial permeation, enabling their infiltration into muscle tissue [20]. These processes accelerate muscle protein degradation, a hallmark of sarcopenia [10]. Excess cholesterol deposition in muscle mitochondria disrupts electron transport chain efficiency, leading to reactive oxygen species (ROS) overproduction and subsequent oxidative damage to myofibers [21].
The role of reverse cholesterol transport (RCT) in muscle health warrants attention. HDL-C facilitates RCT by shuttling excess cholesterol from peripheral tissues, including muscle, to the liver for excretion. Reduced HDL-C levels – common in individuals with elevated LAR – may compromise this process, leading to cholesterol accumulation in muscle cells. Preclinical studies suggest that impaired RCT disrupts membrane fluidity and signaling in myocytes, hindering muscle contraction and repair [24]. These mechanisms collectively highlight how LAR serves as a proxy for both lipid toxicity and metabolic inflammation, two key drivers of sarcopenia.
The present study identified a significant non-linear association between the LAR and sarcopenia risk, with a threshold effect observed at higher LAR levels. This finding suggests that the relationship between LAR and sarcopenia is not uniform across the spectrum of LAR values but rather follows a horizontally flipped J-shaped pattern, where only individuals exceeding the inflection point exhibit a clinically meaningful reduction in sarcopenia risk. These results align with emerging evidence highlighting non-linear relationships between metabolic biomarkers and musculoskeletal outcomes. The observed threshold effect may reflect biological mechanisms wherein higher LAR levels signify a predominance of larger, cholesterol-enriched LDL particles over smaller, denser atherogenic particles. Larger LDL particles have been linked to improved metabolic flexibility and reduced systemic inflammation, which could indirectly preserve muscle mass and function by mitigating chronic low-grade inflammation – a known contributor to sarcopenia pathogenesis [1, 25]. Furthermore, ApoB, a key component of LAR, serves as a surrogate for lipoprotein particle number. A lower ApoB concentration relative to LDL-C (i.e., higher LAR) may indicate reduced atherogenic burden, potentially creating a metabolic milieu favorable to muscle homeostasis [26].
Subgroup analyses revealed nuanced variations in the association between LAR and sarcopenia risk across demographic and lifestyle factors (Figure 3). The protective effect of higher LAR was particularly pronounced in males, individuals aged < 40 years, those with a PIR < 1.3, non-drinkers, and individuals with obesity. Notably, the association remained significant among other races (p = 0.021), though the interaction terms for race, gender, and other covariates were statistically non-significant (p for interaction > 0.05), suggesting potential homogeneity in the threshold effect across subgroups despite differing baseline risks.
The stronger protective association observed in younger adults and socioeconomically disadvantaged groups (lower PIR and education levels) may reflect age- and environment-dependent metabolic adaptations. For instance, younger individuals often exhibit more efficient lipid metabolism, potentially amplifying the beneficial effects of higher LAR on muscle preservation [1]. Similarly, socioeconomic stressors in disadvantaged groups could exacerbate inflammation and oxidative stress, making the anti-inflammatory properties of larger LDL particles (indicated by higher LAR) more critical for mitigating sarcopenia risk. The lack of significant interactions, however, implies that the threshold effect of LAR operates independently of these demographic factors, emphasizing its broad relevance as a biomarker.
Our findings extend prior research on lipid biomarkers and sarcopenia. Yang and Zhong [17] demonstrated that the NHHR independently predicts sarcopenia, emphasizing the balance between atherogenic and antiatherogenic lipids. Similarly, Lin et al. [8] identified TG/HDL-C as a predictor of muscle loss. While these ratios broadly reflect dyslipidemia, the LAR offers unique insights into lipoprotein particle quality. ApoB quantifies the number of atherogenic particles (VLDL, IDL, LDL), whereas LDL-C measures the cholesterol content within these particles. Thus, a lower LAR signifies a predominance of small, dense LDL particles – each carrying less cholesterol but exhibiting greater oxidative susceptibility and tissue penetrance [11]. Future studies could incorporate more detailed NHANES questionnaire data on aspects such as dietary patterns and physical activity to provide a more comprehensive understanding of the mechanisms linking LAR to sarcopenia.
This study benefits from a large, nationally representative sample, rigorous adjustment for confounders, and standardized sarcopenia assessment using DXA. However, several limitations warrant caution. First, the cross-sectional design precludes causal inference. Reverse causation – where sarcopenia exacerbates dyslipidemia via reduced physical activity and altered energy metabolism – cannot be ruled out. Longitudinal studies were required to further clarify the causal relationships underpinning our findings. Second, residual confounding may persist due to unmeasured factors such as dietary patterns (e.g., saturated fat intake), genetic predispositions (e.g., APOE polymorphisms), or subclinical inflammation. Future studies should aim to account for additional previously unmeasured confounders (e.g., dietary patterns, genetic predispositions) to minimize this residual confounding risk. Third, DXA-derived ALM does not distinguish between muscle and connective tissue, potentially underestimating sarcopenia prevalence in individuals with high intramuscular fat. To achieve a more accurate assessment, future studies must use more advanced imaging techniques. Fourth, the study population was restricted to U.S. adults, limiting generalizability to other ethnicities or regions with distinct lifestyle and genetic backgrounds. Future multicenter, multinational studies are needed to validate our findings and enhance their generalizability to diverse populations.
In conclusion, this study demonstrates a non-linear, threshold-dependent relationship between LAR and sarcopenia risk, with higher LAR significantly reducing sarcopenia risk. Subgroup analyses confirmed consistent associations across demographics, suggesting LAR’s potential as a biomarker. Prospective studies are warranted to validate this inflection point and elucidate underlying mechanisms linking lipid metabolism to muscle health.

