

Introduction
Acute pancreatitis (AP) is an inflammatory disorder of the exocrine pancreas, characterized by tissue damage and necrosis. As the condition progresses, it can trigger systemic inflammatory response syndrome, which may ultimately result in organ failure [1]. Globally, the incidence of AP is approximately 34 cases per 100,000 people, and this rate has been steadily increasing [2]. The overall mortality rate for patients with AP varies between 3% and 10%, but in severe cases, it can increase dramatically, reaching as high as 36% to 50% [3]. Over the past decade, advances in the treatment and critical care of AP have improved patient outcomes; however, severe AP remains associated with a significantly high mortality rate [4].
Identifying high-risk patients is crucial for enhancing outcomes in AP [5]. Current clinical management strategies rely on a combination of clinical indicators and biomarkers to assess disease severity and guide treatment decisions effectively. Traditional biomarkers, such as serum amylase and lipase, while useful in diagnosis, do not always provide a comprehensive understanding of the patient’s overall condition [1]. Furthermore, emerging biomarkers, such as procalcitonin (PCT) and C-reactive protein (CRP), may lack the specificity needed to accurately distinguish the severity of AP [6, 7].
The blood urea nitrogen to albumin ratio (BAR) has recently garnered interest as a composite biomarker reflecting both renal function and nutritional status. BUN is a key indicator of the interaction between renal function and protein metabolism, with elevated levels frequently signaling impaired kidney function [8, 9]. Similarly, serum albumin is an essential marker of nutritional status, and hypoalbuminemia is associated with elevated morbidity and mortality [10, 11]. The combination of these two biomarkers in BAR offers a more comprehensive assessment, integrating both renal and nutritional aspects into a single ratio. Previous research has shown that BAR is associated with poor outcomes in various conditions, including sepsis, diabetic ketoacidosis (DKA), and acute kidney injury (AKI) [12–14]. In the context of AP, BAR has been reported to correlate significantly with disease severity and adverse clinical outcomes. For instance, Efgan observed that BAR values are strongly associated with BISAP (Bedside Index of Severity in Acute Pancreatitis) scores and are similarly effective in predicting high-risk AP cases (AUC = 0.757, cut-off = 4.60), suggesting that BAR could serve as a rapid risk stratification tool in emergency departments [15]. Furthermore, Biyik et al. identified BAR as an independent predictor of both severe AP and AKI, establishing clinically meaningful cutoff values (e.g., BAR > 5.192 for SAP, AUC = 0.849) [16]. However, while previous studies have explored BAR’s relationship with disease severity and organ failure, the prognostic utility of BAR in predicting mortality in AP patients remains underexplored.
Therefore, the present study aimed to fill this gap by evaluating the predictive value of BAR for in-hospital mortality among patients with AP, offering novel insight into its potential role as a practical, early prognostic biomarker.
Material and methods
Database introduction
The data for this study were obtained from the Medical Information Mart for Intensive Care IV (MIMIC-IV 2.2) database. MIMIC-IV is a publicly accessible, anonymized clinical database that contains detailed electronic health records of patients admitted to intensive care units (ICUs). The MIMIC-IV database holds patient records from admissions between 2008 and 2019, with data spanning approximately 60,000 ICU stays. The dataset provides detailed information, including patient demographics, laboratory results, vital signs, medication records, hospital stay summaries, and imaging reports. All data have been rigorously anonymized to ensure patient privacy while offering researchers access to a wide range of clinical variables. The first author, Yun Huang (certification number: 62970244), completed the required training and was granted access to the MIMIC-IV database. For this study, the database was downloaded and accessed on May 28, 2024. All analyses were performed using data available in this version.
Population selection criteria
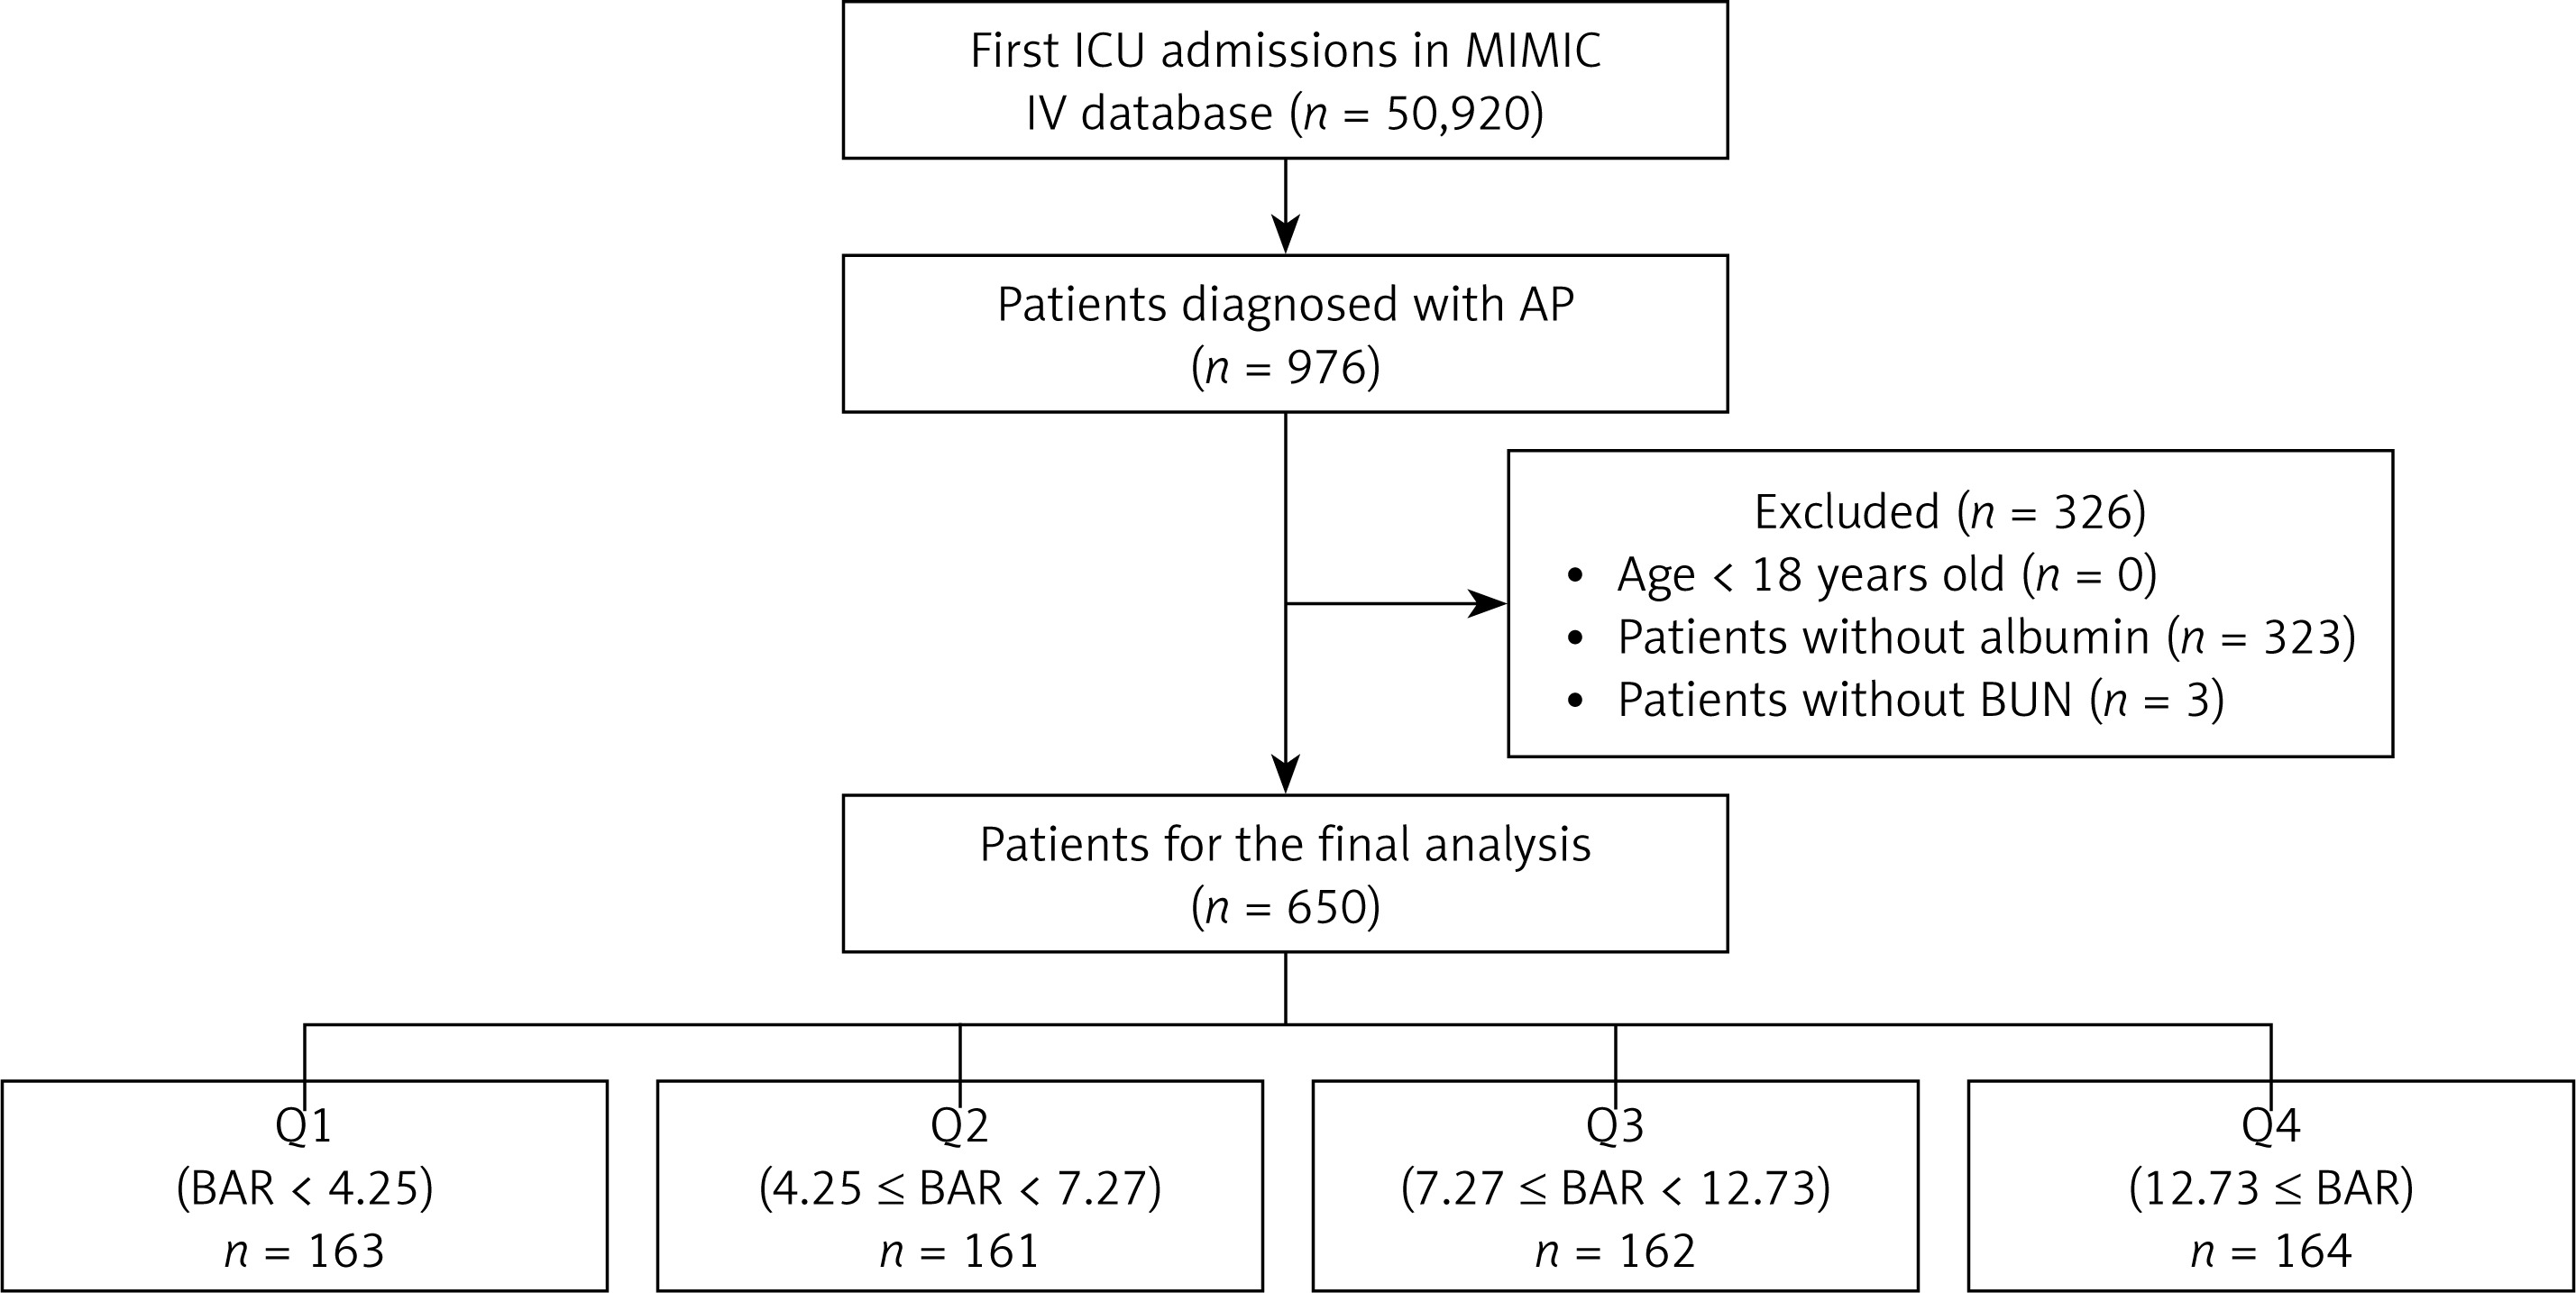
This retrospective cohort study was based on data from the MIMIC-IV 2.2 database. We selected patients admitted to the ICU with a diagnosis of AP. A total of 50,920 first ICU admissions were recorded in the database, with 976 patients diagnosed with AP. The following exclusion criteria were applied: patients < 18 years (n = 0), those without serum albumin measurements (n = 323), and those missing BUN data (n = 3). Following the exclusions, a total of 650 patients were retained for the final analysis. Baseline clinical characteristics according to serum albumin availability are shown in Supplementary Table SI. To explore the association between BAR and clinical outcomes, patients were stratified into four groups based on interquartile ranges (IQRs) of the BAR distribution within the cohort. This data-driven approach enabled balanced subgroup sizes and facilitated the assessment of potential dose–response relationships. Specifically, quartile thresholds were used to define the following categories: Q1 (BAR < 4.25; n = 163), Q2 (4.25 ≤ BAR < 7.27; n = 161), Q3 (7.27 ≤ BAR < 12.73; n = 162), and Q4 (BAR ≥ 12.73; n = 164) (Figure 1).
Data extraction and BAR calculation
The MIMIC-IV 2.2 database was used to extract clinical and demographic information for all included patients. Collected variables included age, gender, and race. Vital signs at ICU admission, such as heart rate, mean blood pressure (MBP), and oxygen saturation (SpO2), were recorded. To assess illness severity, the Sequential Organ Failure Assessment (SOFA) score and Charlson Comorbidity Index (CCI) were calculated. Comorbid conditions, including hypertension, obesity, diabetes, AKI, and sepsis, were documented. Laboratory parameters, including white blood cells (WBC), hemoglobin, serum albumin, BUN, creatinine, glucose, and total bilirubin, were collected to assess the biochemical and hematologic profiles of the patients. Information on therapeutic interventions, including vasopressors, octreotide, statins, insulin, fibrates, endoscopic retrograde cholangiopancreatography (ERCP), ventilation, and continuous renal replacement therapy (CRRT), was also obtained. The BAR was calculated by dividing BUN (mg/dl) by serum albumin concentration (g/dl). All blood samples used in this study, including those for BUN and serum albumin, were collected within the first 24 h of ICU admission. These laboratory results represent the patient’s baseline status at the time of critical care entry and are consistent with standard practices in retrospective analyses based on the MIMIC-IV database. However, because the exact onset time of AP symptoms is not recorded in MIMIC-IV, the number of days from disease onset to blood sample collection could not be determined.
Outcomes
The primary outcomes were 90-day and 365-day all-cause mortality. Secondary outcomes included length of hospital and ICU stay, ventilator-free days within 28 days (VFD-28), and hospital and ICU mortality. In the MIMIC-IV database, mortality status is captured through two complementary sources: in-hospital death is recorded directly in the hospital information system, while post-discharge mortality is obtained via linkage to the Social Security Death Index [17]. This approach allows for reliable ascertainment of vital status beyond hospital discharge. In the present study, complete follow-up data were available for all patients at both the 90-day and 365-day time points. As a result, no patients were lost to follow-up, and all primary outcome data reflect complete-case analyses.
Statistical analysis
Baseline characteristics were analyzed across BAR quartiles using suitable statistical methods. Continuous variables were presented as mean ± standard deviation (SD) or median with interquartile ranges (IQRs), based on the distribution of the data. Categorical variables were expressed as frequencies and percentages. Group comparisons were performed using one-way analysis of variance (ANOVA) or the Kruskal-Wallis test for continuous variables, and the χ2 test for categorical variables, as appropriate.
We employed least absolute shrinkage and selection operator (LASSO) regression to identify variables associated with 90-day prognosis. Subsequently, Cox proportional hazards models were constructed to evaluate the association between BAR and 90-day and 365-day mortality. To minimize potential confounding between BAR and outcomes, we developed three models to estimate hazard ratios (HR) and 95% confidence intervals (CI), and conducted trend tests across quartiles. Model 1 was adjusted for age and gender. Model 2 included the variables in Model 1 plus obesity, diabetes, and AKI. Model 3 further adjusted for the variables in Model 2, along with SOFA score, CCI, WBC, creatinine, total bilirubin, vasopressor use, and CRRT. Restricted cubic spline (RCS) analysis examined the non-linear relationship. Kaplan-Meier survival analysis, along with the log-rank test, was applied to assess differences in primary outcomes across BAR quartiles. Additionally, receiver operating characteristic (ROC) curves were constructed.
Stratified and interaction analyses were conducted based on age, gender, race, SOFA score, diabetes, AKI, sepsis, vasopressor use, and CRRT. We conducted three separate sensitivity analyses. First, we excluded participants with missing data. Second, we performed analyses excluding patients with an ICU stay < 24 h. Finally, additional analyses were conducted excluding patients with end-stage renal disease and liver cirrhosis. In all analyses, the percentage of missing data for covariates was less than 10%. Details on missing variables are presented in Supplementary Table SII. Missing data were addressed using multiple imputation via the ‘mice’ package in R, with the random forest method employed for imputation.
The data analysis was conducted using R software version 4.4. P-values < 0.05 were considered statistically significant.
Results
Patient characteristics
Baseline characteristics of the study population, stratified by BAR quartiles, are shown in Table I. The mean age was 59.2 ±17.2 years, with significant differences across quartiles (p < 0.001). Males comprised 57.1% of the cohort, with no significant gender differences between quartiles (p = 0.434). MBP decreased with higher BAR (p < 0.001), while AKI and sepsis were more prevalent in higher BAR quartiles (both p < 0.001). Significant differences were also observed in WBC, hemoglobin, serum albumin, BUN, and creatinine across quartiles (all p < 0.05). Patients with higher BAR were more likely to receive vasopressors, insulin, and CRRT (all p < 0.001). Hospital and ICU stays were longer in higher BAR quartiles (both p < 0.001), with fewer VFD-28 (p < 0.001). Hospital mortality reached 31.1%, and ICU mortality was 21.3% in Quartile 4 (both p < 0.001).
Table I
Baseline characteristics of patients
[i] BAR – blood urea nitrogen to serum albumin ratio, MBP – mean blood pressure, SpO2 – saturation of peripheral oxygen, SOFA – sequential organ failure assessment, CCI – Charlson Comorbidity Index, AKI – acute kidney injury, WBC – white blood cells, BUN – blood urea nitrogen, AST – alanine aminotransferase, ALT – aspartate aminotransferase, ERCP – endoscopic retrograde cholangiopancreatography, CRRT – continuous renal replacement therapy, ICU – intensive care unit, VFD-28 – ventilator-free days at 28 days.
Association between BAR and all-cause mortality
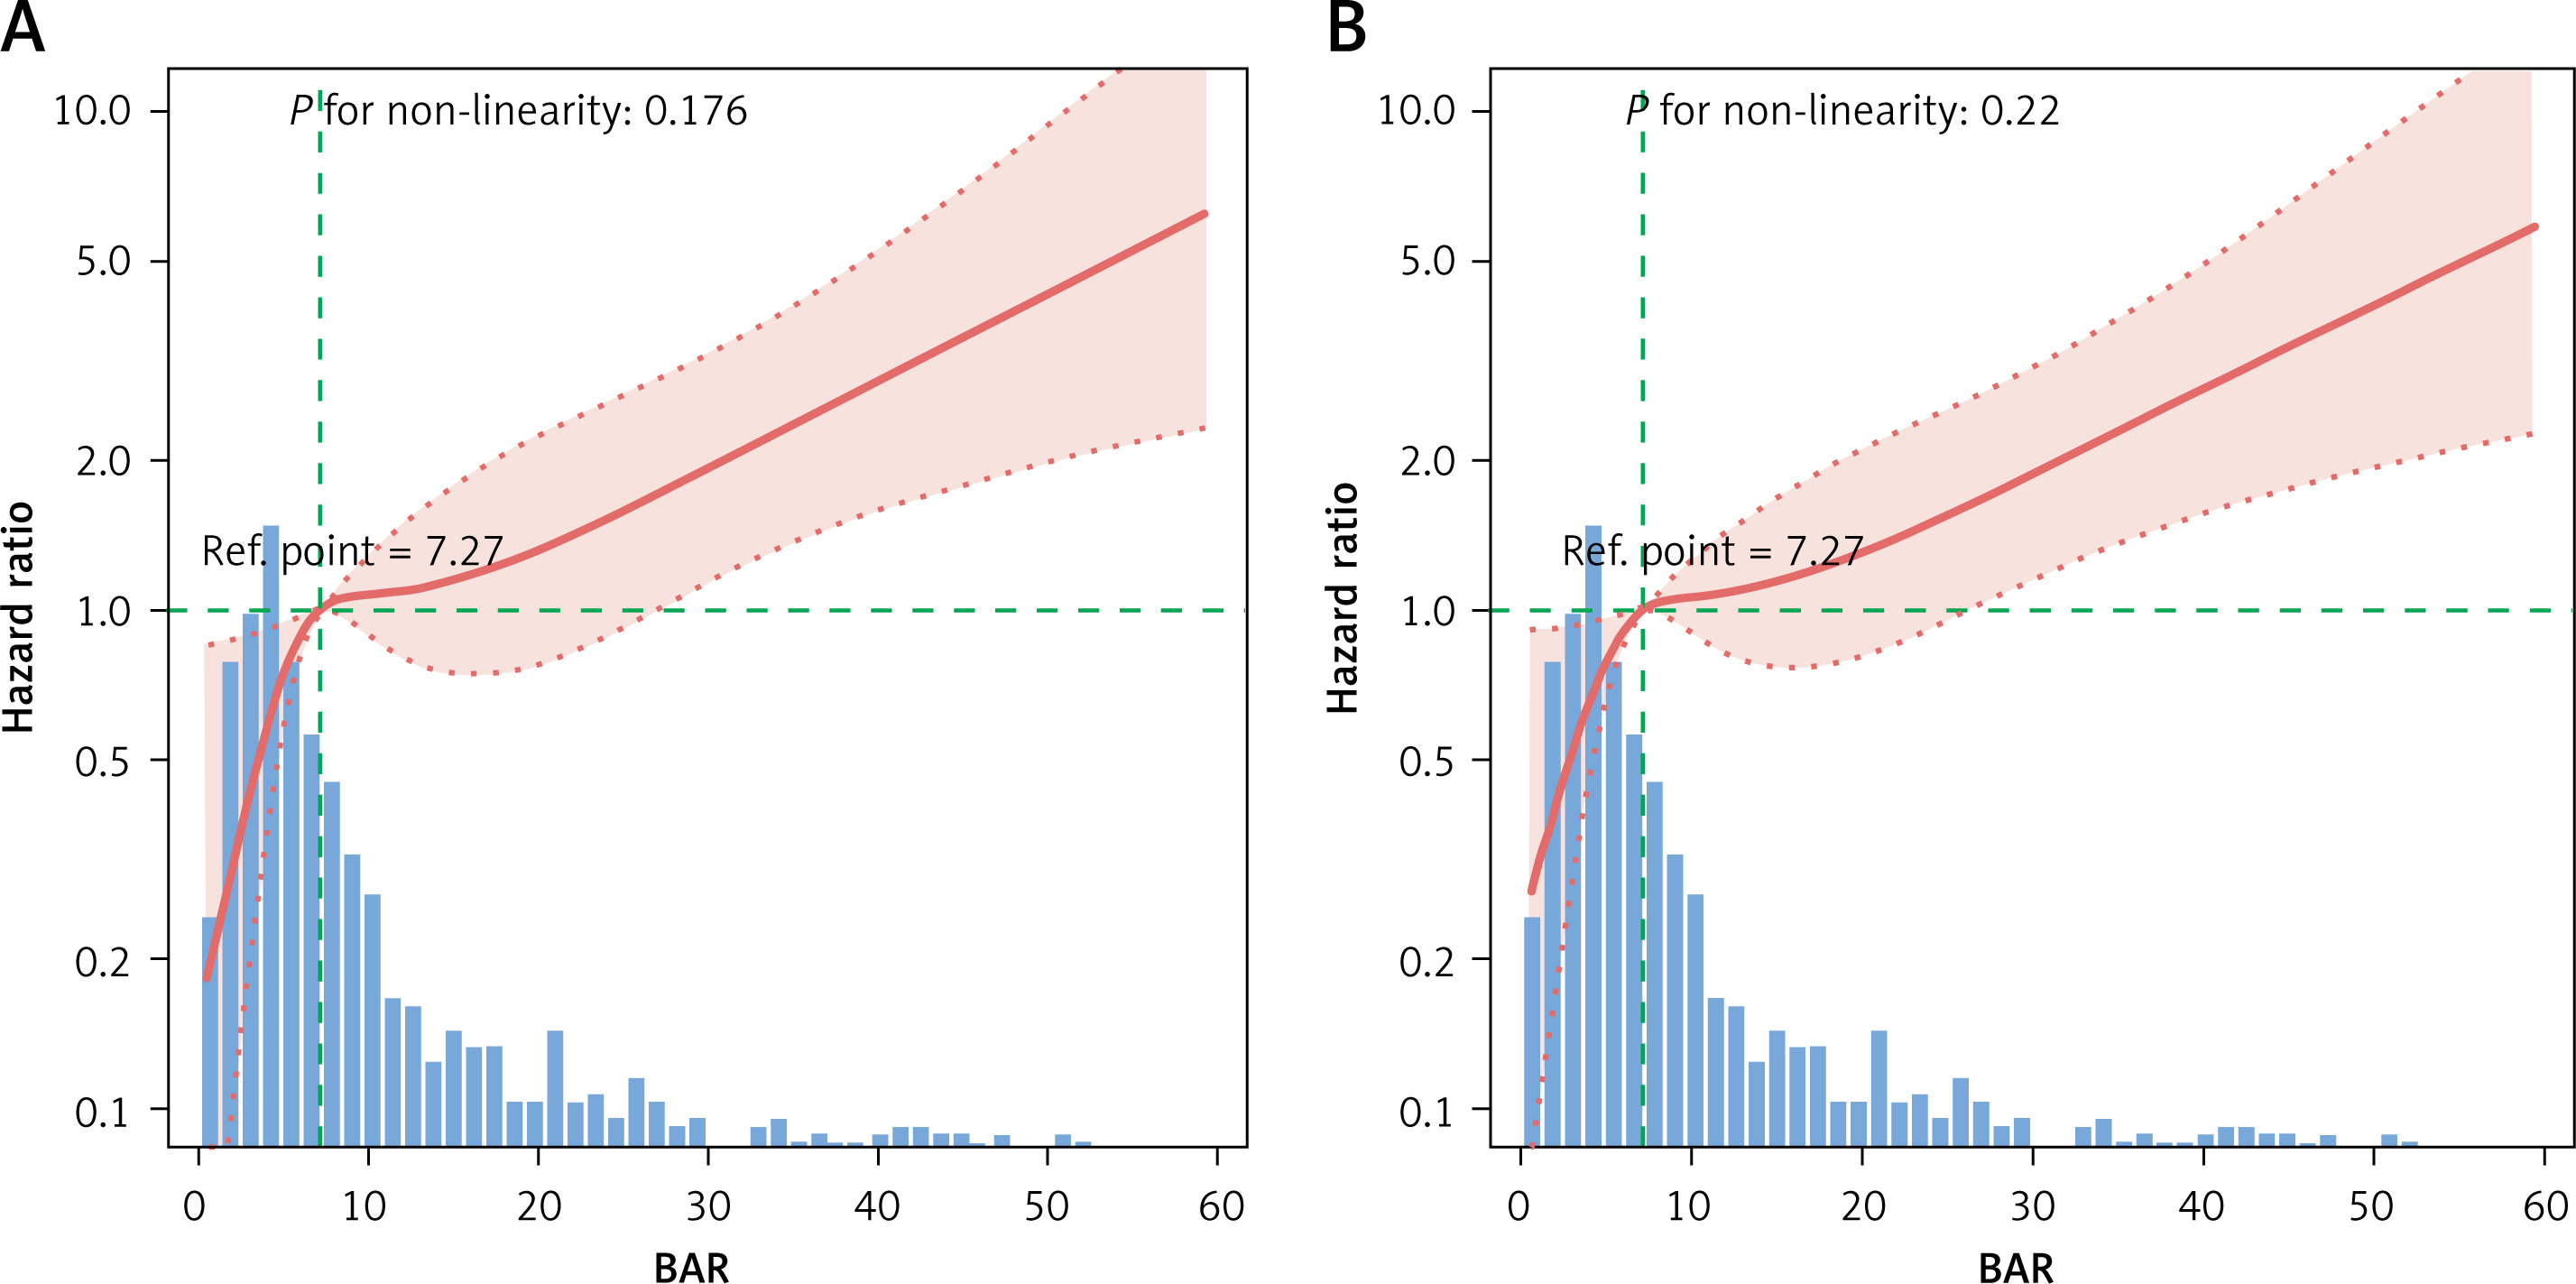
Table II shows significant differences in 90-day and 365-day mortality across BAR quartiles (p < 0.001), with survival rates decreasing as BAR levels increased at both time points. We employed LASSO regression to identify 13 relevant variables for the Cox regression analyses (Supplementary Figure S1). Table III indicates that BAR, both as a continuous and as a categorical variable, was significantly associated with 90-day and 365-day mortality across all models. As a continuous variable, BAR was strongly associated with 90-day mortality, with an HR of 1.04 (95% CI: 1.02–1.06), and with 365-day mortality, where the HR was 1.04 (95% CI: 1.02–1.05), based on the results from model 3. When categorized into quartiles, higher BAR quartiles were associated with an increased risk of mortality. In model 3, for 90-day mortality, compared to Q1 (reference), the HR for Q4 was 3.76 (95% CI: 1.57–8.98), and for 365-day mortality, Q4 had an HR of 2.96 (95% CI: 1.45–6.01). Figure 2 illustrates the RCS analysis of BAR and mortality. No non-linearity was observed (p = 0.176 for 90-day, p = 0.22 for 365-day), with mortality risk increasing as BAR rises.
Table II
All-cause mortality in patients with AP compared between the BAR quartiles
Table III
Cox proportional hazard model assessing all-cause mortality in patients with AP
[i] Model 1: adjusted for age, gender. Model 2: adjusted for Model 1 plus obesity, diabetes, AKI. Model 3: adjusted for Model 2 plus SOFA, CCI, WBC, creatinine, total bilirubin, vasopressor, CRRT. AP – acute pancreatitis, AKI – acute kidney injury, SOFA – sequential organ failure assessment, CCI – Charlson Comorbidity Index, WBC – white blood cells, CRRT – continuous renal replacement therapy.
Kaplan-Meier survival curve
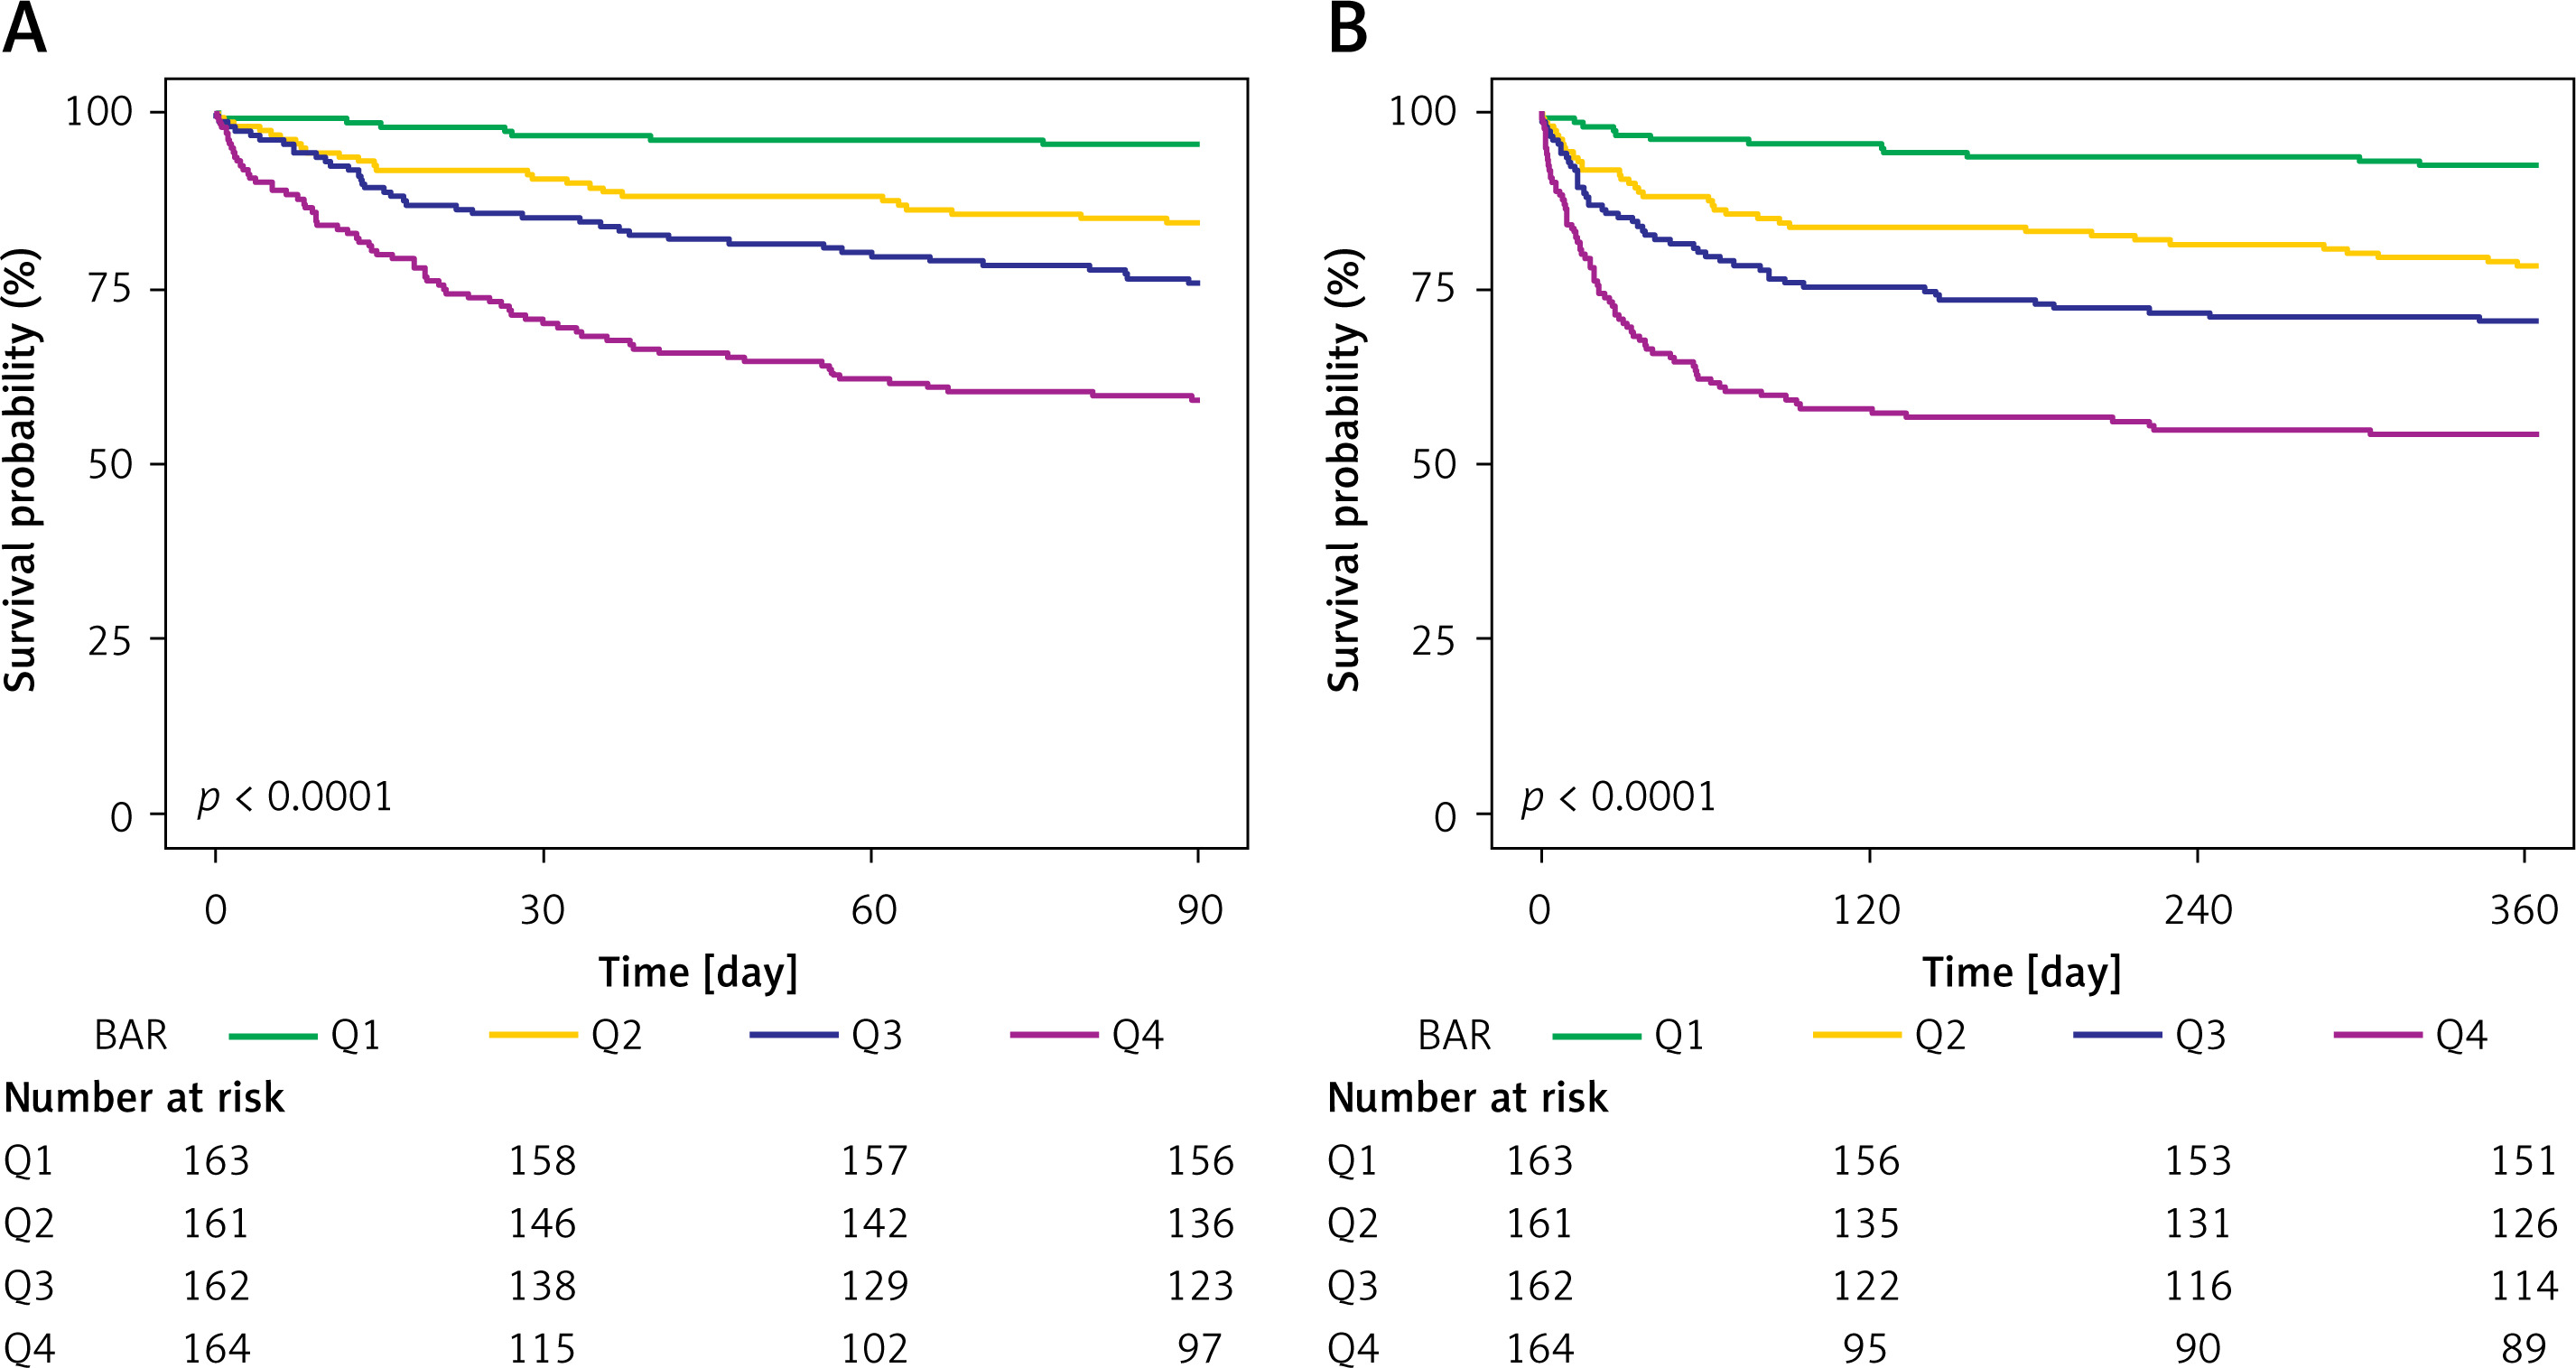
Figure 3 shows that survival rates at 90 days and 365 days significantly decreased with increasing BAR quartiles. Patients in Quartile 4 exhibited the lowest survival, with significant differences observed across quartiles (p < 0.001).
Prediction of all-cause mortality by BAR
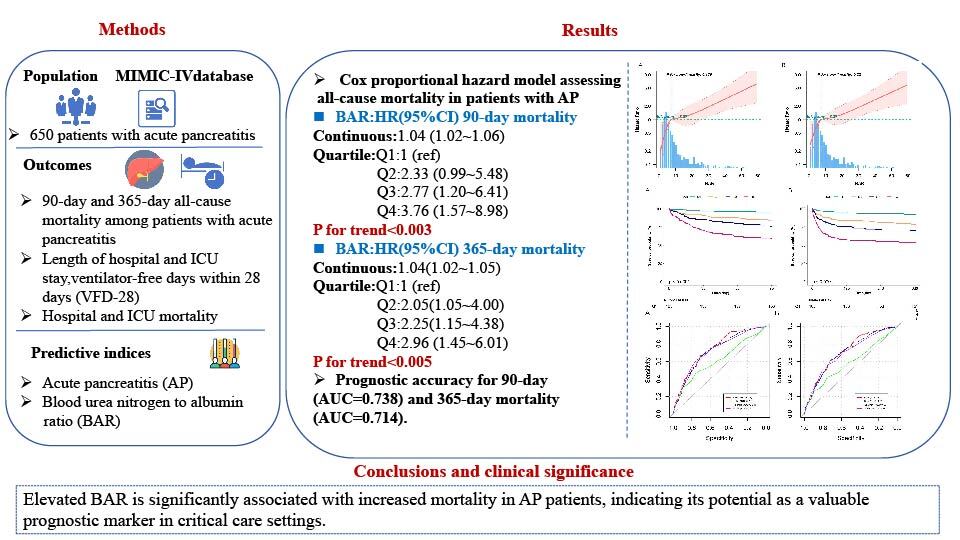
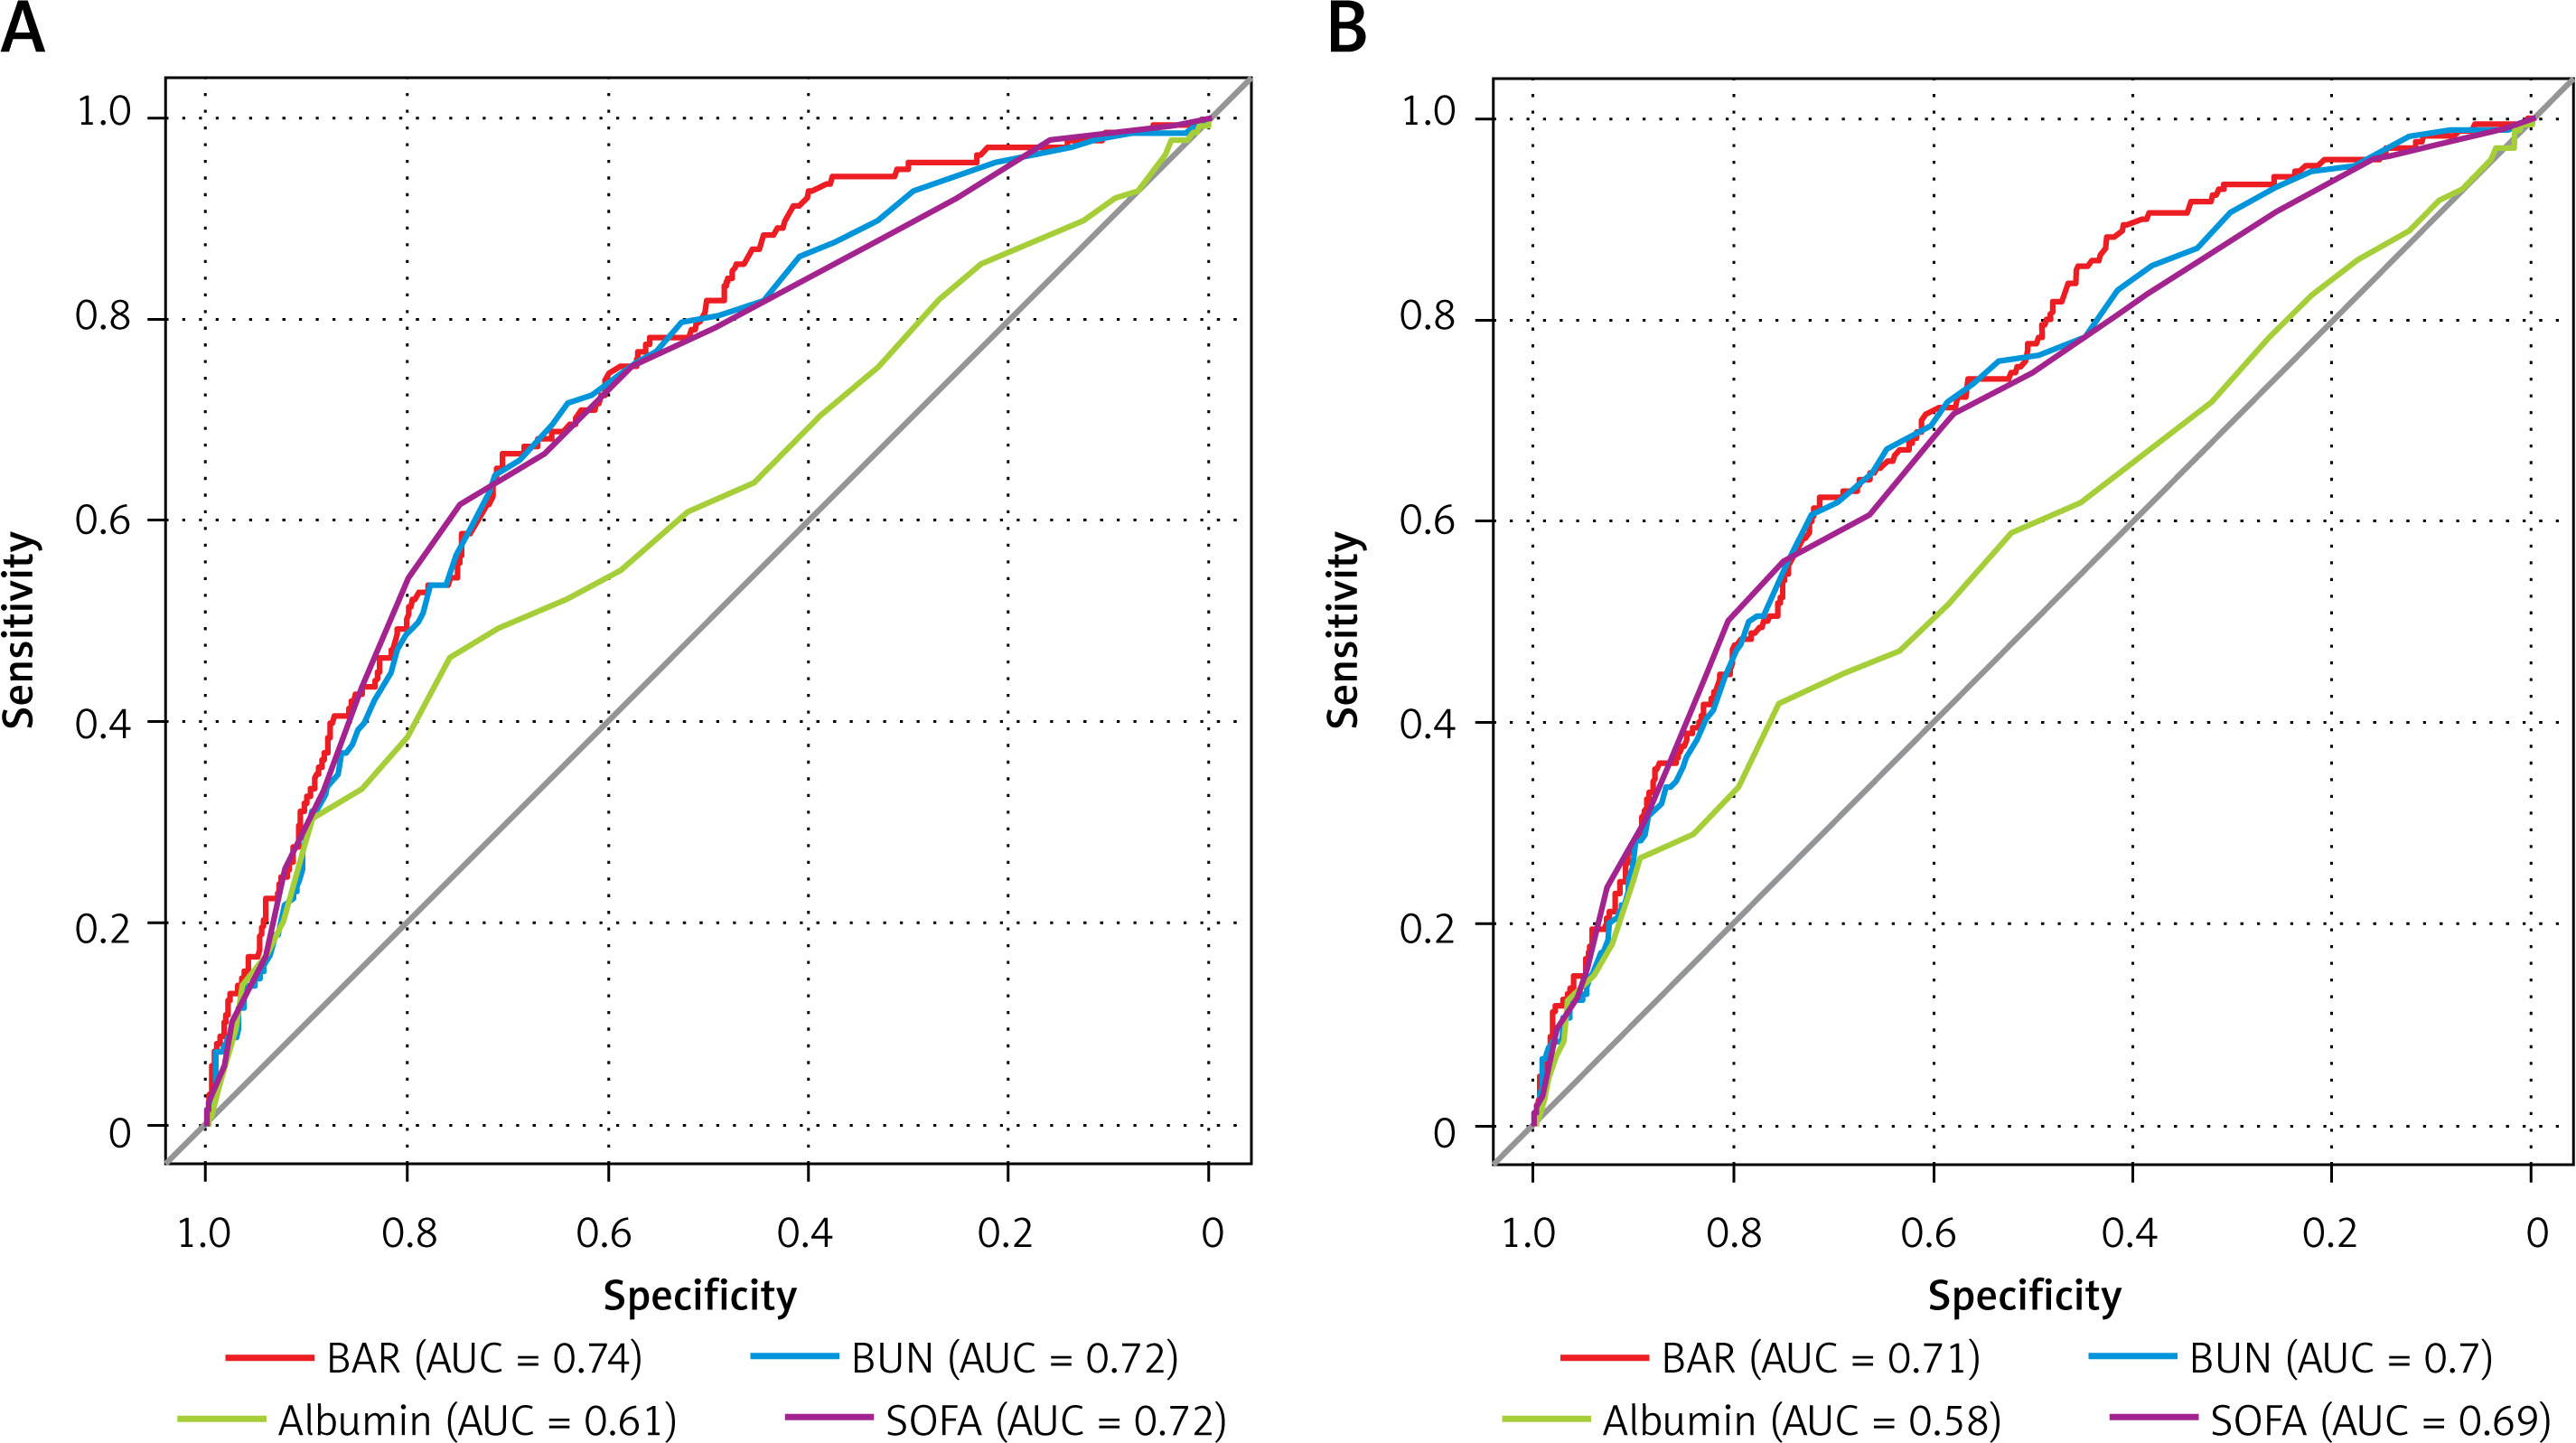
The ROC curves compare the predictive performance of BAR, BUN, albumin, and SOFA scores (Table IV and Figure 4). BAR had the highest AUC for both 90-day mortality (AUC = 0.738) and 365-day mortality (AUC = 0.714), indicating superior predictive ability.
Table IV
Prognostic accuracy of markers for 90-day and 365-day mortality
Subgroup analysis
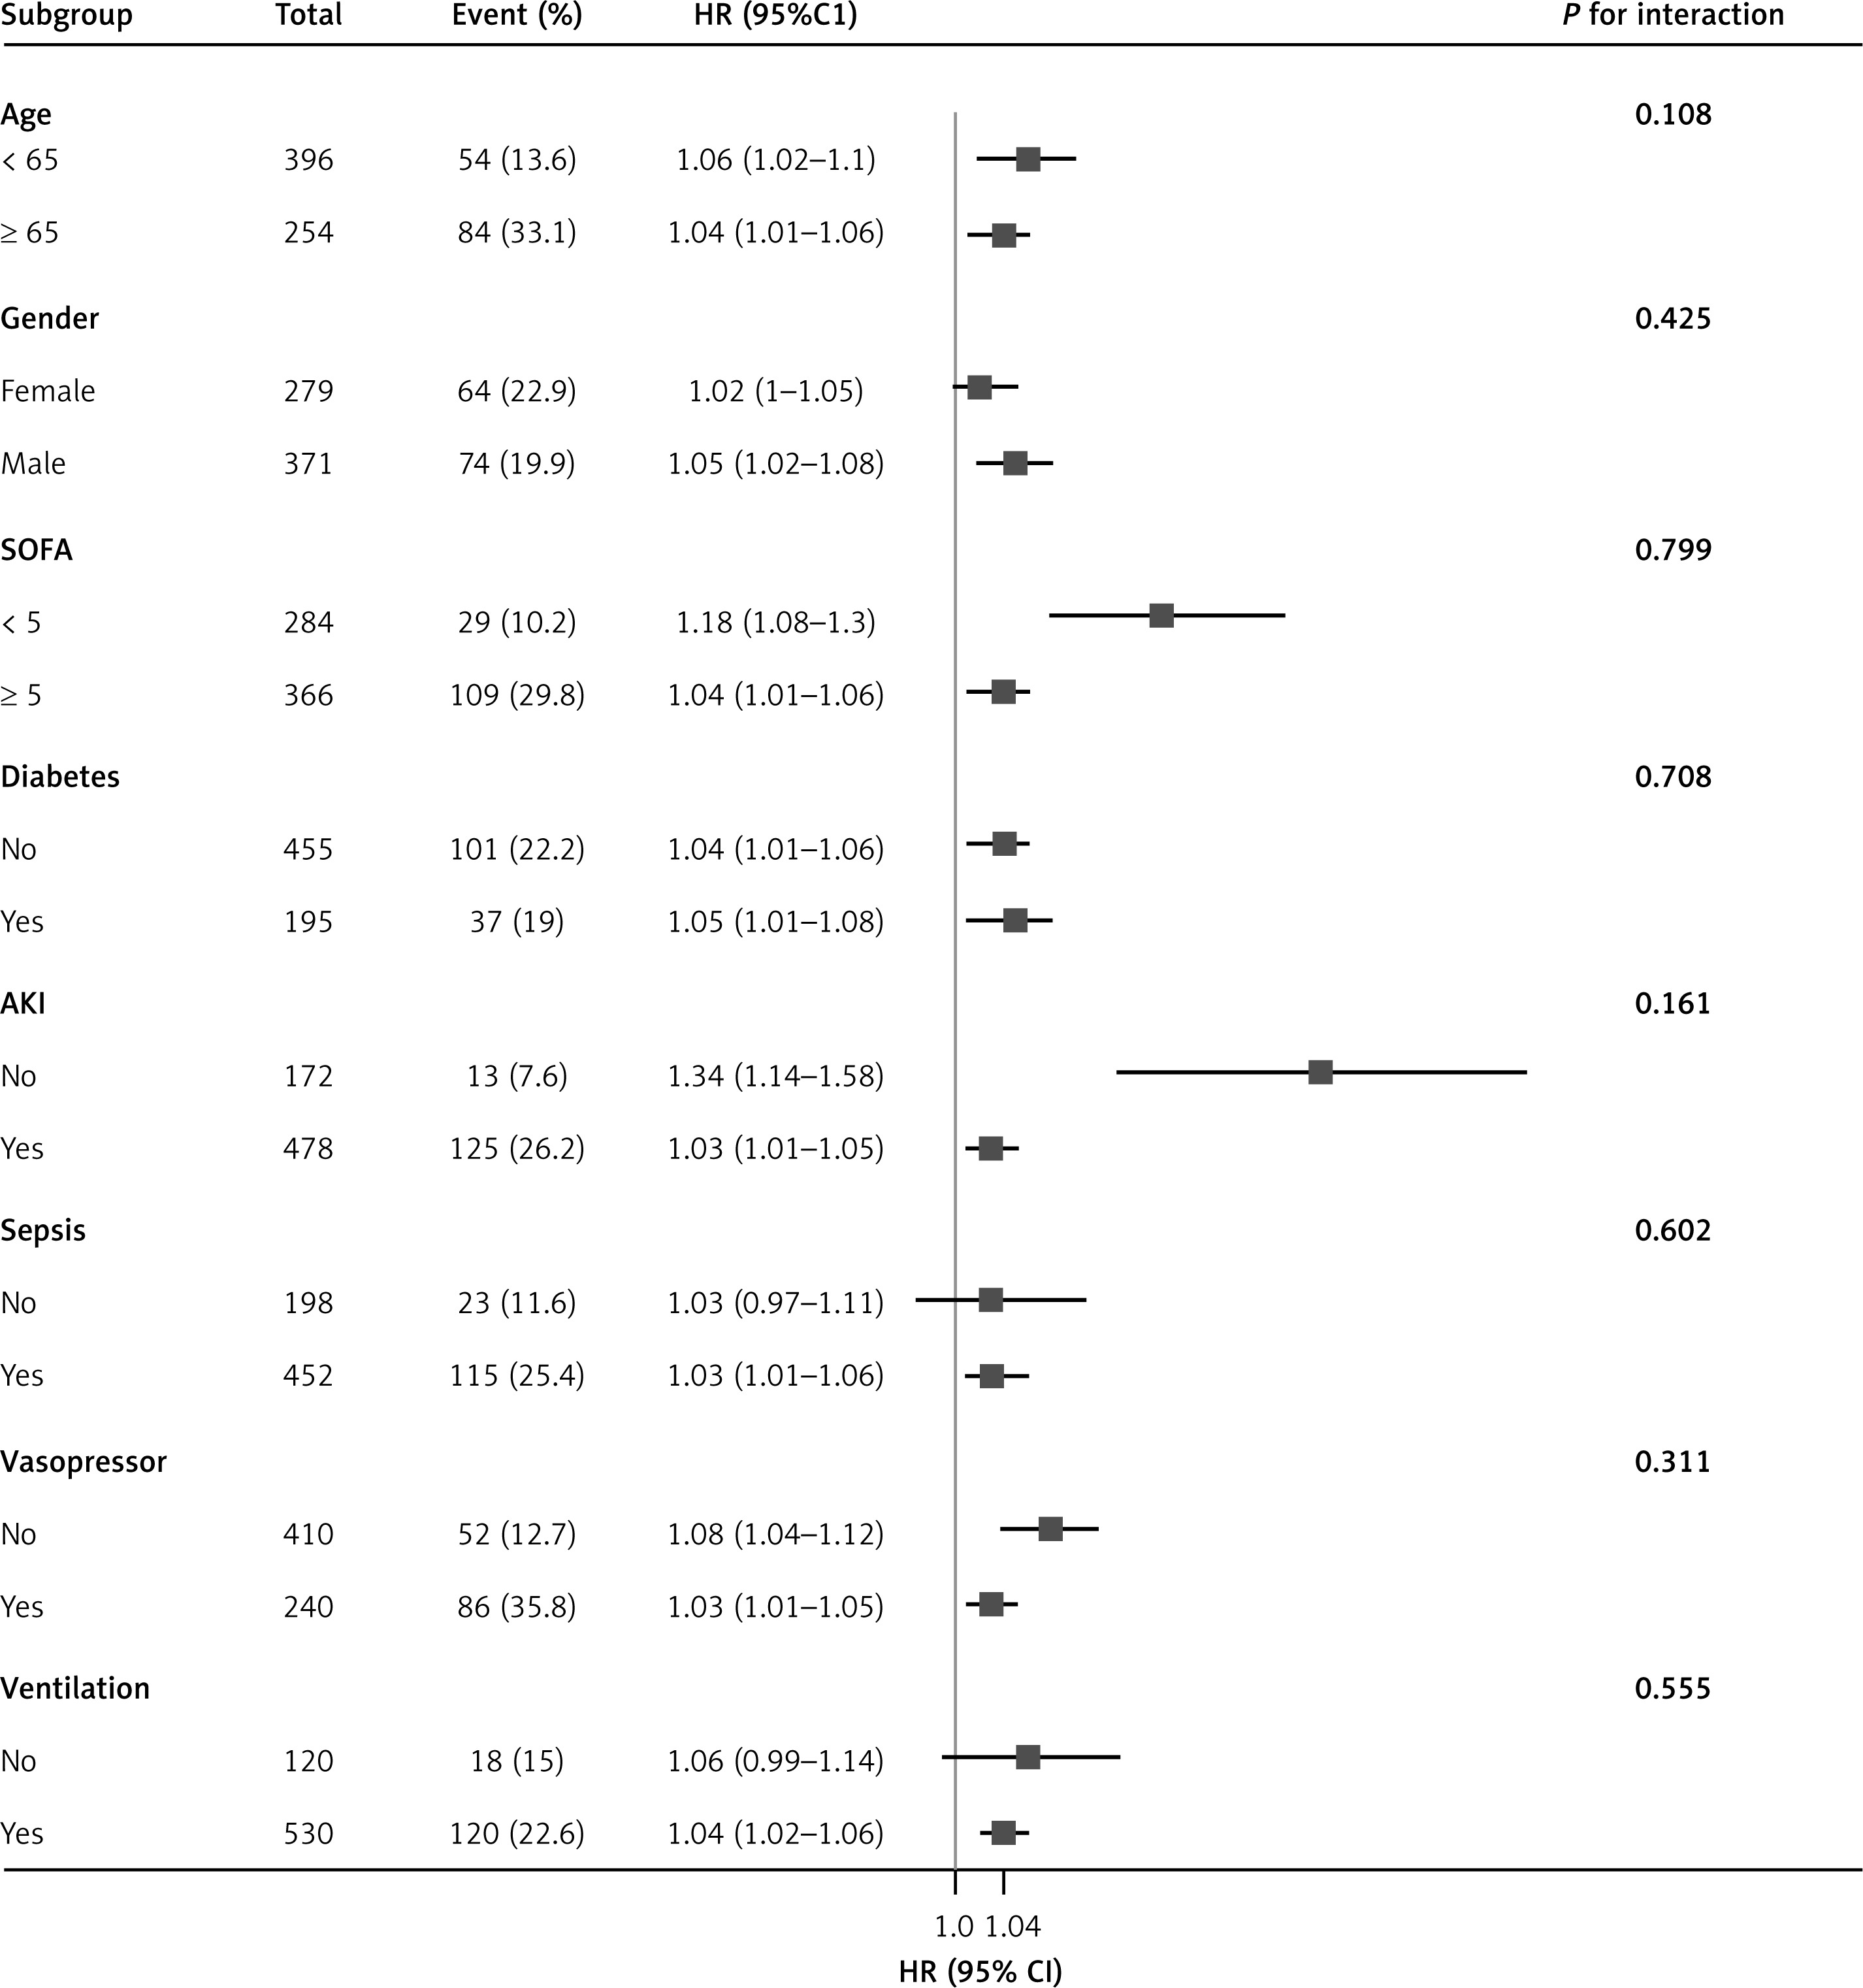
Subgroup analysis indicated no significant interactions for age, gender, SOFA score, diabetes, sepsis, vasopressor use, or ventilation (all p-values for interaction > 0.05) (Figure 5). The results remained stable across these subgroups.
Figure 5
Association between BAR and 90-day mortality according to baseline characteristics. Each stratification was adjusted for all factors in Table III of Model 3 except for the stratification factor itself
SOFA – sequential organ failure assessment, AKI – acute kidney injury.
Sensitivity analysis
Sensitivity analyses were performed to evaluate the robustness of our results. Excluding participants with missing data resulted in a final cohort of 592 patients. Additional analyses were conducted after excluding those with an ICU stay < 24 h, leaving 584 patients. Finally, we excluded patients with end-stage renal disease and liver cirrhosis, leaving a total of 549 patients for further analysis. The results from all three sensitivity analyses were stable, as detailed in Supplementary Tables SIII–SV.
Discussion
This study investigated the association between the BAR and all-cause mortality in patients with AP. Our findings indicate a significant correlation between elevated BAR levels and increased mortality. Specifically, we observed HRs of 1.04 (95% CI: 1.02–1.06) for 90-day mortality and 1.04 (95% CI: 1.02–1.05) for 365-day mortality, suggesting that BAR may be a reliable prognostic marker. Furthermore, ROC analysis showed that BAR has strong predictive performance, with an AUC of 0.738 for 90-day mortality and 0.714 for 365-day mortality. These findings further support the potential of BAR as a valuable tool for risk stratification in AP patients. Given the simplicity of measuring BUN and albumin levels, BAR offers a convenient and accessible prognostic tool.
BUN and serum albumin are well-established biomarkers that influence the prognosis of AP. Elevated BUN levels often indicate renal impairment, which can result from decreased renal perfusion due to hypovolemia, a common complication in AP [18]. Renal dysfunction exacerbates disease severity and elevates mortality risk. A study found that a BUN level of ≥ 20 mg/dl at admission was significantly associated with a higher mortality risk, with an odds ratio of 4.3 (95% CI: 2.3–7.9) [19]. Additionally, a comparative study showed that elevated BUN levels were a significant indicator of both mortality and sustained multiorgan failure, with an AUC of 0.842, comparable to the BISAP score [20]. On the other hand, low serum albumin levels indicate malnutrition and impaired hepatic synthetic function, both of which portend poor outcomes in critically ill patients [21]. Hypoalbuminemia reduces oncotic pressure, contributing to fluid extravasation and organ dysfunction in the context of AP [22, 23].
BAR integrates these two markers to provide a composite reflection of both renal function and nutritional status. Its prognostic utility has been demonstrated across various critical illnesses. In patients with DKA, a study using data from the MIMIC-III database showed that higher BAR levels were strongly associated with increased mortality rates, both in-hospital and post-discharge. Specifically, patients with elevated BAR levels demonstrated a significantly reduced four-year survival rate [24]. Similarly, in the context of COVID-19, elevated BAR was correlated with disease severity and 30-day mortality [25]. Research focusing on critically ill surgical patients also highlighted the relevance of BAR, demonstrating an independent association between elevated BAR levels and higher 1-year post-hospital mortality. Using propensity score matching to confirm this association, the study emphasized BAR as a key factor influencing long-term outcomes in surgical ICU patients [26]. In patients with sepsis, higher BAR levels were associated with increased 30-day and 360-day mortality rates [12, 27]. Additionally, in patients experiencing acute pulmonary embolism, an elevated BAR was identified as an independent predictor of ICU and 28-day mortality, outperforming other scoring systems in mortality prediction [28]. Furthermore, in patients with coronary heart disease, a higher BAR was correlated with increased mortality rates, including in-hospital, 28-day, and 1-year mortality [29]. Emerging data support BAR’s clinical utility in AP specifically. Efgan et al. reported that BAR values correlated with BISAP scores and predicted disease severity (AUC = 0.757, cutoff = 4.60). More recently, Biyik et al. found BAR to be an independent predictor of both severe AP and AKI, with an AUC of 0.849 at a cut-off of 5.192. Our findings align with and expand upon this body of evidence. In a large ICU cohort of AP patients, we found that elevated BAR was significantly associated with mortality.
Notably, approximately one-third of patients in the initial cohort lacked albumin measurements and were therefore excluded from the primary analysis. To explore the characteristics and potential implications of this missingness, we conducted a comparative analysis of patients with and without albumin data. The results showed that patients without albumin measurements were generally younger, had lower SOFA scores, and presented with lower rates of AKI, sepsis, and mortality. They also received fewer intensive interventions such as vasopressors, mechanical ventilation, and CRRT. These findings suggest that albumin testing was more likely to be ordered in patients with more severe illness, consistent with clinical decision-making practices in the ICU setting. Consequently, our final analytical cohort likely overrepresents patients with more critical illness. This introduces a selection bias, potentially limiting the generalizability of our findings to less severely ill AP patients. However, this also implies that the prognostic utility of BAR may be particularly robust in high-risk ICU populations, where early identification of patients at risk for deterioration is most valuable. Future prospective studies with systematic data collection are needed to validate these findings in broader clinical settings.
These findings have several important clinical implications. First, the BAR can be calculated from two inexpensive, routinely collected biomarkers, making it a practical option for widespread implementation. Second, its rapid availability at ICU admission enables early identification of high-risk patients, potentially prompting more timely interventions such as aggressive fluid resuscitation, nutritional support, or nephrology consultation. Third, BAR could serve as a complementary tool to existing severity scores such as APACHE II and Ranson criteria, particularly in time-constrained or resource-limited environments. Integrating BAR into clinical workflows or electronic medical record systems may further enhance early warning capabilities and improve triage decisions. Overall, its simplicity, objectivity, and strong prognostic value position BAR as a useful marker for guiding individualized care in critically ill AP patients.
This study provides novel evidence supporting the prognostic value of BAR in critically ill patients with AP. However, several limitations should be acknowledged. First, the MIMIC-IV database lacks data on key etiological factors of AP, such as biliary pathology, alcohol use, and metabolic disorders, limiting the contextual interpretation of our findings. Second, important inflammatory biomarkers such as PCT and CRP were excluded due to high rates of missing data, which may have affected the comprehensiveness of our prognostic evaluation. Third, BUN levels can be influenced by dietary intake, potentially introducing confounding. Fourth, we relied solely on baseline BAR measurements and did not assess dynamic trends over time, which could have provided further insights into disease progression and treatment response. Fifth, although all laboratory values were collected within 24 h of ICU admission, the exact timing of symptom onset was not recorded in the MIMIC-IV database. Therefore, the interval between disease onset and blood sampling could not be determined. Finally, structured data on imaging findings – such as the presence of pancreatic necrosis – and clinical classification according to the revised Atlanta criteria were not available, precluding direct analysis of radiological severity. Future prospective studies incorporating standardized imaging, clinical assessments, and serial biomarker measurements are warranted to validate and extend our findings.
In conclusion, elevated BAR is significantly associated with increased mortality in patients with AP, highlighting its potential value as a prognostic marker in critical care settings. By incorporating BAR into routine clinical assessments, healthcare providers can enhance risk stratification and improve patient outcomes.

