Introduction
Diabetic kidney disease (DKD) is a significant healthcare concern in older patients with type 2 diabetes mellitus (T2DM). DKD diagnosis depends on two criteria: low estimated glomerular filtration rate (eGFR < 60 ml/min/1.73 m2) and albuminuria or proteinuria among patients with T2DM [1]. Diabetic nephropathy is the most common microvascular complication, which is expected to affect approximately 40–60% of diabetic individuals [2]. Diabetic kidney disease is currently the major cause of kidney failure and the single leading cause of diabetic mortality [3]. The build-up of extracellular matrix (ECM) in the glomerular mesangium and interstitium and increased glomerular membrane thickness are characteristics of irreversible diabetic kidney disease (DKD) [4, 5]. DKD also includes renal parenchyma sclerosis and scar formation [6]. Hyperglycemia and complications from diabetes prompt the transformation of renal epithelial cells into mesenchymal cells, alongside the activation of fibroblasts and pericytes [4], ultimately developing myofibroblasts. Massive amounts of collagen are secreted by the newly produced myofibroblasts, mediating glomerular sclerosis and other fibrosis, including renal vessels [7]. Furthermore, activation of the diacylglycerol (DAG)-protein kinase C (PKC) pathway has been associated with chronic hyperglycemia and results in increased generation of reactive oxygen species [8]. Additionally, hyperglycemia can trigger PKC activation, subsequently upregulating the production and expression of transforming growth factor-β1 (TGF-β1) [9].
PKC is widely recognized as a crucial proapoptotic protein in DNA damage-induced apoptosis [10]. Newly identified PKC isoenzymes could be linked to diverse inflammatory reactions and tissue damage. Studies suggest that PKC plays a role in regulating collagen gene expression, with increased PKC expression implicated in the development of fibrotic conditions and its activation contributing to the progression of inflammatory fibrosis [11]. PKC is recognized as a pivotal contributor to the progression of diabetic nephropathy by activating nuclear factor κB (NF-κB) and TGF-β1. The activation of NF-κB/TGF-β1 may explain the abnormal ECM accumulation and the development of renal hypertrophy [12].
Moreover, inhibiting PKC in pericytes in vitro led to reduced NF-κB activation and diminished production of reactive oxygen species (ROS) [13, 14]. NF-κB is activated in diabetic nephropathy and is a critical transcription regulator for inflammatory processes within the kidneys of individuals with diabetes [15]. The activity of NF-κB is correlated with the JAK/STAT pathway and impacted by elevated ROS and hyperglycemia [16, 17].
In diabetes induced by streptozotocin (STZ), inhibition of signal transducer and activators of transcription (STAT3) reduced proteinuria, glomerular cell proliferation, and fibrotic activity [18]. Furthermore, the pathogenesis of diabetic nephropathy and chronic kidney disease (CKD) are linked to the activation of STAT3 in renal tubules. In diabetic renal tissues, STAT3 is also associated with collagen accumulation in the proximal tubular tissues and around the glomeruli [18]. Moreover, the dysregulated NF-κB and STAT pathways contribute to renal fibrosis and the development of diabetes [19].
In addition to conventional drugs such as sodium-glucose cotransporter 2 inhibitors [20], exercise, acupoint and yoga [21], research on the potential therapeutic application of stem cells in diabetic renal disorders is intriguing [22]. Some researchers believe bone marrow-mesenchymal cells (BM-MS) may protect tissues from inflammation. The beneficial effects of MSCs are attributed to their release of anti-inflammatory factors and antioxidant mediators via paracrine signaling [23].
The current study was designed to explore the potential therapeutic effect of stem cells in ameliorating diabetic nephropathy through the downregulation of inflammation, oxidative stress, and the PKC/NF-kβ/STAT3 fibrotic signaling pathway.
Material and methods
Animals
The research ethics committee at Princess Nourah Bint Abdulrahman University approved the research protocol number (HAP-01-R-059) on May 12, 2022. The approval was granted based on the guidelines outlined in the Guide for the Care and Use of Laboratory Animals published by the US National Institutes of Health (NIH publication No. 85-23, revised 1996). The study was conducted on male Wistar rats (8–9 weeks old) weighing 180–200 g. Throughout the acclimation period, the rats were housed in a clean environment with a 12-hour light/dark cycle, provided with standard pellets for food, and given unrestricted access to water.
Experimental design
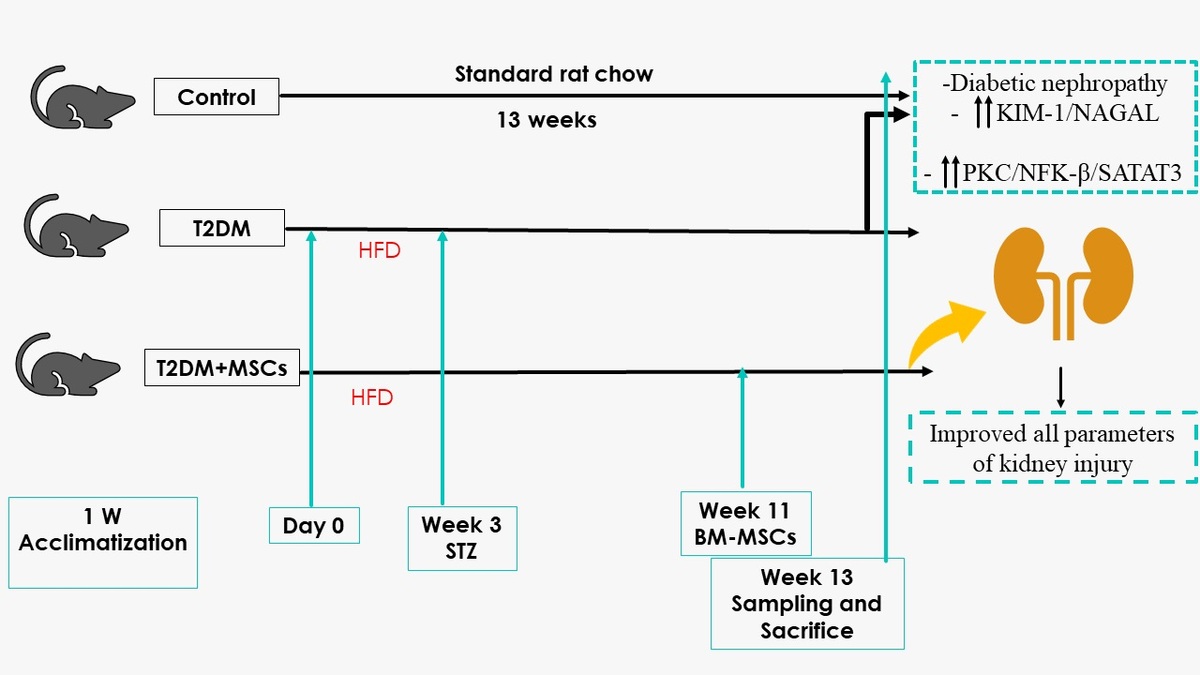
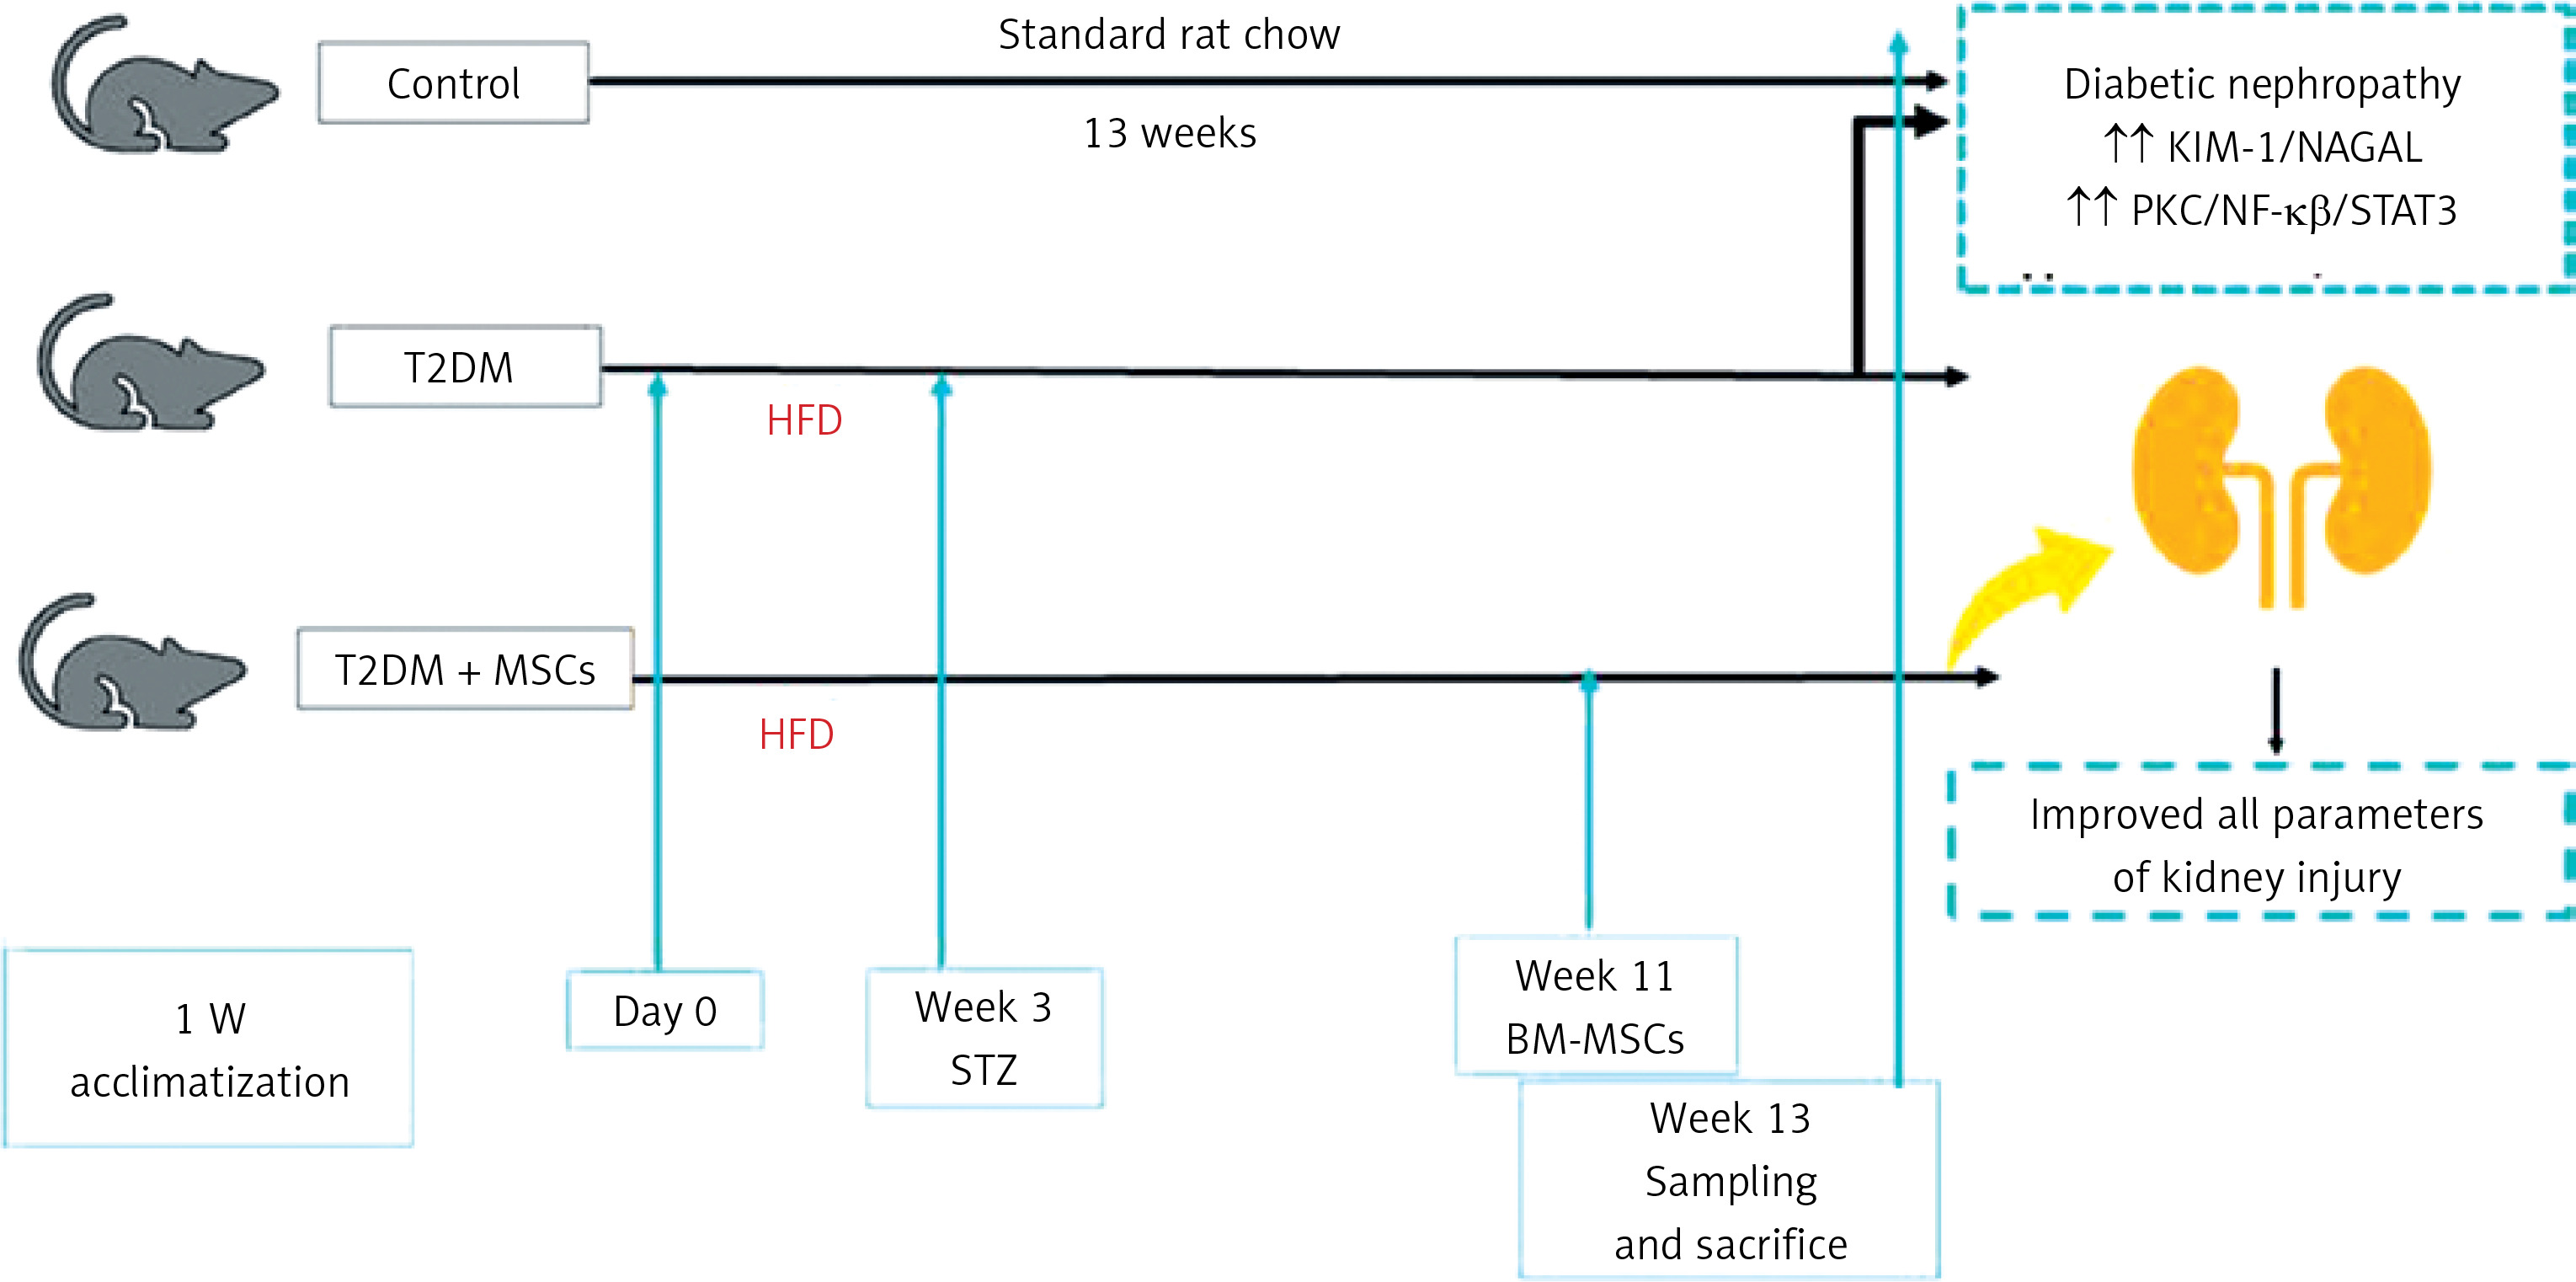
Twenty-four rats were utilized in the study and allocated randomly to three groups (8 rats per group) following a 1-week adaptation phase. The control group consisted of non-diabetic rats fed a standard laboratory diet without treatment for 13 weeks. The T2DM group was given a high-fat diet for 3 weeks and a single injection of streptozotocin, as previously described, to induce diabetes mellitus [24]. The MSCs plus T2DM group (MSCs + T2DM) received a single injection of MSCs derived from bone marrow (BM-MSCs) following 8 weeks of the induction of diabetes. Each rat in this group was administered an intravenous injection of 2 × 10⁶ BM-MSCs.
Induction of T2DM
The rats were subjected to a high-fat diet (HFD) composed of 60% fat, 20% CHO and 20% proteins (that comprised casein 200g, L-cystine 3 g, maltodextrin 125 g, sucrose 68.8, cellulose 50 g, soybean oil 25 g, sheep tallow 245 g, mineral mixture 10 g, vitamin mixture 10 g, dicalcium phosphate 13 g, calcium carbonate 5.5 g, potassium citrate 16.5 g, choline bitrate 2 g) [25, 26] for 3 weeks before the administration of streptozotocin (STZ). STZ powder was obtained from Sigma-Aldrich (St Louis, MO, USA). At the time of injection, a sterile sodium citrate buffer with a pH of 5-6 was used as the solvent for STZ. This solution was then intraperitoneally (i.p.) injected at 45 mg/kg body weight, as we proved previously that a high-fat diet and low dose of STZ induced diabetes until the end of the experiment [27, 28]. In the control group, a similar dose of the sterile prepared buffer was injected as a vehicle [29].
Verification of diabetes and care of diabetic rats
Diabetes in the model group was confirmed 1 week after STZ injection using a Randox reagent kit for determining fasting blood glucose levels (> 200 mg/dl) (Randox Laboratories Ltd., Crumlin, UK.) [27].
Measuring systolic arterial blood pressure
The indirect measurement approach utilized a non-invasive blood pressure monitor (LE 5001 Pressure Meter, Letica Scientific Instruments, Spain). Systolic blood pressure (SBP) was assessed in conscious, thermally acclimated (for 30 min at 28°C) rats using the tail-cuff method [30]. Arterial blood pressure evaluation was conducted on the animals upon completion of the study.
Sample collection and scarification
At the end of week 13, the rats were anaesthetized with sodium phenobarbital anaesthesia at 40 mg/kg body weight before sacrifice [31]. Blood samples were obtained from the rat tail vein and transferred to 10-milliliter Eppendorf tubes. Plasma was separated from the blood samples and utilized to measure the levels of various biochemical parameters including free fatty acids (FFA), triglycerides (TG), total cholesterol (CHO), high-density lipoprotein-C (HDL-C), urea, creatinine, kidney injury molecule-1 (KIM-1), neutrophil gelatinase-associated lipocalin (NGAL), malondialdehyde (MDA) superoxide dismutase (SOD) high-sensitivity C-reactive protein (hs-CRP), and nuclear factor κβ (NF-κB).
The animals were sacrificed using a high dose of sodium phenobarbital, and then both kidneys were removed. The right kidney underwent histological and immunological preparation, while the left kidney was processed for biochemical measurement of PKC/STAT3. The detection of stem cells in kidney tissues was confirmed by examining unstained sections with a fluorescent microscope.
Isolation and preparation of mesenchymal stem cells (MSCs)
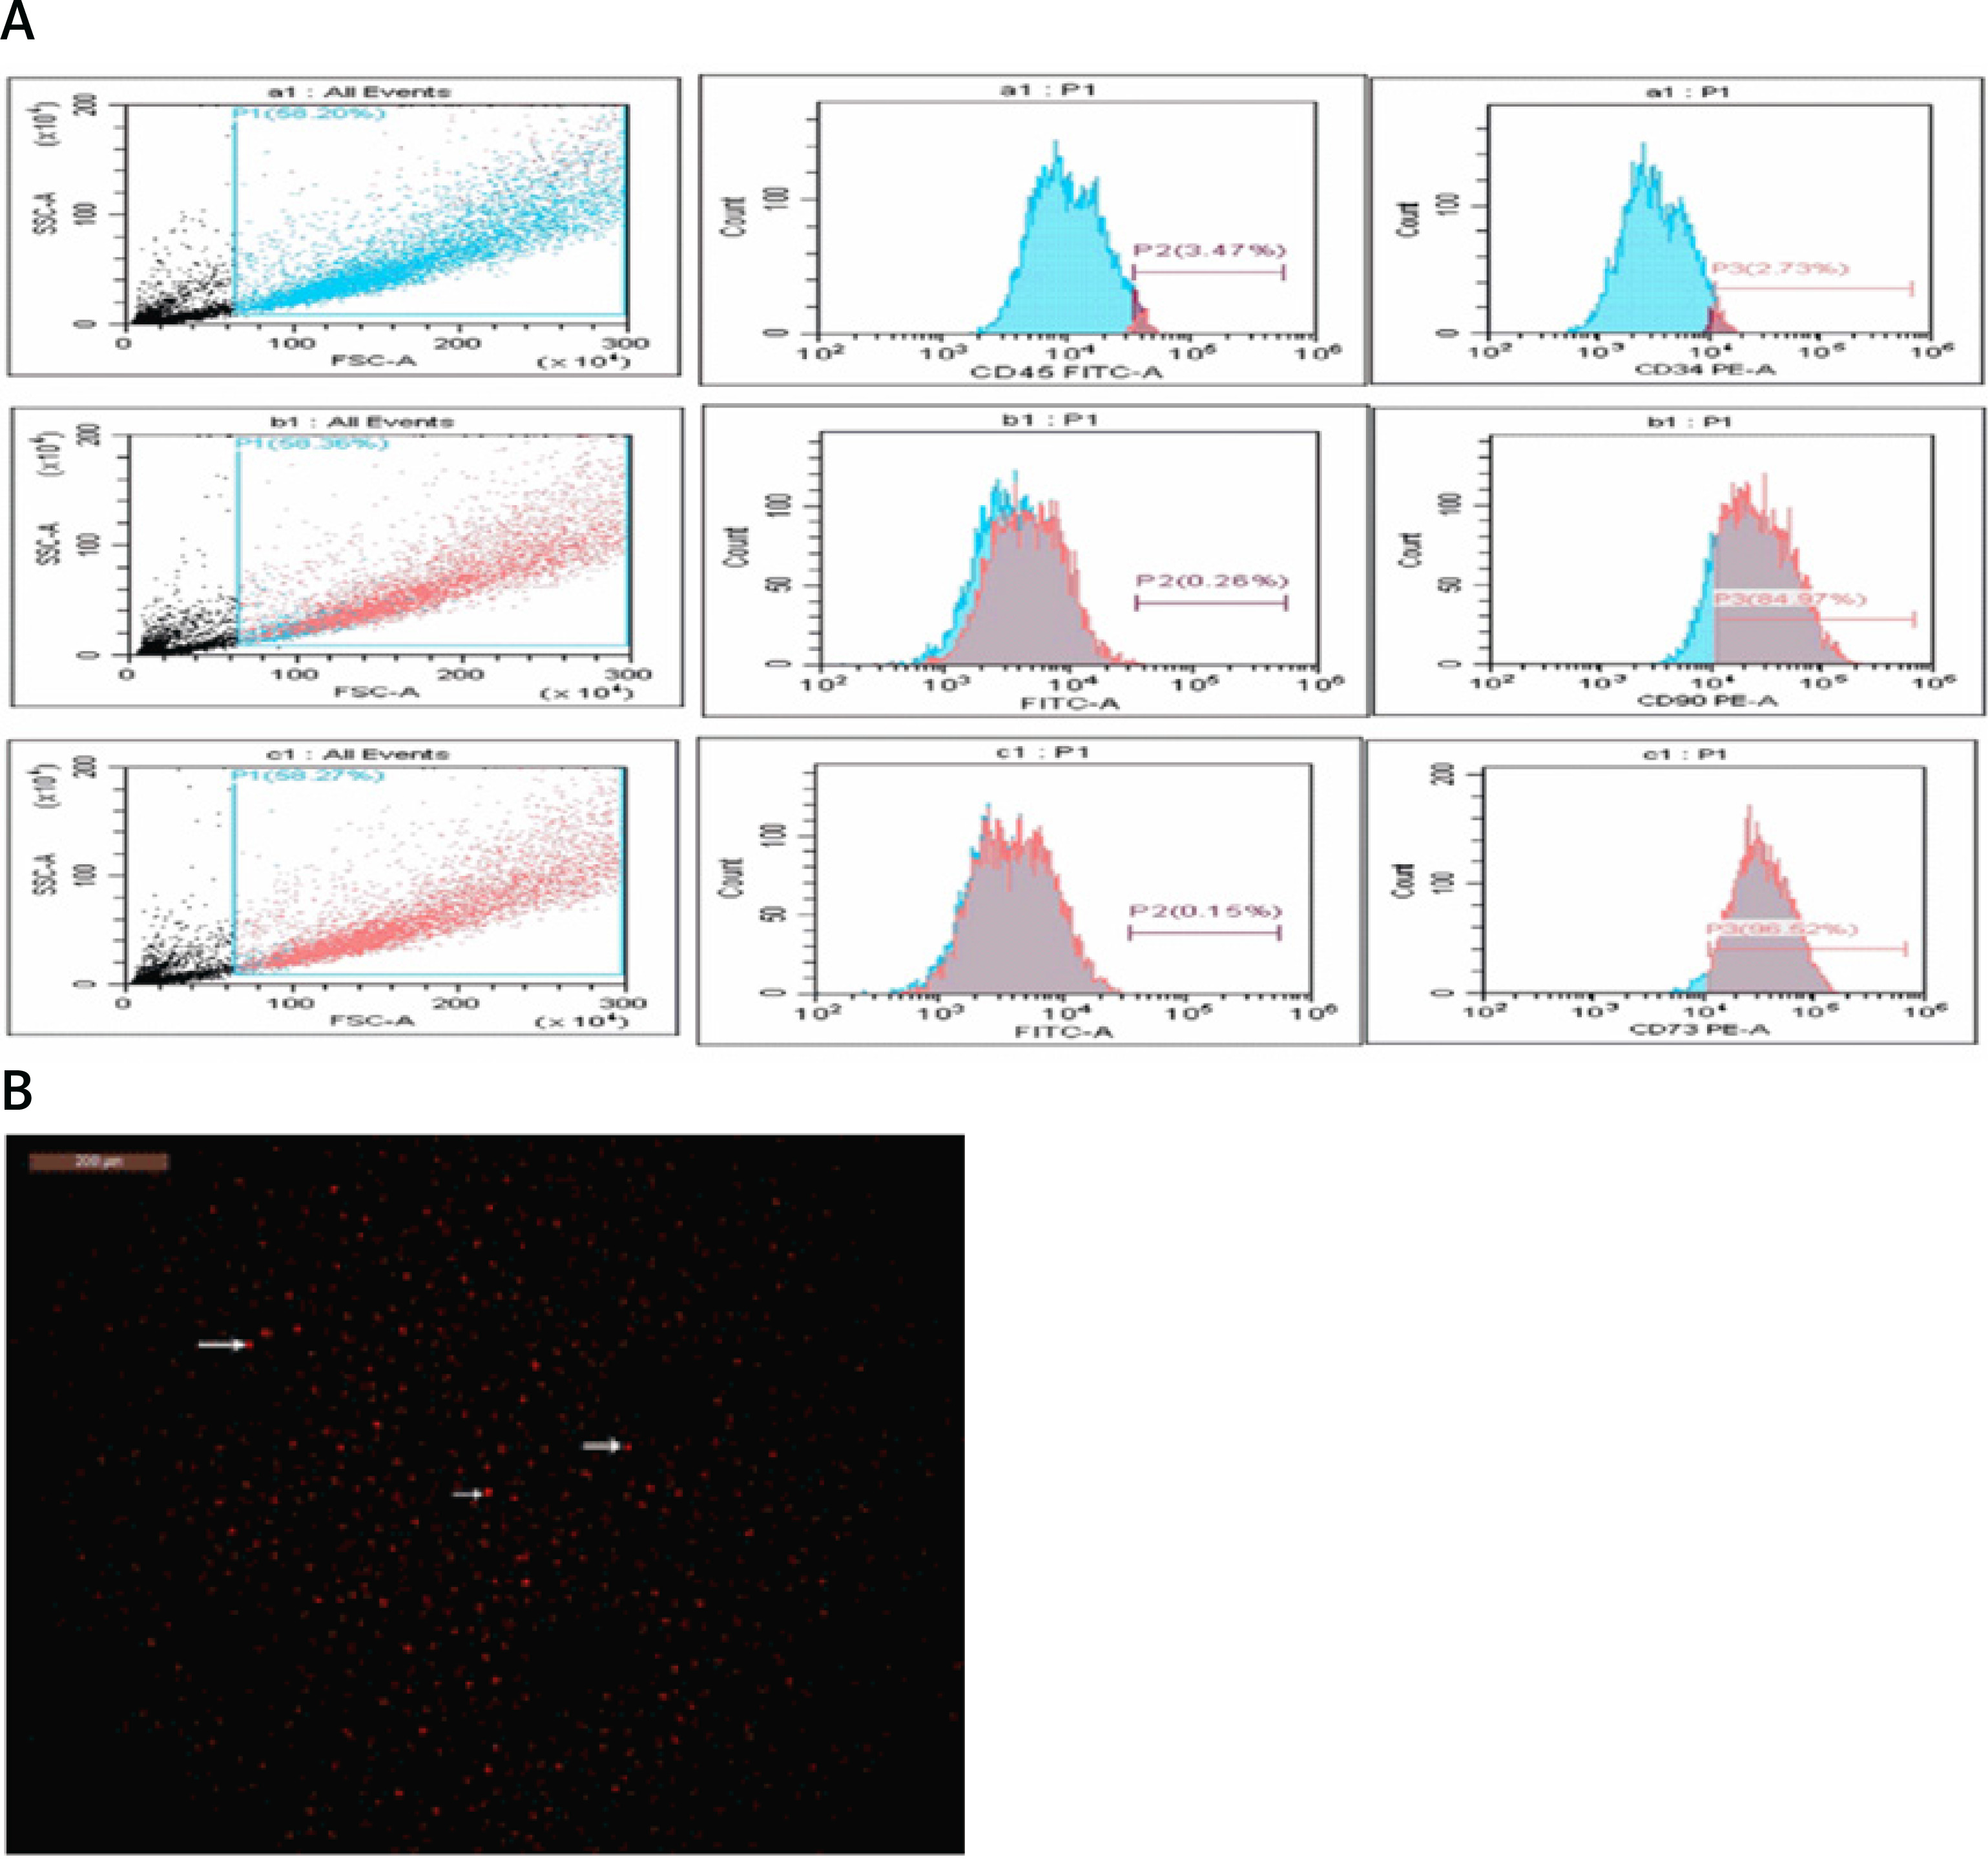
Male Wistar rat femurs were used to isolate MSCs. After the bone marrow cavity was flushed, the mononuclear cell layer was prepared by centrifuging the collected marrow samples. These cells were cultured on plastic dishes in Dulbecco’s modified Eagle’s medium, supplemented with 10% fetal calf serum (DMEM; Gibco, Grand Island, NY). Every 3 days, the culture media were refreshed until reaching 70–80% confluence. Subsequently, trypsin was used to separate the cells, which were subcultured until the fourth passage flow cytometry was used to identify the cells based on surface markers. Before transplantation, the enriched cells underwent flow cytometry analysis to confirm their purity and positive expression of CD73 and CD90, while they were negative for CD45 and CD34 phenotypic markers. The cells were then labelled with the PKH26 Red Fluorescent Cell Linker Kit (Sigma Aldrich) and injected into the rat tail vein [32].
Biochemical measurements
Estimation of serum fasting glucose, total cholesterol (TCH), high-density lipoprotein (HDL-C) and low-density lipoprotein (LDL-C) levels
We utilized the Rat Glucose Assay Kit (Catalog #81693) to measure serum glucose level, which operates on a multi-step reaction principle. The resulting dye is quantified by measuring absorbance at 505 nm, directly correlating to glucose concentration in the rat specimen. Enzyme-linked immunosorbent assay (ELISA) was used to measure the levels of CHO, high-density lipoprotein cholesterol (HDL-C), and low-density lipoprotein cholesterol (LDL-C) in serum samples. Total cholesterol (Catalog No. ABIN772507), HDL-C, and LDL-C rat ELISA Kit (Catalog No: MBS266554) were utilized. The color intensity was measured spectrophotometrically using a microplate reader.
Estimation of serum urea and creatinine levels
Kidney function was evaluated by measuring serum urea and creatinine using colorimetry and reagent kits (Urea Colorimetric Assay Kit Cat. No. E-BC-K329-S Houston, Texas; and Creatinine Assay Kit (Colorimetric) (ab204537) Waltham, United States).
Estimation of kidney injury molecule-1 (KIM-1) and neutrophil gelatinase-associated lipocalin (NGAL)
Rat Kim-1 ELISA Kit (MyBiosource, Cat. # MBS355395) and Rat NGAL ELISA Kit (MyBiosource, Cat. # MBS260195) were used to determine serum KIM-1 and NGAL. All procedures were carried out following the manufacturer’s instructions.
Estimation of biomarkers of oxidative stress, inflammatory biomarkers and NF-κB
All the animals’ serum samples were collected, and oxidative stress and inflammatory indicators were measured. The TBARS Assay Kit (Cayman Chemical Company, Ann Arbor, MI, USA; item 10009055) was used to determine malondialdehyde (MDA). The Superoxide Dismutase (SOD) kit (Item No. 706002, Cayman Chemical Company, Ann Arbor, MI, USA) was utilized for the measurement as directed by the manufacturer. Using an ELISA kit from BIOTANG INC (Cat. No. R6365, MA, USA), TNF-α was quantified. The IL-6 ELISA kit (Cat No. ELR-IL6-001), acquired from RayBio, GA, USA., was used to measure IL-6. The Rat Nuclear Factor Kappa B (NFkB) ELISA Kit (Cat. # MBS453975, MyBiosource) was used to measure NF-κB.
Estimation of PKC/STAT3 using reverse transcription and real-time quantitative polymerase chain reaction (PCR)
The renal tissues underwent homogenization following a specified protocol to extract total RNA. Subsequently, cDNA synthesis was performed using the reverse transcription kit from Takara Biomedical Technology, Dalian, Liaoning, China. The Agilent-Stratagene Mx3000P Q-PCR System (Agilent Technologies Inc, Santa Clara County, CA, USA) was employed for PCR amplification. The resulting data were normalized to the reference β-actin gene. Primer sequences utilized were as follows: PKC-α forward, 5′-CAAGCAGTGCGTGATCAATGT-3′; PKC-α reverse, 5′-GGTGACGTGCAGCTTTTCATC-3′; STAT3 forward, 5′-CAGCAATACCATTGACCTGCC-3′; STAT3 reverse, 5′-TTTGGCTGCTTAAGGGGTGG-3′; β-actin forward: 5′-TCGTGCGTGACATTAAAGAG-3′; and reverse: 5′-ATTGCCGATAGTGATGACCT-3′.
Histological and immunological assessment of renal tissues
Collected specimens of renal tissues were fixed in 10% formal saline for a day before being dehydrated with increasing alcohol grades. As previously described, the tissues were cleared and embedded in paraffin using standard procedures [33]. Paraffin blocks were sectioned into 4 µm thick slices, and the deparaffinized sections were stained with hematoxylin and eosin (H&E).
We employed Masson staining to quantify renal collagen build-up. The slides were dipped in 0.01 M hydrochloric acid following overnight incubation with 0.1% Masson (Sigma-Aldrich, Gillingham, Dorset, UK). Sections were subjected to overnight incubation at 4°C with anti-α SMA (Cat # PA5-85070, Thermo Fisher, USA) antibody for immunohistochemistry, then 30-minute room temperature incubation with the secondary antibody. The sections were counterstained with Meyer’s hematoxylin.
Quantification of collagen deposition in Masson-stained sections and determination of the percentage of α-SMA immunostaining were performed. This analysis used the Leica Qwin 500 C image analyzer (Cambridge, UK) in eight non-overlapping fields for each section or group [34]. To analyze and compare the means and standard deviations of the quantitative data we used (ANOVA) and post hoc analysis (Tukey test) to analyze and compare the means and standard deviations of the quantitative data. A p-value lower than 0.05 is deemed statistically significant. The computations were performed using GraphPad Prism (version 6).
Statistical analysis
The data were expressed as mean ± standard deviation (SD) [34]. Data were processed, and then GraphPad Prism (version 6) was used for analysis. The Shapiro-Wilk test and normality plots were used to confirm that the data were normal. For variables that follow a normal distribution, the unpaired Student t-test was utilized to evaluate differences between the two groups; for variables that are not normally distributed, the Mann-Whitney test was employed. For regularly distributed variables, one-way ANOVA was employed, followed by Tukey’s post hoc test; for non-normally distributed variables, non-parametric Kruskal-Wallis was utilized. Pearson correlation analysis was employed to examine the correlation between two distinct parameters. A p-value ≤ 0.05 was considered to indicate statistical significance.
Results
Mesenchymal stem cells improved fasting blood glucose and lipid profile associated with increased body weight and decreased sbp in diabetic rats
Results presented in Table I show that administering MSCs to T2DM rats improved their lipid profile and fasting blood glucose levels. In particular, the T2DM group had significantly higher fasting blood glucose and total cholesterol (TCH) levels than the control group (p < 0.0001). Furthermore, there was a significant difference in HDL-C levels between the T2DM group and the control group and higher LDL-C levels in the diabetic group in comparison to the control group. Compared to the T2DM group, the administration of MSCs improved TCH HDL-C, LDL-C, and fasting blood glucose levels, but these changes did not entirely return to control levels (p < 0.0001). In addition, the T2DM group showed a substantial increase in systolic blood pressure (SBP) and a significant decrease in body weight compared to the control group (p < 0.0001). However, MSC administration effectively increased body weight and decreased SBP compared to the T2DM group (p < 0.0001) (Figure 1).
Table I
MSCs improved fasting blood glucose lipid profile, body weight and SBP in T2DM animals. Changes in fasting blood glucose, TCH, TG, cholesterol, and HDL-C in control, T2DM, T2DM + MSCs groups. Data presented as mean ± SD; astatistically significant compared to the corresponding value in the control group (p < 0.0001), bstatistically significant compared to the corresponding value in the T2DM group (p < 0.0001) (n = 8)
Figure 1
BM-MSC identification and characteristics. A – The isolated and grown MSCs were identified based on their immunological features; they were positive for CD90 and CD73 but negative for CD45 and CD34. B – BM-MSC characteristics and identification. Using a fluorescence microscope to examine cardiac tissue sections, it was possible to see that BM-MSCs labelled with PKH26 fluorescent dye had homing properties (red fluorescence)
Mesenchymal stem cells attenuate dysregulated kidney injury biomarkers
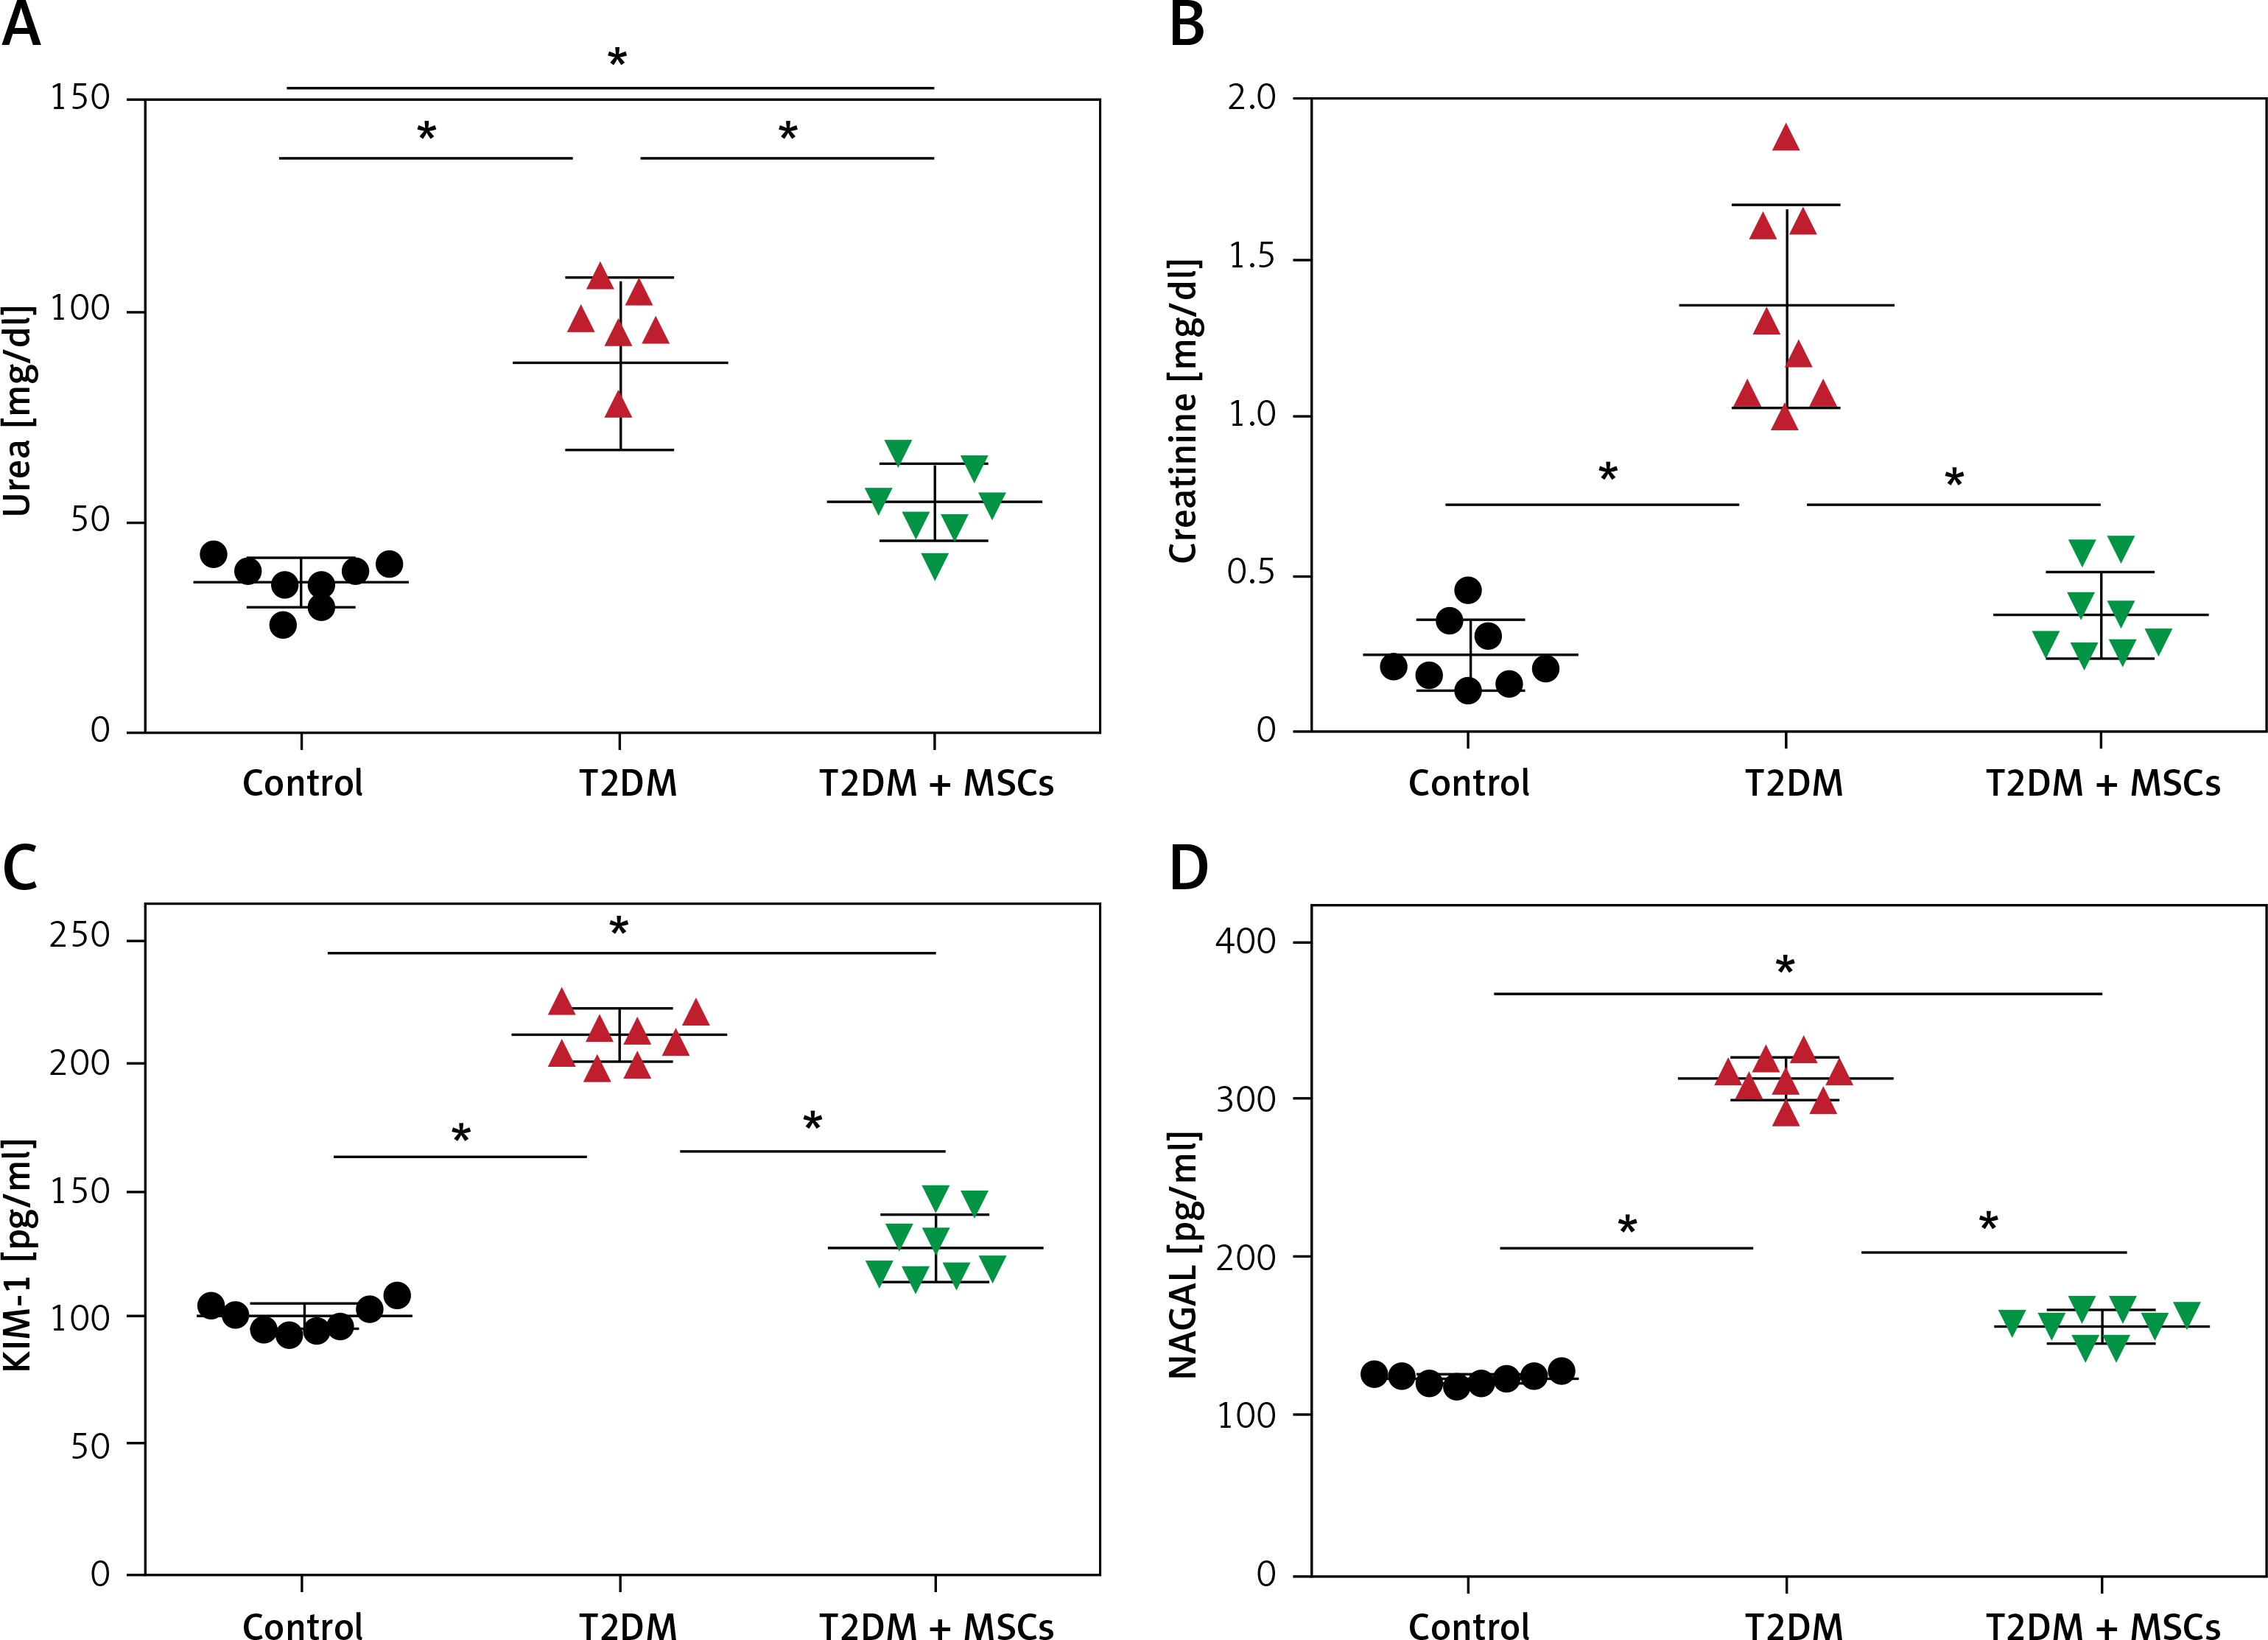
The levels of urea (87.44 ±19.76 mg/dl), creatinine (1.34 ±0.19 mg/dl), KIM-1 (210.6 ±10.07 pg/ml), and NAGAL (312.8 ±13.25 pg/ml) were significantly higher in the T2DM group compared to the corresponding values in the control group (urea: 35.74 ±5.527 mg/dl, creatinine: 0.2425 ±0.1317 mg/dl, KIM-1: 100.1 ±5.29 pg/ml, NAGAL: 122.8 ±3.01 pg/ml). Administration of MSCs was able to attenuate kidney injury, as indicated by significantly lower levels of urea (54.89 ±8.81 mg/dl), creatinine (0.495 ±0.06 mg/dl), KIM-1 (127.9 ±13.0 pg/ml), and NAGAL (154.6 ±10.40 pg/ml) compared to the corresponding values in the diabetic group (Figure 2).
Figure 2
Changes in serum urea (A), creatinine (B), and the indicators of kidney injury KIM-1 (C) and NAGAL (D) in control, T2DM, T2DM + MSCs groups. The data are presented as mean ± SD*: statistically significant in comparison to the control group’s corresponding value (p < 0.0001) and statistically significant in comparison to the T2DM group’s corresponding value (p < 0.0001) (n = 8)
MSCs ameliorate oxidative stress and inflammatory biomarkers in diabetic rats
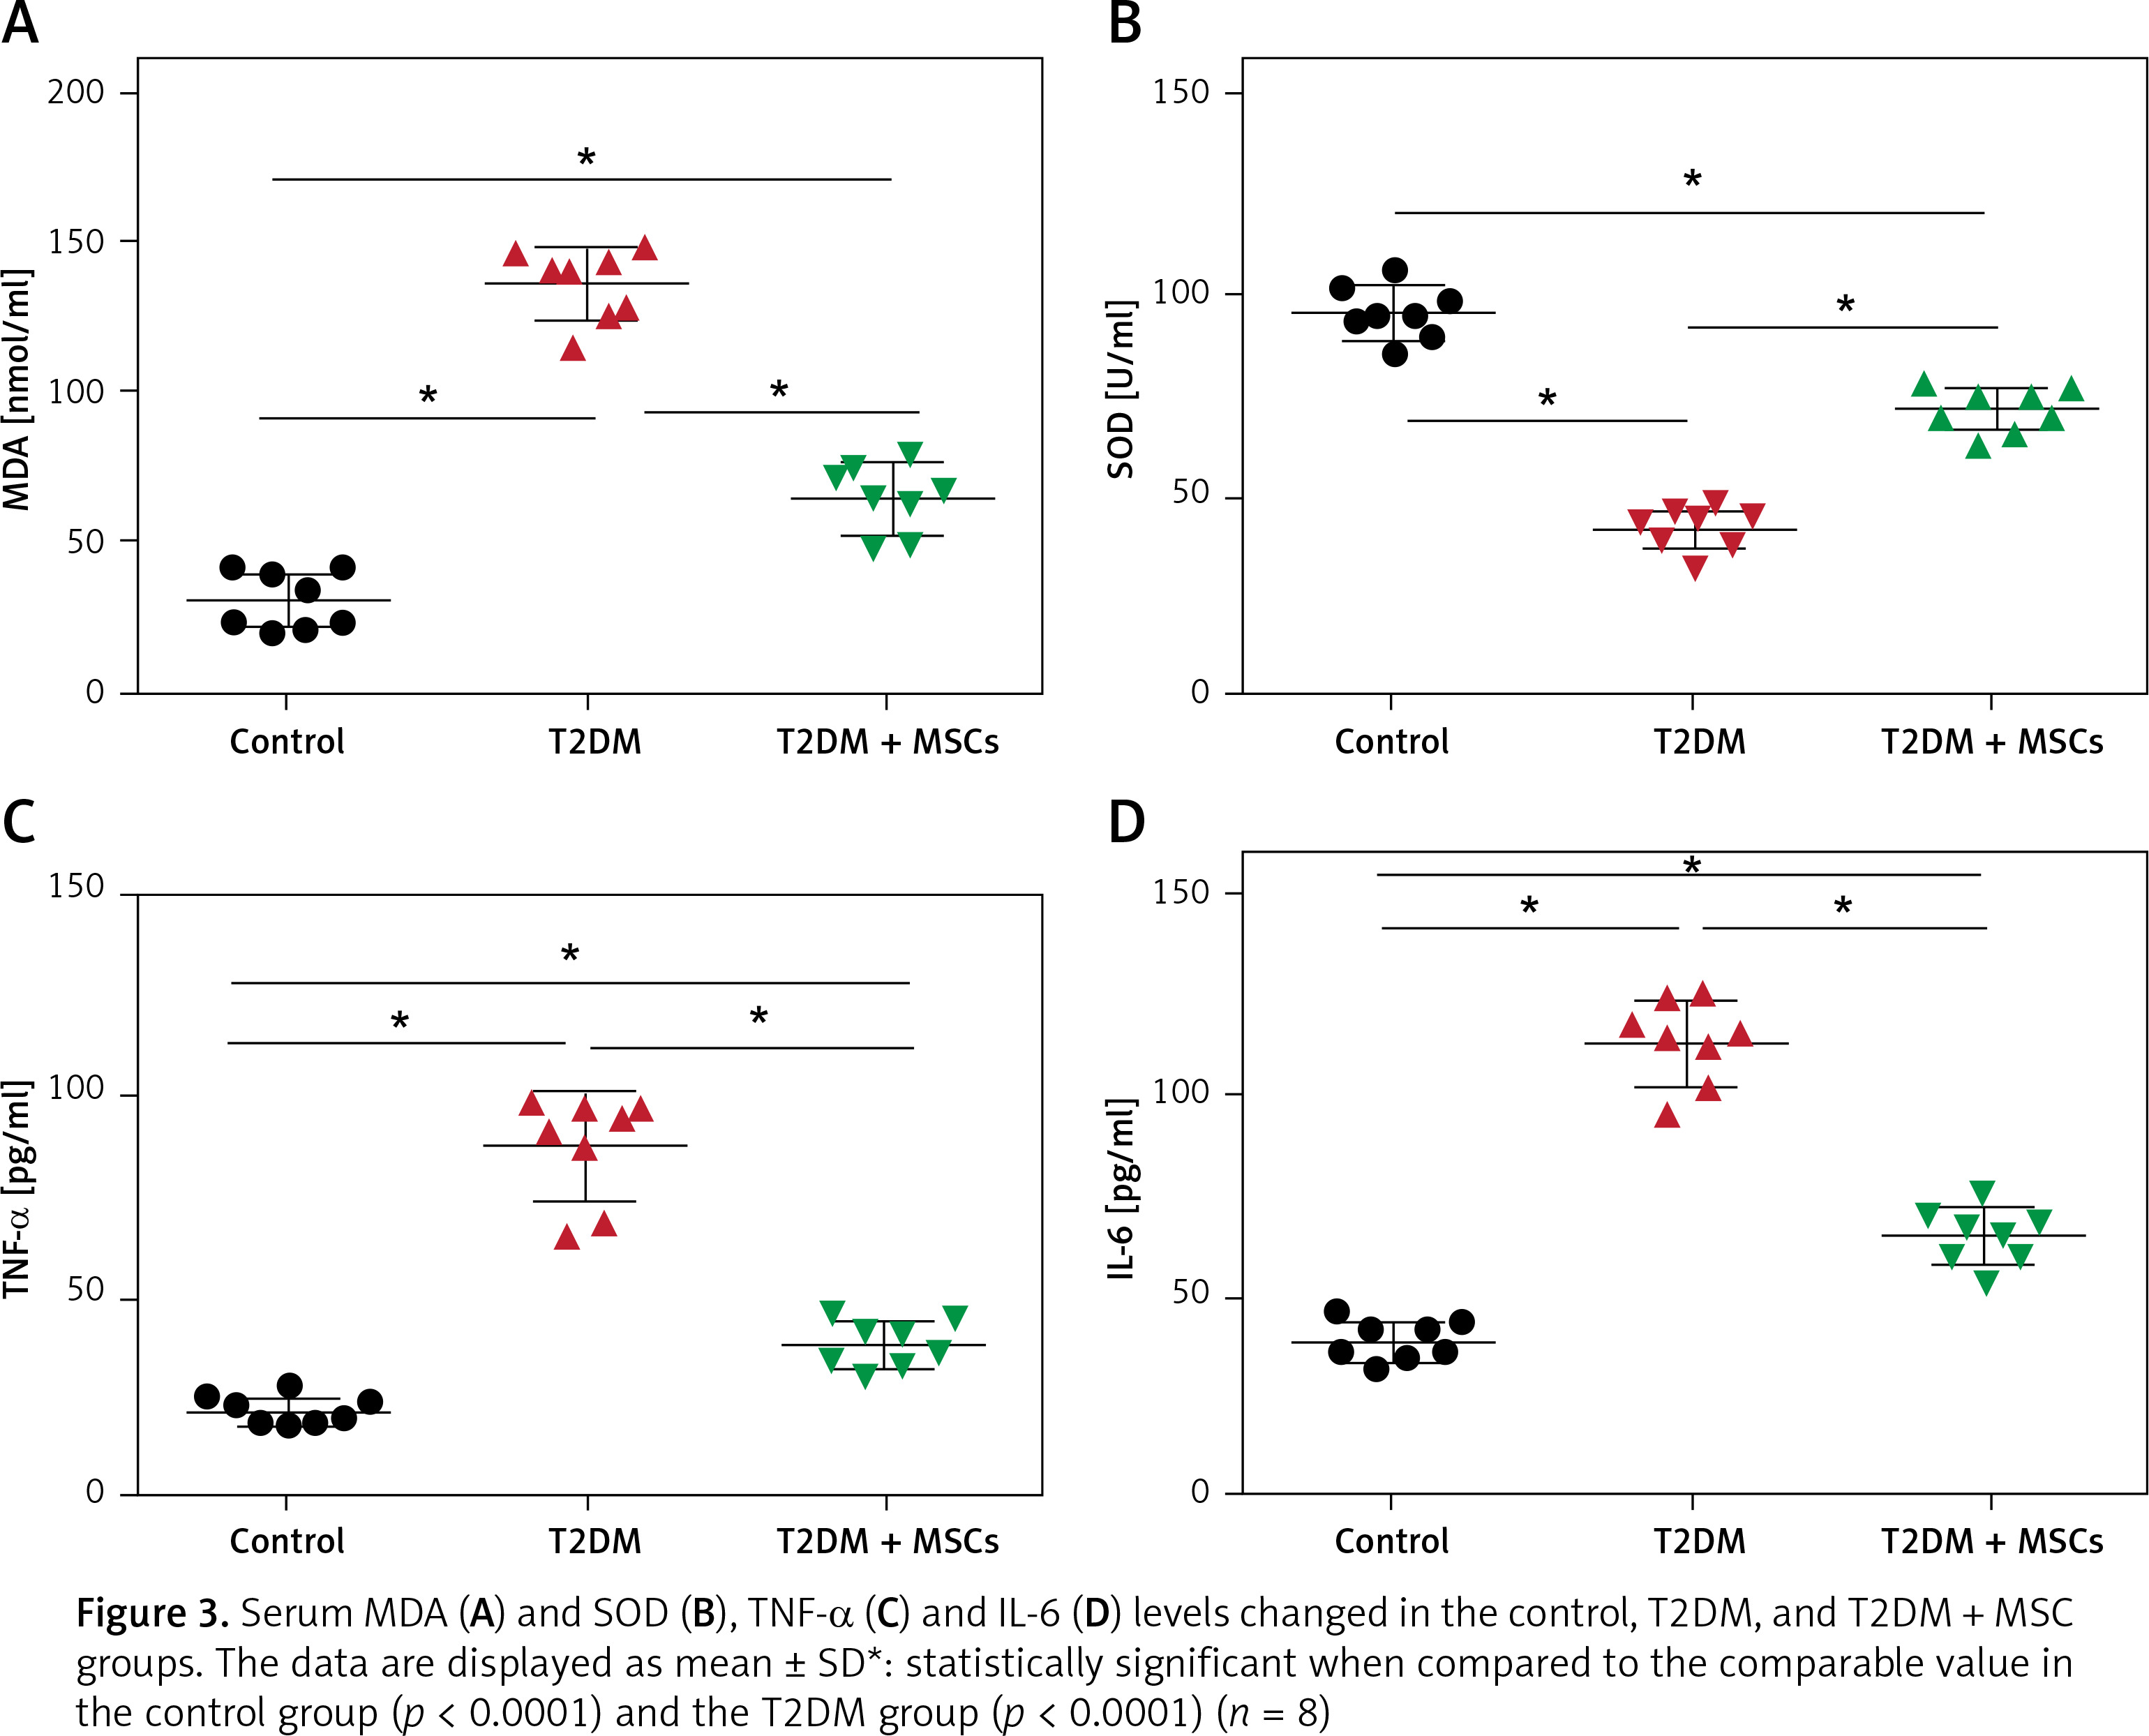
In the T2DM group, levels of MDA were significantly higher (136.7 ±11.83 mmol/ml) than in the control group (31.53 ±9.35 mmol/ml), while SOD levels were significantly lower (41.45 ±5.129 U/ml) compared to the control group (95.15 ±6.54 U/ml). However, after the administration of MSCs, there was a significant decrease in MDA levels (65.29 ±12.05 mmol/ml) and an increase in SOD levels (71.15 ±5.43 U/ml) compared to the values in the T2DM group, as shown in Figures 3 A, B. Moreover, Figures 3 C, D reveal significantly higher serum TNF (87.38 ±11.50 pg/ml) and IL-6 (113.5 ±10.53 pg/ml) in the T2DM group compared to the control group (TNF: 21.03 ±3.28 pg/ml and IL-6: 38.38 ±5.05 pg/ml, respectively). However, the administration of MSCs resulted in significantly lower TNFα (38.35 ±6.25 pg/ml) and IL-6 (64.80 ±6.86 pg/ml) levels compared to the T2DM group.
MSCs attenuate the dysregulated PKC/NF-κB/STAT3 pathway in diabetic rats
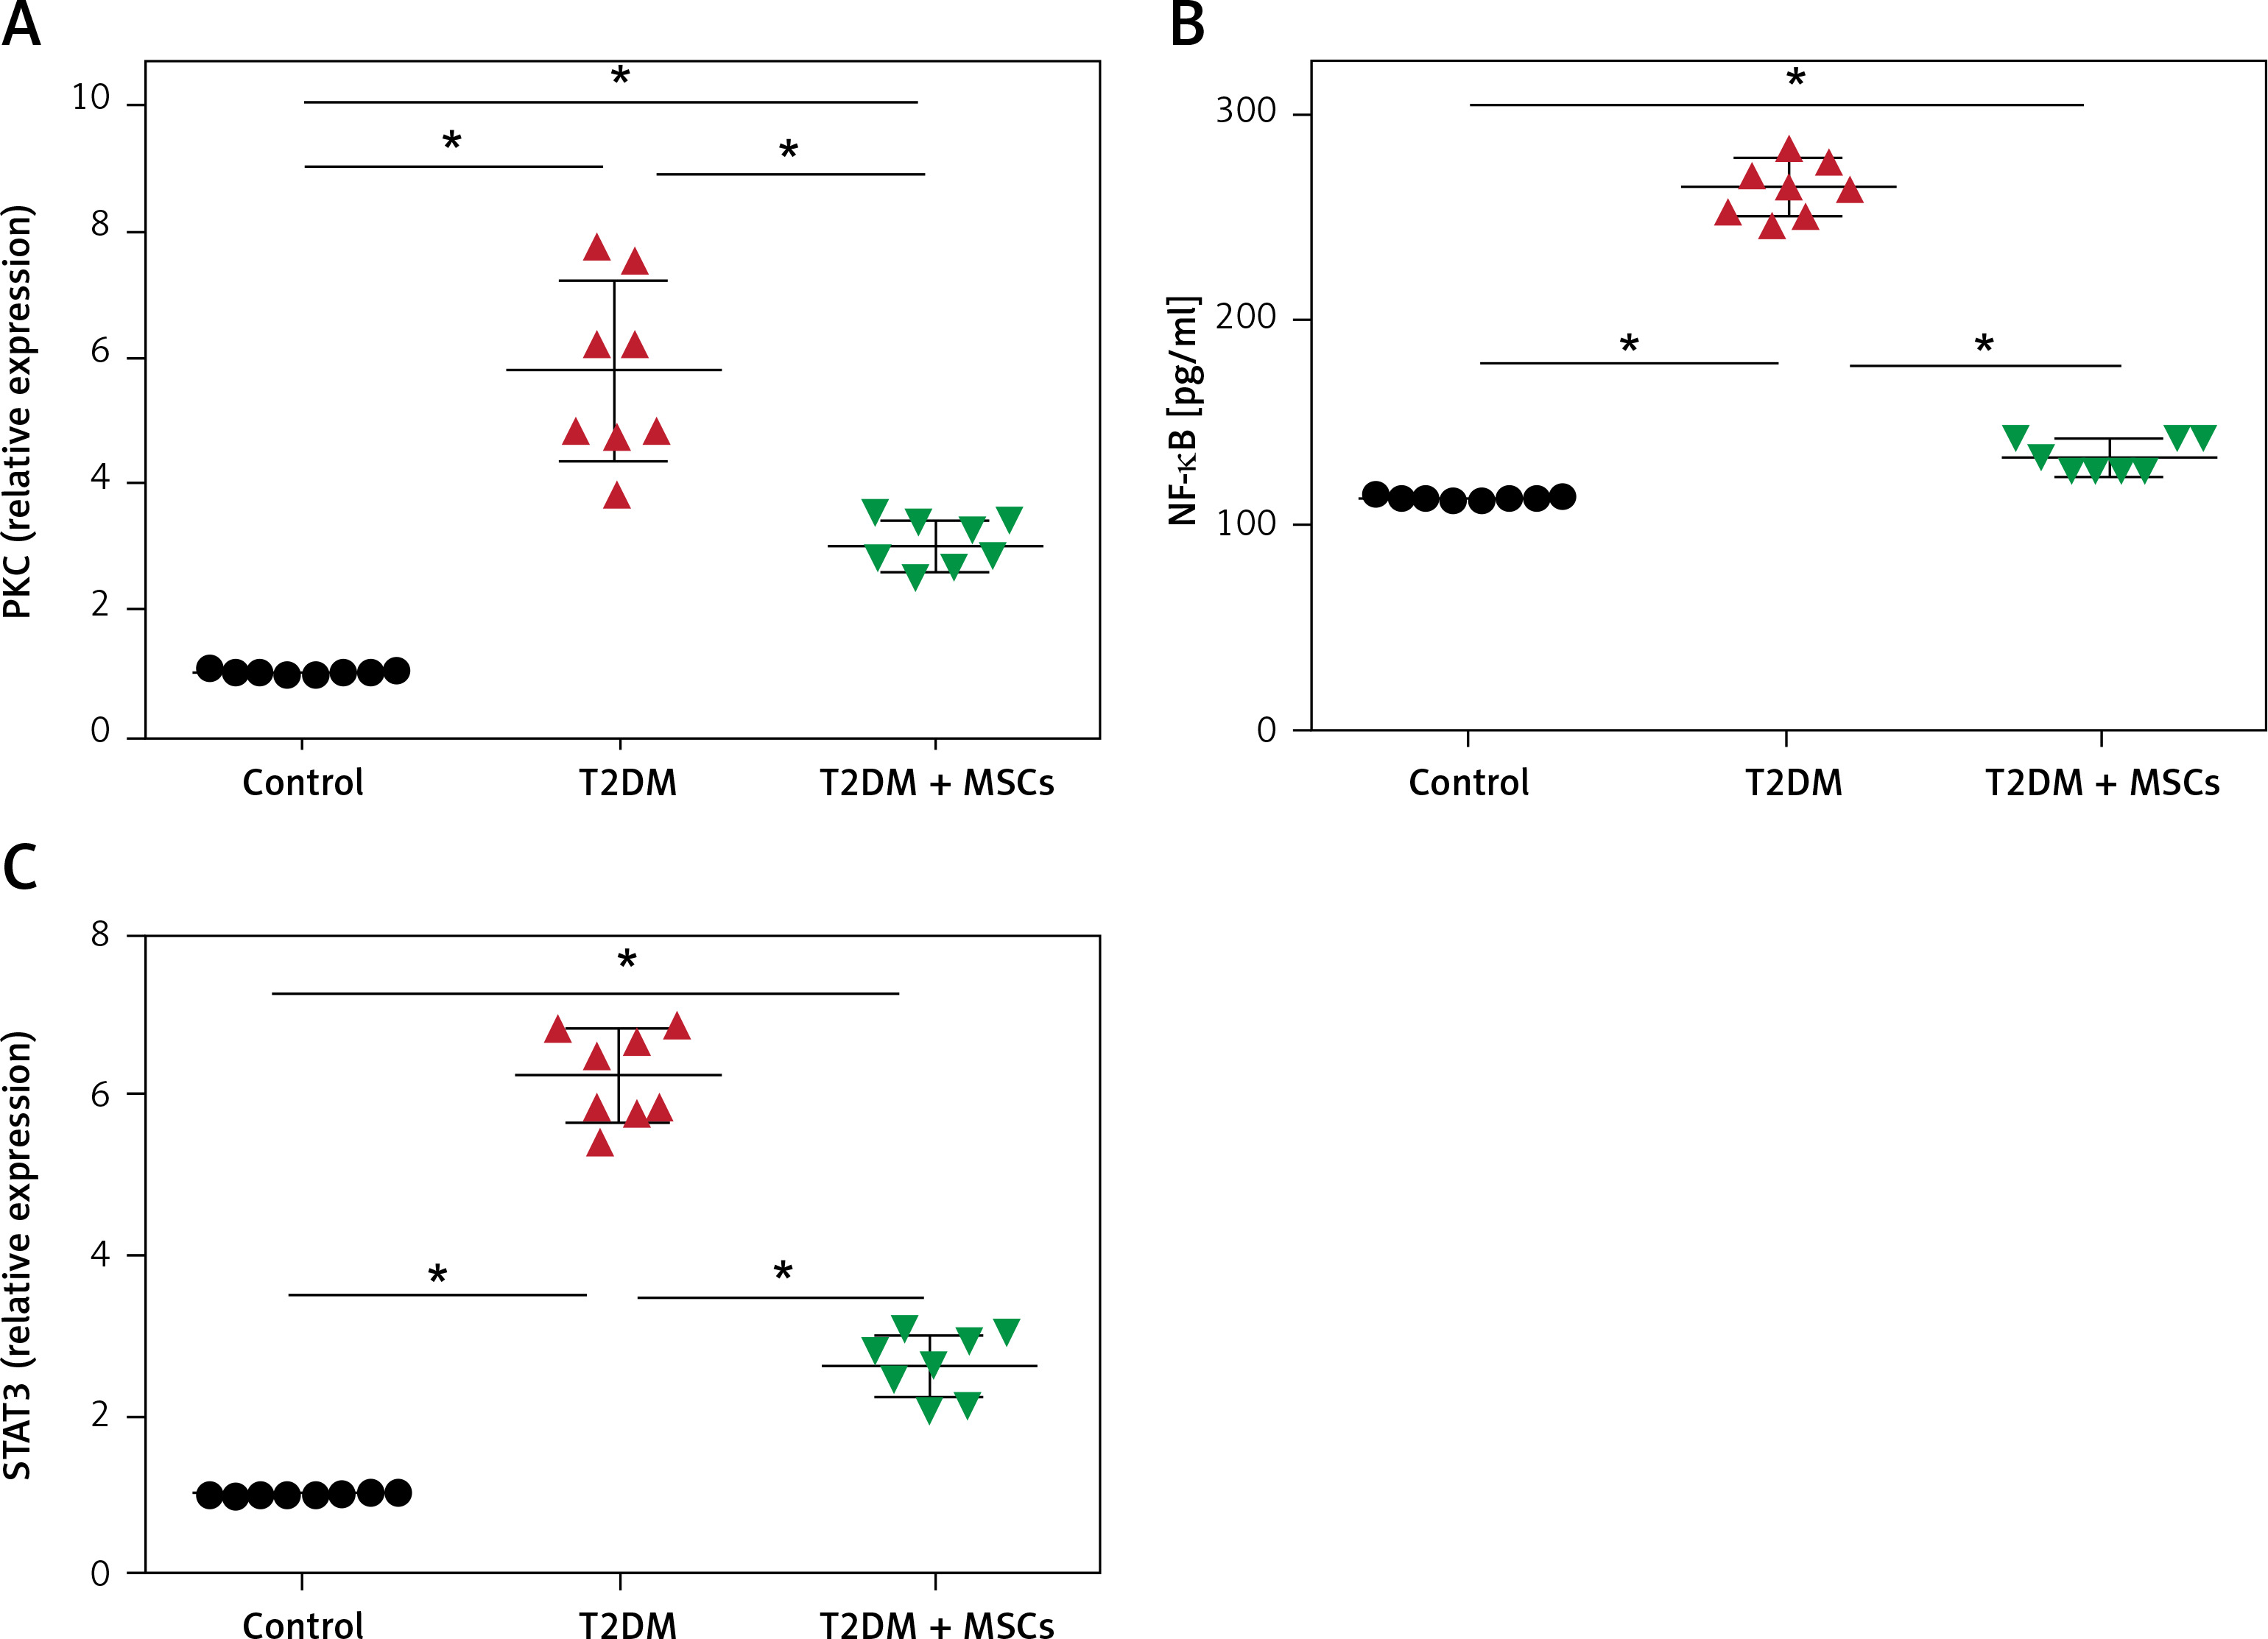
The results showed significantly higher PKC (5.79 ±1.40), NF-κβ (269.10 ±16.18), and STAT3 (6.23 ±0.55) compared to the control group (PKC: 1.03 ±0.02, NF-κβ: 114.9 ±2.41 pg/ml, and STAT3: 1.022 ±0.012, respectively). MSC administration resulted in significantly lower levels of PKC (3.06 ±0.39), NF-κβ (138.9 ±11.3pg/ml) and STAT3 (2.62 ±0.39) compared to the diabetic groups (Figure 4).
Figure 4
PKC (A), and STAT3 (C) levels were quantified by PCR and NF-kB (B) by ELISA in control, T2DM, and T2DM + MSCs groups. Results are displayed as mean ± SD*: statistically significant when compared to the equivalent value in the control group (p < 0.0001) and the T2DM group (p < 0.0001) (n = 8)
MSCs protected against diabetes-induced kidney injury and fibrosis
Diabetic nephropathy is marked by increased glomerular basement membrane thickness and mesangial matrix expansion, which eventually results in end-stage renal disease and renal fibrosis [35]. Therefore, we assessed all rat groups’ kidney injury and fibrosis levels (Figures 5–7). After staining with H&E (Figures 5 A–F), Masson (Figures 6 A–D), and α-SMA (Figures 7 A–D) stains, kidney sections were examined by light microscopy.
Figure 5
Photomicrographs of H&E-stained sections of the renal cortex. (A, B) Proximal (P) and distal (D) convoluted tubules bordered with cuboidal cells displaying vesicular nuclei (v) and acidophilic cytoplasm; Malpighian renal corpuscle with glomerulus (G); and narrow Bowman’s space (arrow) can be seen in the control group. (A, D) Diabetic group: dilated convoluted tubules (wavy arrow), dilated blood vessels (B), and deformed renal corpuscles (arrowhead). Vacuolated cytoplasm (curved arrow) and tiny, darkly-stained nuclei (P) are visible in the tubular epithelial cells. (F, E) The T2DM+MSCs group shows proximal (P) and distal (D) convoluted tubules bordered with cuboidal cells that display vesicular (v) and acidophilic cytoplasm, but some cells also have pyknotic nuclei (P). A few dilated convoluted tubules are visible (wavy arrow). (A, D, F ×400; C, E, ×200) (50 μm and 20 μm scale bars)
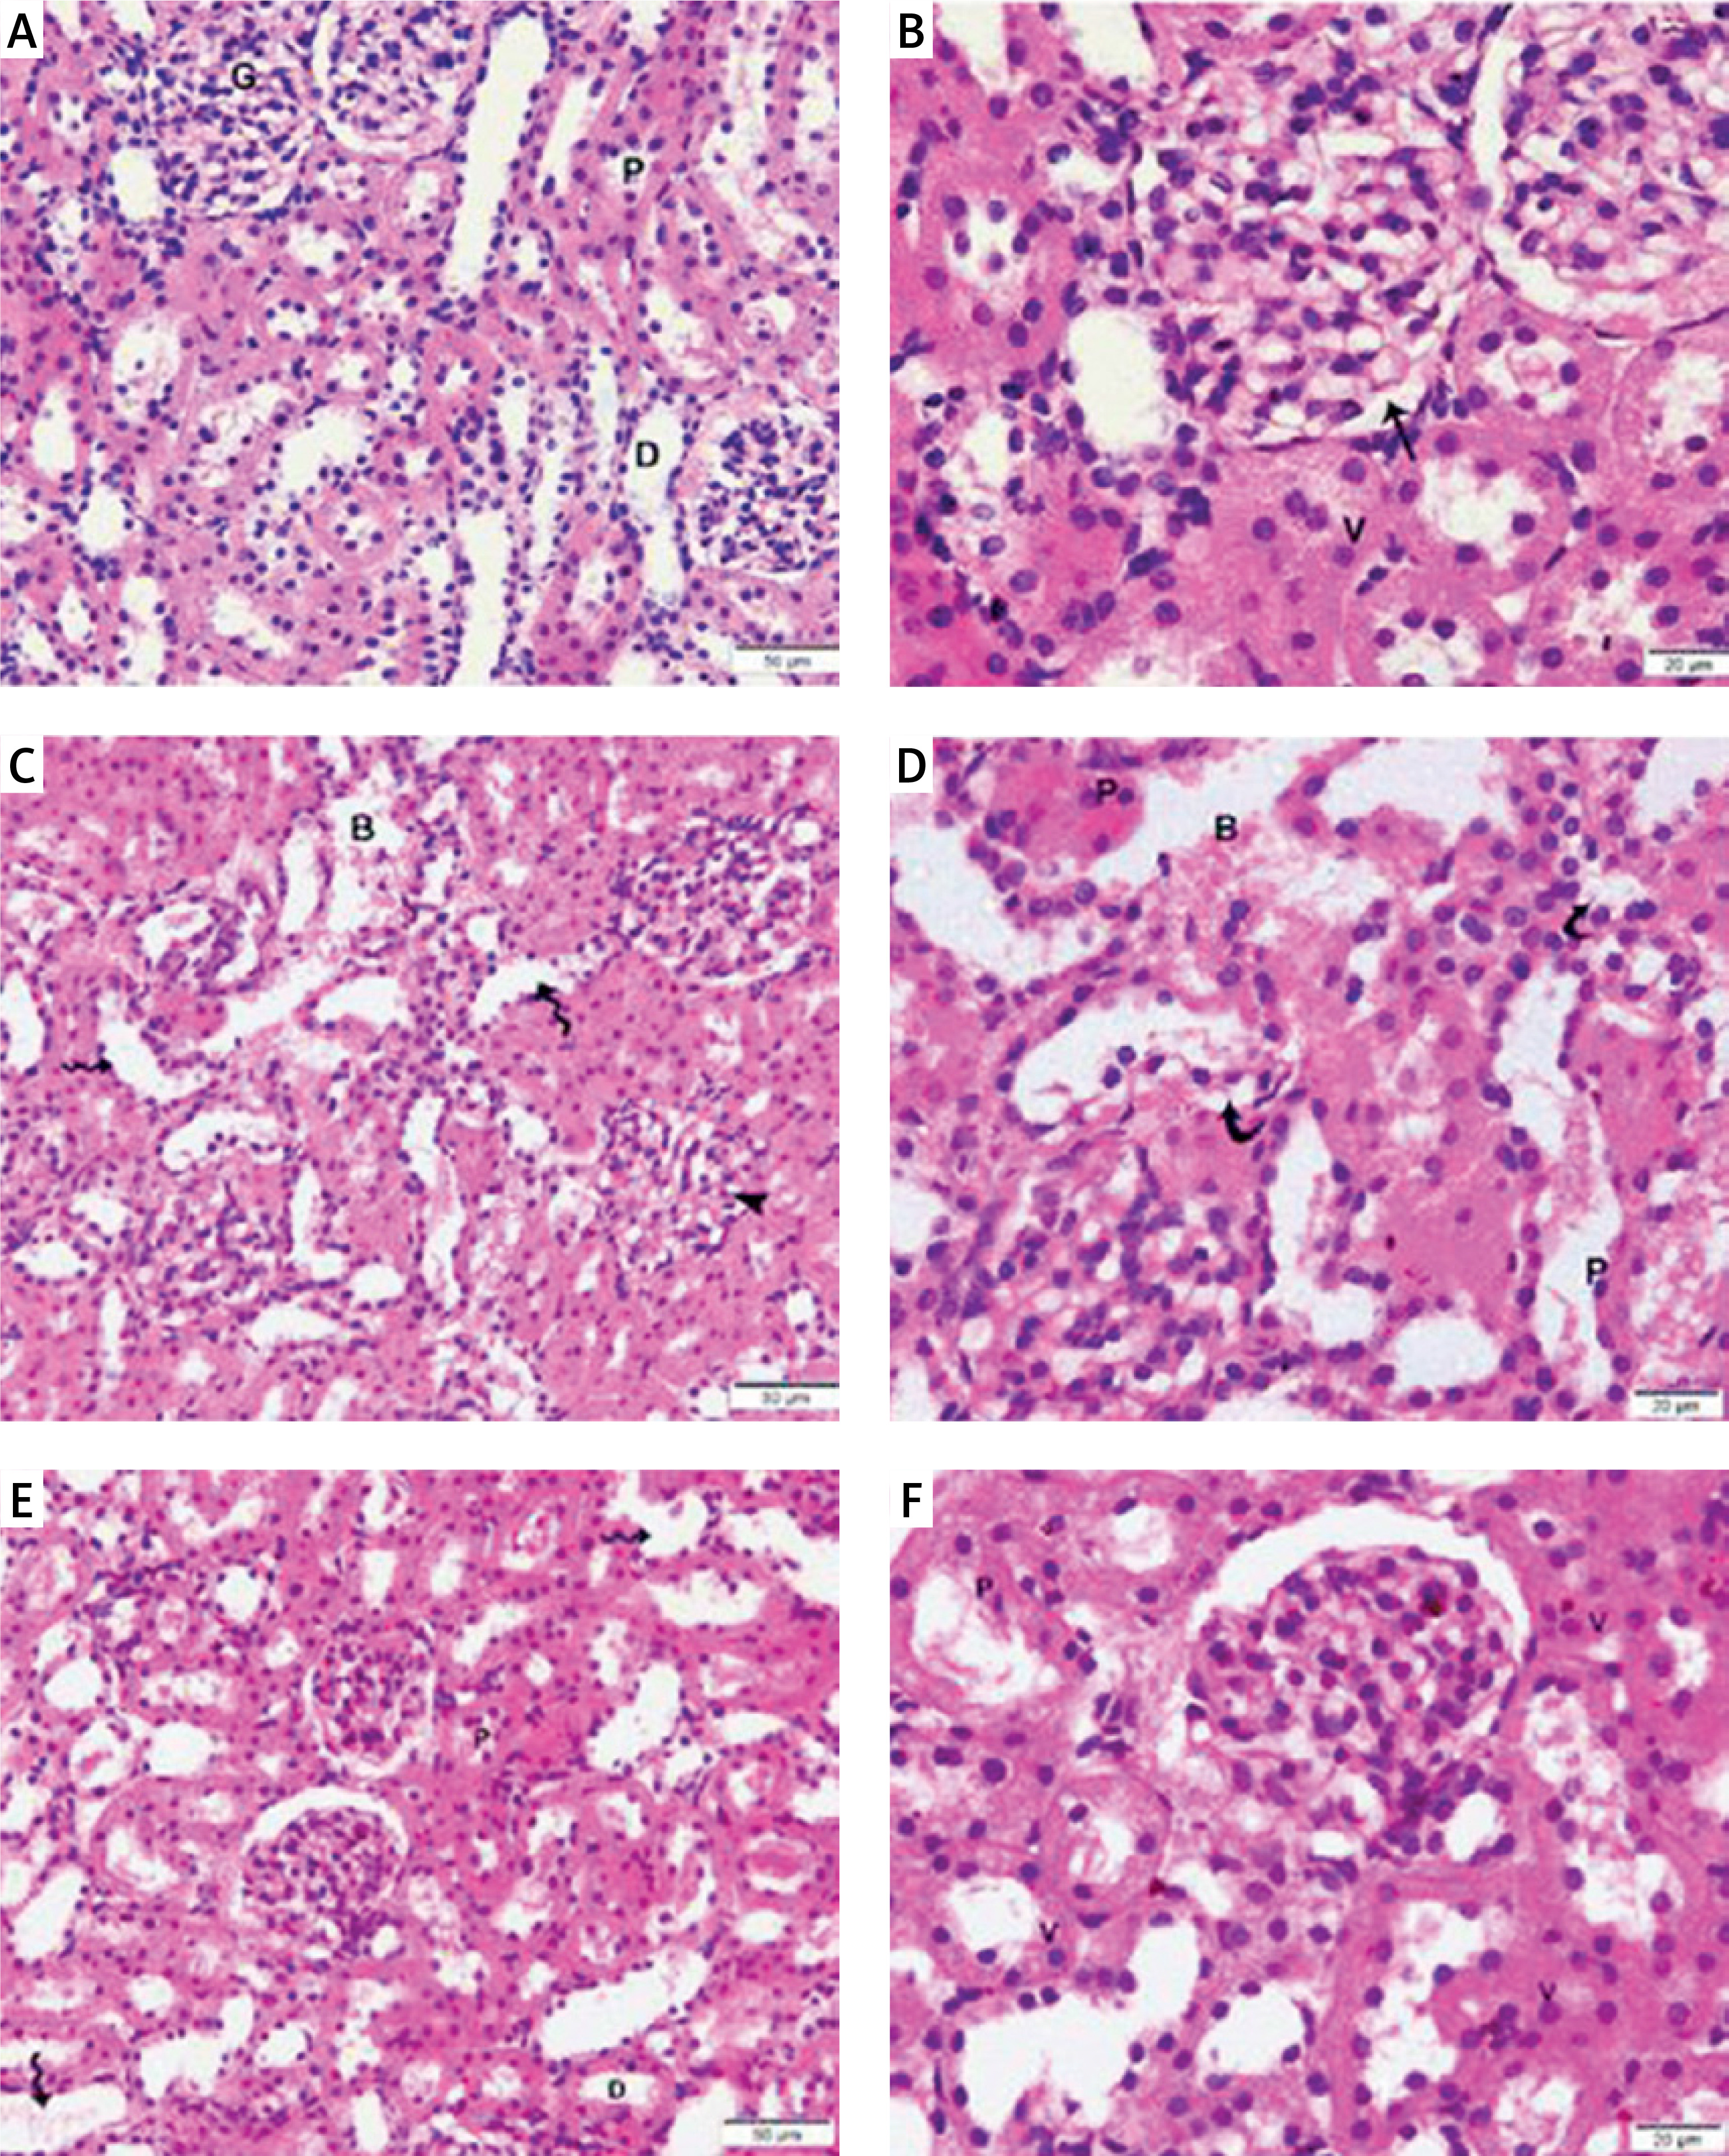
Figure 6
Photomicrographs of Masson-stained sections of the renal cortex. A – Collagen deposition (arrow) in the glomerulus’ interstitium observed in the control group. B – Diabetic group: coarse collagen deposition (arrow) in the deformed glomeruli and renal interstitium between tubules and blood vessels. C – T2DM + MSCs group: modest localized collagen deposition in the glomeruli and convoluted tubules (×200) (50 μm scale bar). D – Calculation of the average area percentage of the collagen deposit
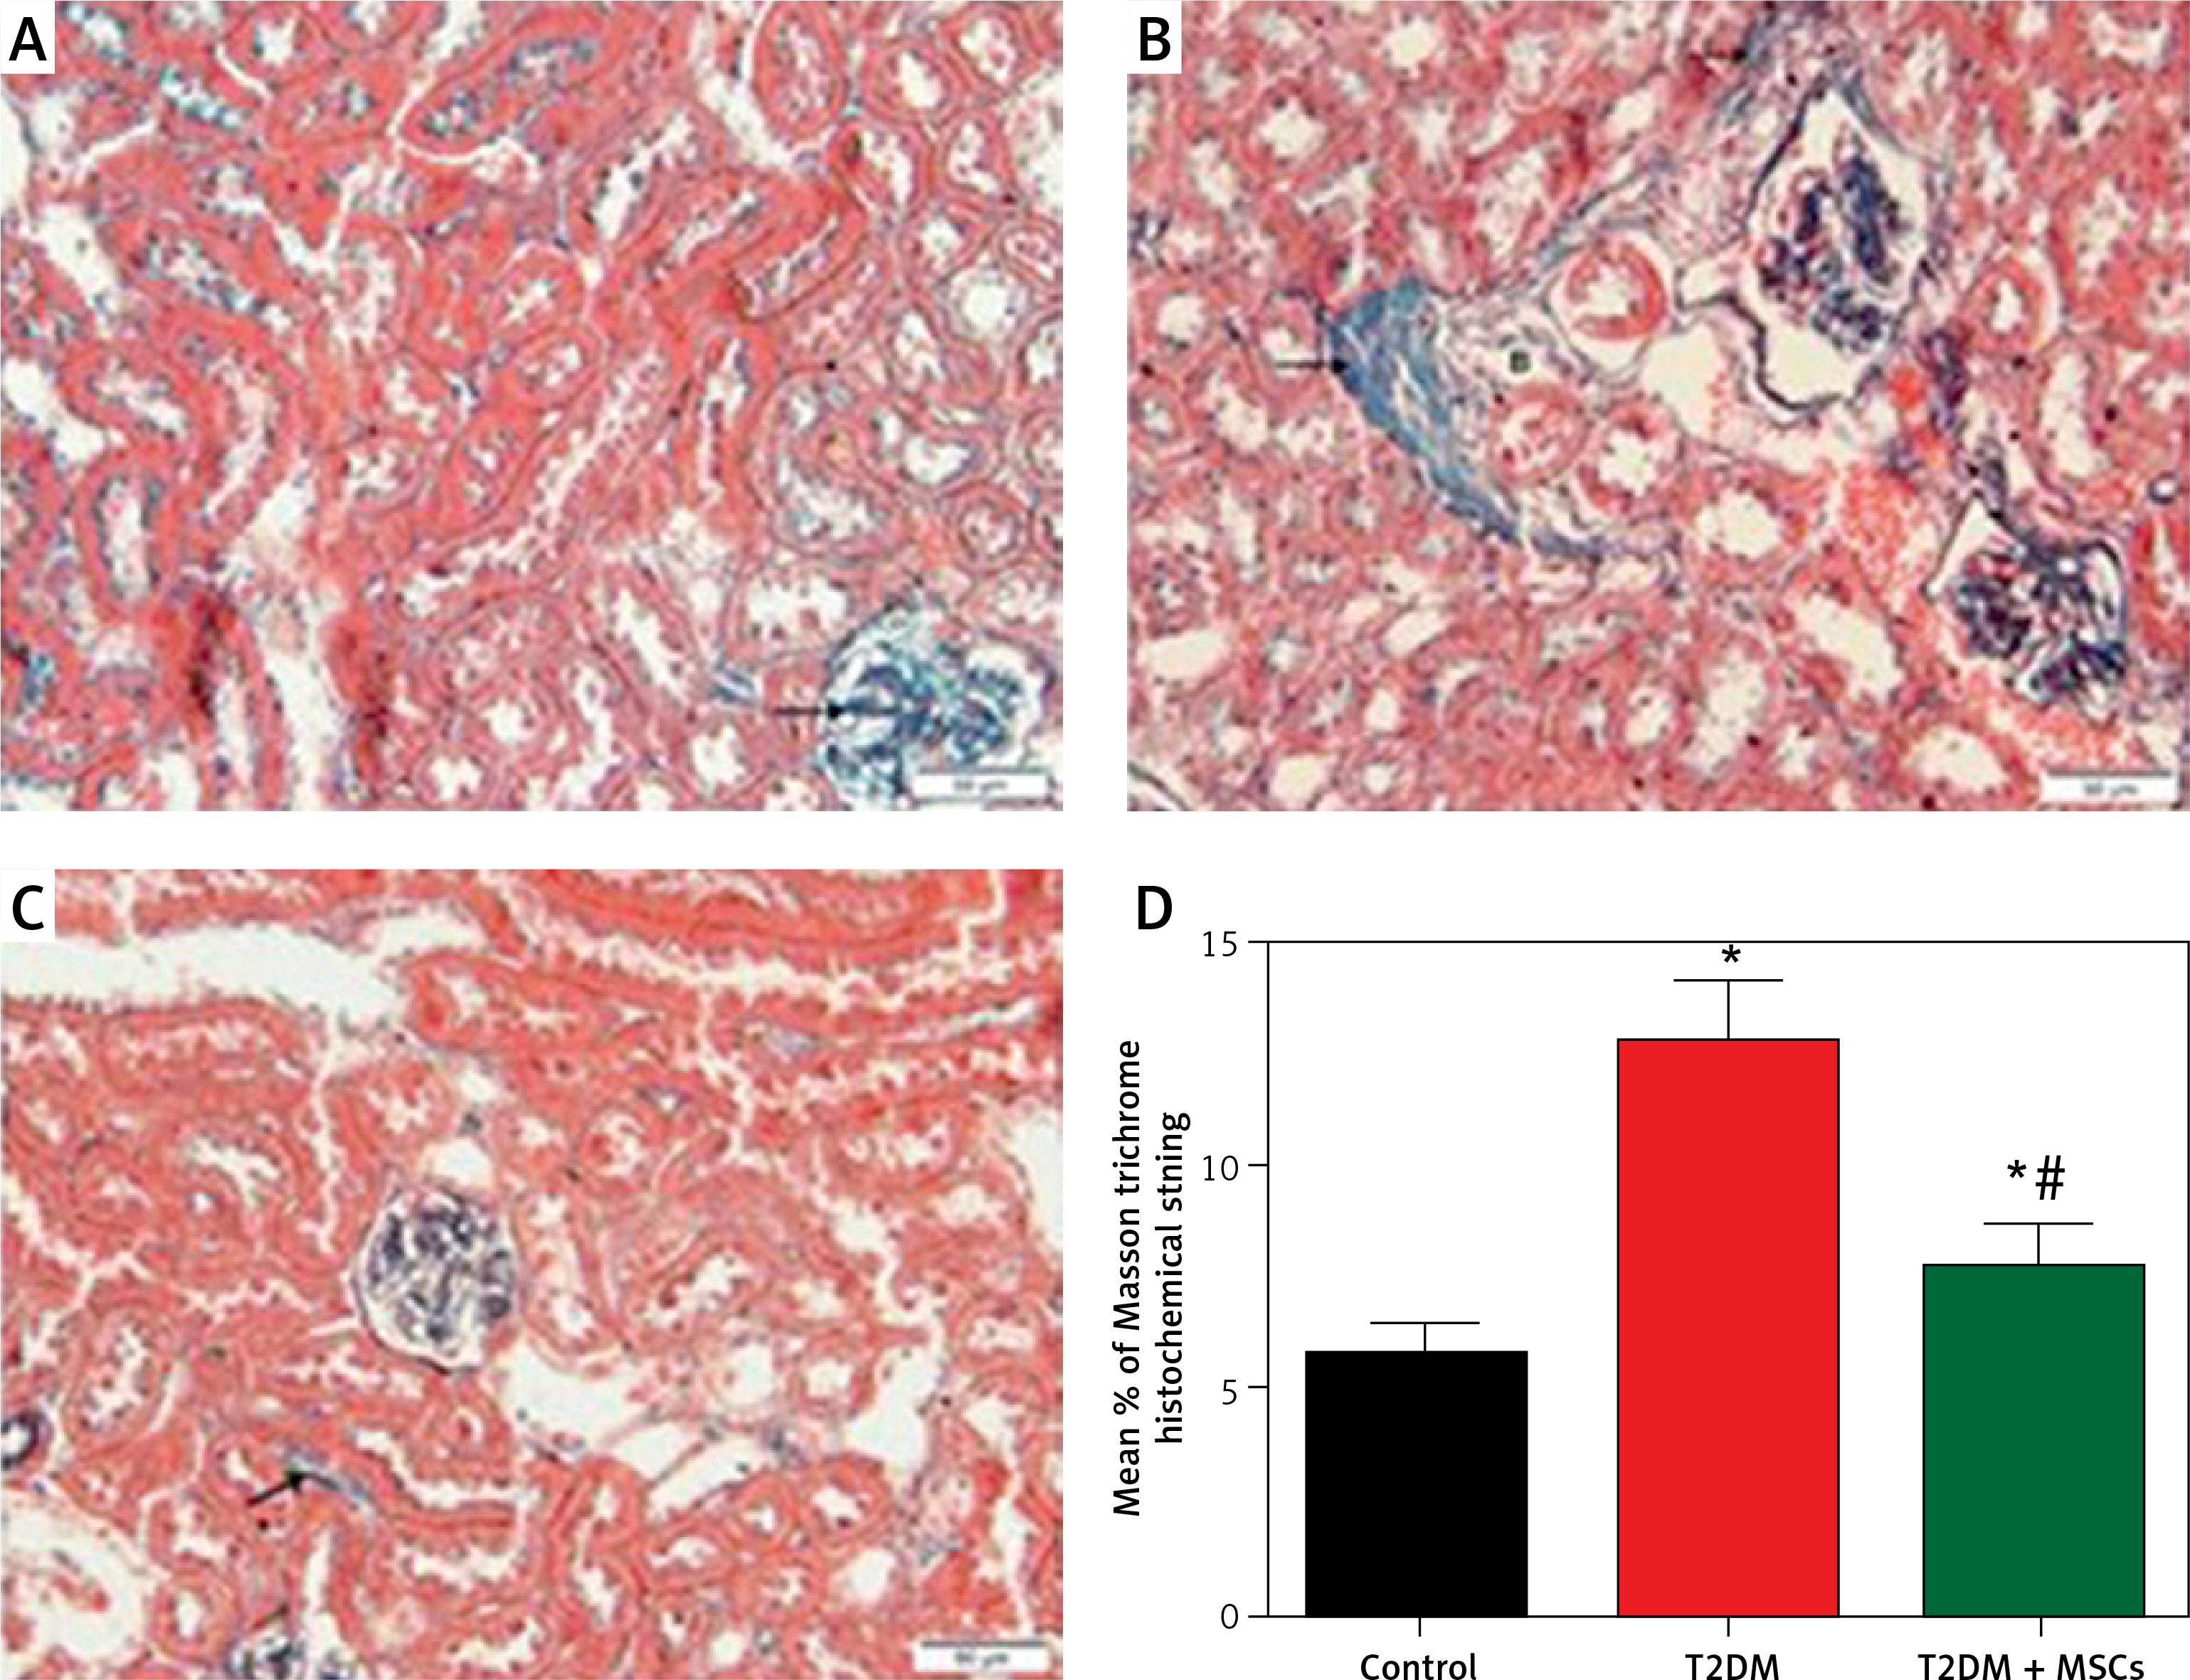
Figure 7
Photomicrographs of α-SMA-stained sections in the renal cortex. A – Control group blood vessel walls with modest positive α-SMA immunostaining (arrow). B – Diabetic group: renal interstitium and blood vessel walls show coarse, widespread positive α-SMA immunostaining (arrow). Minimal positive α-SMA immunostaining (arrow) in the renal interstitium and blood vessel walls (C) T3DM + MSCs group (×200) (50 μm scale bar). D – Calculation of the average percentage of α-SMA immunostaining area
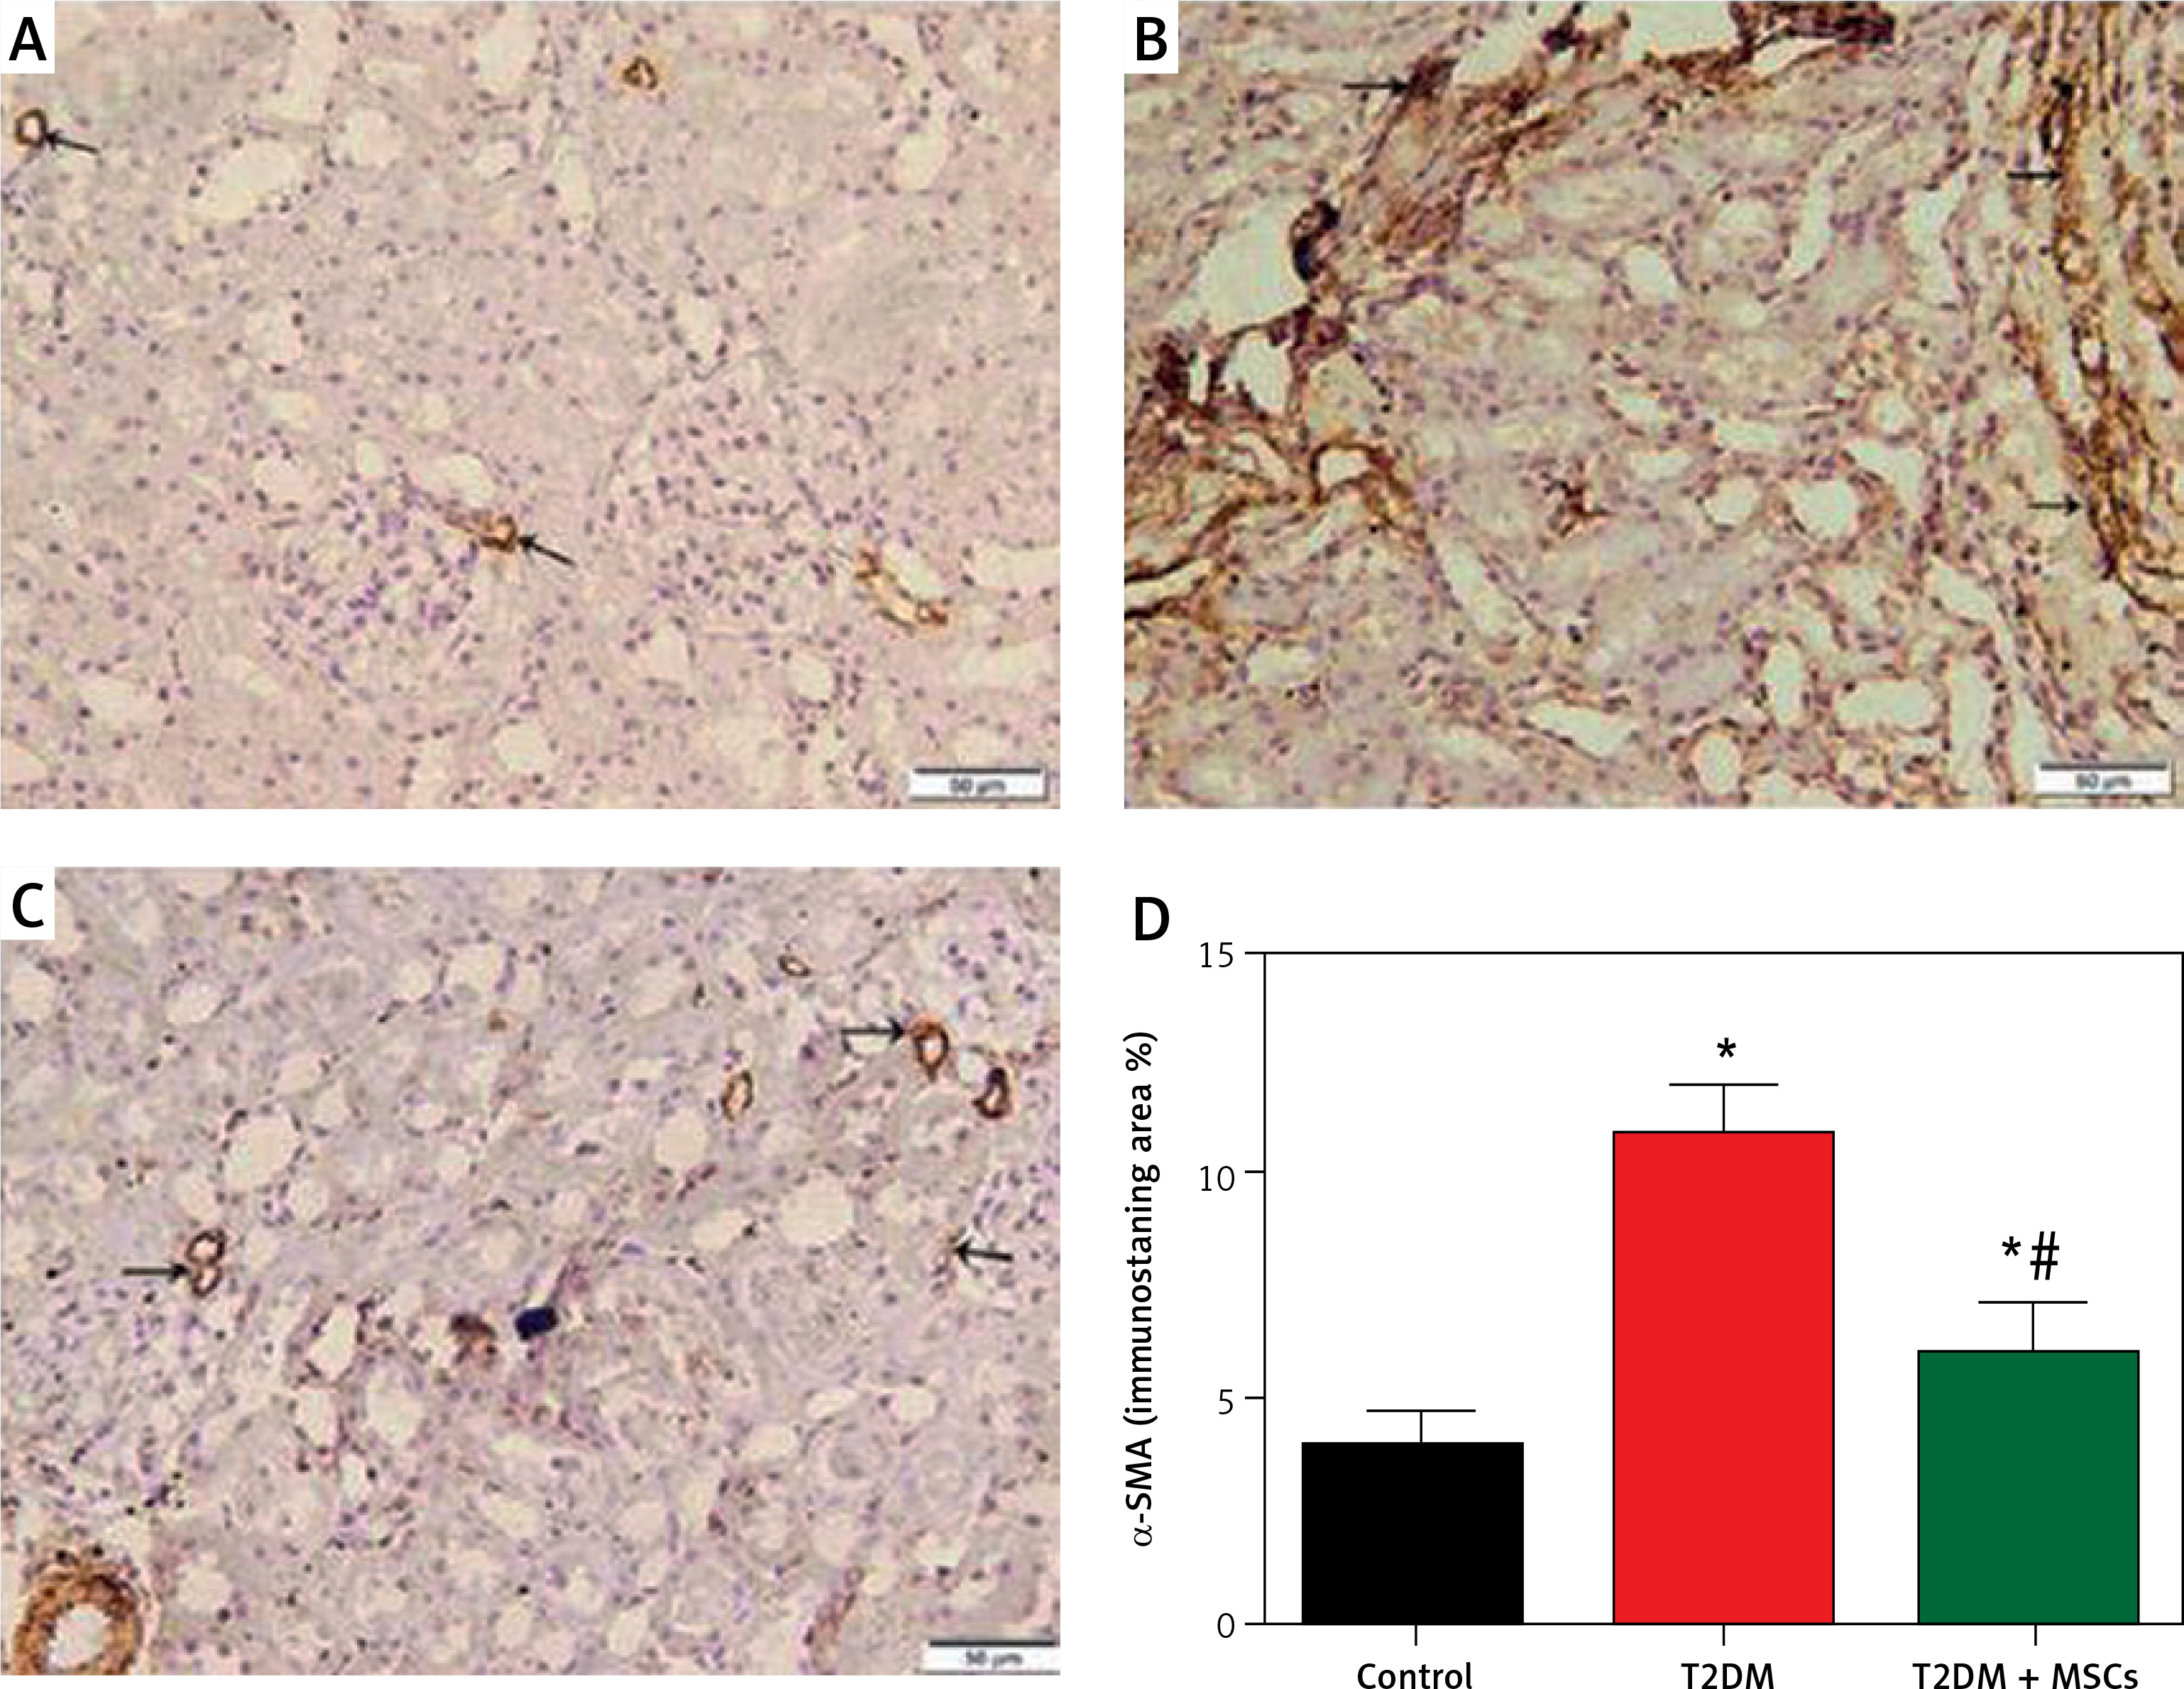
Compared to standard kidney architecture (Figures 5 A, B), diabetes caused distorted renal corpuscles, dilated convoluted tubules, and dilated blood vessels. The tubular epithelial cells show small, darkly stained nuclei and vacuolated cytoplasm (Figures 5 C, D). Masson-stained regions (Figure 6 B) revealed coarse collagen build-up in the renal interstitium among the tubules and around blood vessels. Additionally, α-SMA immunostained sections in the diabetic group showed strong, widespread positive α-SMA immunostaining cells in the wall of the blood vessels and the renal interstitium (Figure 6 B).
MSC treatment initially mitigated diabetic nephropathy (Figures 5 E, F). This is evidenced by the quantification of collagen deposition in the renal interstitium of sections stained with Masson stain (Figure 6 C), which demonstrated effective (p < 0.0001) inhibition of collagen build-up by MSCs to levels comparable to the control group. Also, MSC administration showed minimal positive α-SMA immunostaining in the wall of the blood vessels and in the renal interstitium, which indicates the reduction of interstitial α-SMA positive cells that are engaged in the development of interstitial fibrosis (Figures 7 A–D) [36]. Morphometry showed that MSCs decreased collagen deposition by reducing the Masson trichome staining and the α-SMA immunostaining area %.
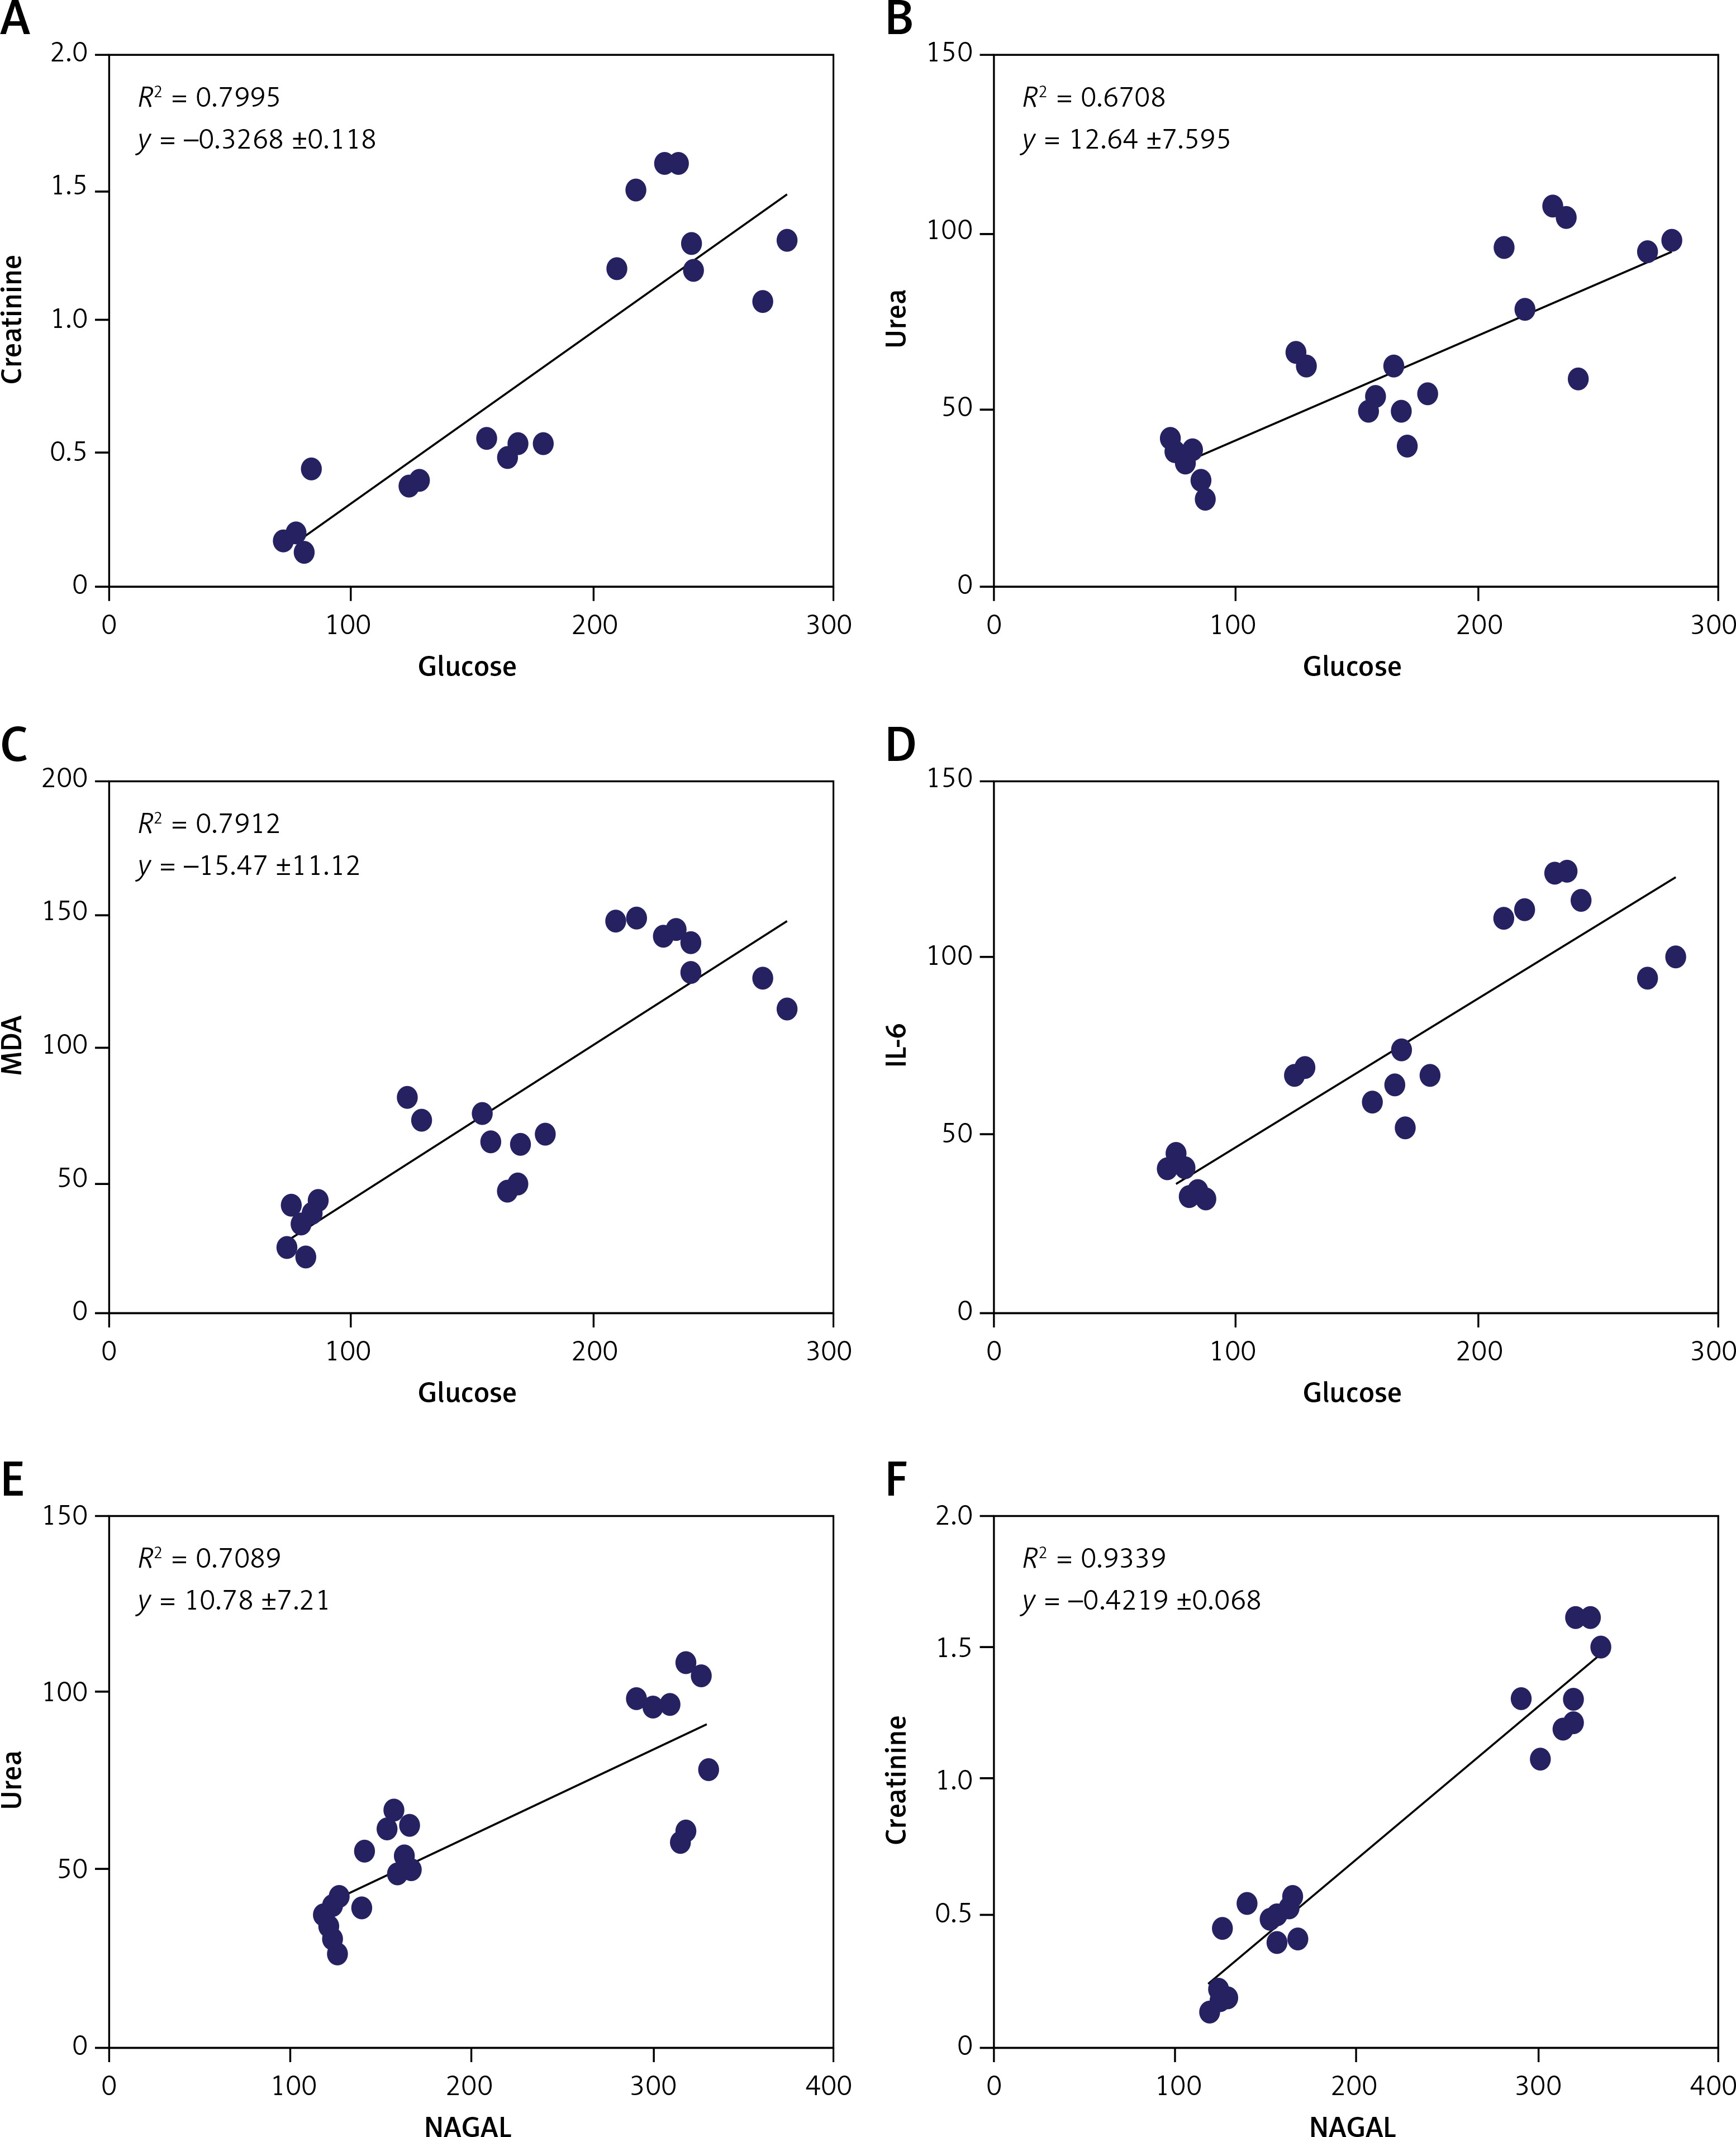
Correlation results
The results showed a positive correlation between increased glycemia versus creatinine, urea, MDA, and IL-6 (A, B, C, and D) and a positive correlation between NAGAL versus urea and creatinine (Figures 8 E and F) (p < 0.0001, n = 24 for all) (Figure 8).
Discussion
The immunomodulatory effects of MSCs were investigated in the current study to combat the progression of diabetic renal injury and fibrosis in an animal model of diabetic nephropathy. Specifically, the study targets critical pathways, including PKC/NF-KB/STAT3, along with α-smooth muscle actin and the circulating kidney injury molecule-1 and NGAL, to assess their involvement in the progression of diabetic kidney damage, as shown in Figure 9. The progression toward organ failure is characterized by fibrosis and structural deterioration in solid organs, notably in the kidney. In nearly all cases of progressive CKDs, the primary features consistently linked with functional decline in the glomerular filtration rate include the extent of glomerulosclerosis, tubulointerstitial fibrosis, vascular damage, and proteinuria [37]. Hence, in a rat model of T2DM-induced nephropathy, we assessed renal impairment, renal damage, and fibrosis mediated by the renal PKC/STAT3 axis without and with MSCs treatment in the current study. MSCs have been shown to have pleiotropic effects, which include antioxidative capabilities.
Furthermore, in this animal model, we investigated the relationship between the pathophysiology of T2DM-induced nephropathy, renal impairment, and glycemia. We triggered renal damage in rats by T2DM. Twelve weeks after the development of diabetes in rats, we observed that diabetes could trigger renal PKC/STAT3 axis-mediated renal dysfunction, kidney damage, and fibrosis. Our results suggest that MSCs can suppress the PKC/STAT3 axis. Also, the results of our study indicate a significant link between glycemia, renal dysfunction, and kidney injury biomarkers such as NAGAL, urea, and creatinine. This study highlights the crucial connection between renal dysfunction and the onset of kidney injury in diabetes, emphasizing the renal protective effects of MSCs.
Diabetic nephropathy is one of the prevalent comorbidities accompanying T2DM and a primary contributor to end-stage renal disease [38, 39]. The persistent hyperglycemia associated with diabetes [40] is implicated in glomerular dysfunction by activating PKC [13]. The role of PKC in eliciting structural alterations secondary to chronic hyperglycemia has been extensively investigated. In light of current knowledge, we focus on elucidating how hyperglycemia influences PKC activation. Notably, PKC can be triggered by heightened production of oxidant factors, with increased oxidative stress often linked to mitochondrial dysfunction induced by elevated glucose levels [41].
Numerous aberrant vascular and cellular processes and dysregulations, including endothelial dysfunction, increased permeability of blood vessels, aberrant cell growth, apoptosis, increased thickness of basement membrane, and extracellular matrix expansion, have been observed in diabetic nephropathy [13]. Our study aimed to evaluate the levels of glycemia, dyslipidemia, inflammation, and oxidative stress biomarkers in rats with experimentally induced diabetes with or without MSC treatment. Our results demonstrated that MSC administration attenuated kidney fibrosis in diabetic rats, as evidenced by decreased collagen deposition observed in Masson trichrome staining and α-SMA immunostaining. The current results also highlighted the reno-protective effects of BM-MSCs as significant decreases in urea, creatinine, KIM-1, and NGAL levels were observed.
The current findings underscore the renal protective effects of BM-MSCs, evident through a notable reduction in urea, creatinine, KIM-1, and NGAL levels. KIM-1, a type I transmembrane glycoprotein primarily expressed on the proximal epithelial cells of renal tubules, remains undetectable under normal conditions [42]. However, following renal injury, serum levels exhibit a significant increase. KIM-1 serves as a marker for differentiation and proliferation [43]. Our results show a positive correlation between KIM-1 levels and glycemia.
NGAL, on the other hand, serves as a structural tubular marker and exhibits extensive elevation in serum or urine shortly after ischemia-reperfusion injury. Several preclinical and clinical cohort studies have highlighted a positive correlation between NGAL and the severity of albuminuria or renal impairment [44]. NGAL emerges as a promising marker for acute and chronic kidney diseases, with reference standards suggesting its utility in diagnosing diabetic kidney diseases [45]. Results from our study show a significant elevation in NGAL levels in the T2DM group compared to the control group, alongside a positive correlation between NGAL levels and urea and creatinine, indicating the occurrence of kidney injury in diabetic rats.
Mesenchymal stem cells have shown their therapeutic potential in various animal and clinical trials. They present diverse modalities for addressing T2DM. With their low immunogenicity, self-renewal capacity, and ability to differentiate, MSCs exhibit specific antidiabetic effects [46]. Apart from their secretion of cytokines, growth factors, and exosomes, MSCs significantly impact insulin sensitivity and β-cell dysfunction [47]. Our findings show that MSCs could reduce blood glucose levels with a single-dose infusion.
The pathogenesis of obesity-related insulin resistance, which underlies T2DM, involves chronic low-grade inflammation and immune system activation [48]. These alterations are marked by chronic overexpression of pro-inflammatory cytokines [49] such as TNF-α, IL-6, and interleukin-1β, contributing to metabolic syndromes and T2DM development [47].
Additionally, prolonged hyperglycemia and insulin resistance are critical factors in diabetic vascular complications. Results from this study show that hyperglycemia triggers oxidative stress, activating PKC and initiating a pro-inflammatory response via NF-κB activation [16]. Consecutively, increased oxidative stress initiates a pro-inflammatory response via activation of NF-κβ [50]. In hyperglycemic conditions, NF-κB activity is significantly enhanced, releasing cytokines and vascular adhesion molecules [51]. Previous research indicated an enhanced renal NF-κB system in CKD, which is also involved in the pathogenesis of DKD. Inhibition of NF-κB may attenuate kidney injury and inflammation in various experimental models [52]. Hyperglycemia-induced NF-κB-mediated kidney inflammation through activating the PI3K/AKT-ERK signaling pathway in glomerular mesangial cells has been observed. Interruption of these vicious cycles may prevent DKD development in diabetics [53].
Mesenchymal stem cells are known for their antifibrotic effects and ability to reduce scarring and fibrosis, achieved through upregulation of antiproliferation-related genes rather than direct modulation of the ECM produced by fibroblasts [54]. The pharmacologic induction of DKD with STZ combined with a high-fat diet is a standard rodent model used to study potential MSC therapy [38]. Progressive tubulointerstitial fibrosis is a recognizable feature of nearly all forms of CKD and represents the final common pathway [39]. MSCs and their conditioned medium have shown promise in attenuating renal fibrosis in various models [55].
Here, we demonstrated that MSC administration inhibits NF-κB production in the diabetic group which is consistent with previous research indicating that MSCs can attenuate nephropathy by inhibiting oxidative stress and alleviating inflammation via NF-κB inhibition [56]. In vitro, cultivating activated human neutrophils in MSC-created media reduced IL-6 and macrophage inflammatory protein 2 release [57]. This agrees with our results, which indicated that the administration of stem cells to diabetic rats decreased TNF-α and IL-6. Furthermore, we observed that MSC administration improved diabetic status, decreased glucose levels and dysregulated lipid profiles, and provided renal protection, evidenced by reductions in serum urea, creatinine, and renal fibrosis. Molecular detection revealed reduced renal fibrosis-related indicators and α-SMA expression in the MSC-treated group. Moreover, MSC transplantation in diabetic rats significantly reduced STAT3 renal expression levels, suggesting a potential STAT3-dependent mechanism for reducing renal fibrosis. This agrees with the previously reported role of STAT3 in mediating the profibrotic signaling pathway [58].
There are certain limitations to this study, even with our innovative findings. Future studies will successfully identify more pathways regulating inflammatory biomarkers in different regions of the kidneys. Examining this effect on kidney function and all other observed markers over an extended period may be more illuminating. Moreover, this study merely showed that MSCs may have a preventive impact against heart injury. This study did not assess MSCs’ capacity to shield the heart, liver, lungs, or blood vessels from the adverse effects of diabetes; however, we will investigate this issue in future research.
In conclusion, results from our study delineated the exacerbation of oxidative stress and inflammatory mediators concomitant with elevated kidney injury markers alongside the upregulation of renal PKC/STAT3 expression and NF-κB-mediated renal fibrosis in an experimental rat model of diabetic nephropathy. MSCs, recognized for their multifaceted therapeutic potential, exhibited profound modulatory effects transcending their established antidiabetic properties. Our results suggest that MSCs abrogate several deleterious pathways pivotal in the progression of renal dysfunction, encouraging further research of their therapeutic utility in diabetic nephropathy management.
Study limitations: However, although we made some novel discoveries, our study does have limitations. First, when the MSCs have been cultured, the soluble mediators produced in the supernatant, including IL-4, IL-12, and TGF-β, should be quantified and then injected into the animals with diabetes. In the future, research should be conducted to examine this topic to determine whether or not renal injury and fibrosis may be successfully minimized and to find additional pathways that regulate inflammatory and fibrotic indicators in various kidney regions. A more valuable approach would be to investigate this effect on kidney function and all other observable markers over a longer length of time. The findings of this study only demonstrated that MSCs may have a preventative effect against kidney injury. Since this study did not investigate whether MSCs can protect the heart, liver, lungs, or blood vessels from the negative consequences of diabetes, additional research will be required.
Furthermore, it is necessary to measure other dependable oxidative stress markers, such as GSH, in both the tissues and the serum. In addition, the diabetes status of rats should be monitored at intervals other than 1 week. This would clearly illustrate the development of a diabetic model and eliminate the concern about euglycemia on the seventh day of STZ treatment (45 mg/kg). Along with renal damage markers, urine albumin excretion should be examined.