Introduction
Crohn’s disease (CD) and ulcerative colitis (UC) are inflammatory disorders of the gastrointestinal tract known as inflammatory bowel disease (IBD). In UC the inflammation involves the distal intestine and ileum, and in CD it can affect the whole region of the digestive tract. The development of IBD with advanced symptoms frequently begins at the age of 20–30, and due to the chronic nature of the disorder, patients require long-term treatment, usually for their whole life [1, 2]. Synthetic glucocorticosteroids (GCs) are among the most commonly used first-line conventional drugs, dedicated to remission induction in IBD patients with mild and severe exacerbations [3]. The GCs are widely known for their rapid anti-inflammatory and immunomodulatory effect, which is followed by binding the intracellular GC receptor (GR) and potent inhibition of T cell activation and cytokine secretion. Effective suppression of inflammatory gene expression occurs through several distinct mechanisms [4, 5]. However, not all patients show a positive response to GC therapy. On average, only every second adult patient with IBD is sensitive to GCs, close to 20% of subjects are GC resistant, and approximately 30–40% of patients become dependent on these drugs [6]. Personalized medicine could be very promising in CD and UC therapy outcome, but except for thiopurine drugs with pharmacogenetics dosing guidelines, we do not have genetic biomarkers for IBD treatment [7, 8].
Although the reason for the differential response is multifactorial, including disease severity and complications, as well as environmental factors, it can be expected that the genetic component plays the most crucial role, which is estimated at up to 95% [9, 10]. To date, most pharmacogenetic research on GCs has indicated the NR3C1 gene coding for the GCs receptor (GR) protein and the ABCB1 gene responsible for synthesis of the multidrug resistance protein 1 – a membrane GC efflux transporter whose overexpression results in decreased cytoplasmic GC concentration [11, 12]. Fewer GC response studies also concern the participation of the FKBP5, TNF, and NLRP1 genes coding for co-chaperone 51 kDa FK506-binding protein (FKBP-51), tumor necrosis factor (TNF) and NACHT, LRR and PYD domain-containing protein 1, respectively [13–16]. However, more molecules are engaged in GCs’ mechanism of action, whose polymorphism could relate to inter-individual differences observed in drug efficacy and side effects. These include: 1) genes coding for a GR cellular protein complex consisting of chaperone heat shock protein HSP 90-α and HSP 70 kDa, co-chaperones, including stress-induced-phosphoprotein 1 (STI1) and the immunophilin FKBP-51, which bind, stabilize and organize hormone-free GR in the cytosol; 2) factors involved in the hormonal control of target gene transcription in the nucleus, i.e., transcription factor AP-1, nuclear factor NF-κB p105 subunit, and of histone acetylation, as well as chromatin remodeling, 3) principal effectors of GCs, e.g. cytokines and their regulators: tumor necrosis factor (TNF), interleukin-1β (IL-1β), interleukin-2 (IL-2), interleukin-8 (IL-8) [4, 6, 17]. Polymorphisms in genes involved in the nuclear transport factors (importin IPO13) or in the metabolism of these hormones, i.e. cytochromes P450 (CYP3A4, CYP3A5), have also been suggested as other possible candidates of GC response modulators [11]. On the one hand, science emphasizes the role of genetics in predicting GCs’ clinical reactions and on the other hand, practice indicates the need of personalized medicine for improving the GC efficacy and safety rates [9, 13].
In this study, we aimed to determine the genetic predictors of GCs’ clinical response within a selected group of 21 genes coding for GR and their complex proteins, transcription factors, GC target genes, GC biotransformation enzymes and GC transporters in a group of 139 diagnosed and clinically characterized Polish IBD patients with a confirmed glucocorticoid response. The goal of these investigations is to better understand diverse patient reactions to GCs and risk factors. Our findings, which identify potential new variants associated with GC reactions, provide the basis for further research, including therapy in different diseases, various populations, and functional studies. In this work, we focused on the relationship between altered GC response and functional variants of the following genes: NR3C1, NLRP1, IPO13, FKBP5, HSPA4, ABCB1, STIP1, HSP90AA1, IL-1A, IL-1B, IL-2, IL-4, CXCL8, IL-10, NFKBIA, JUN, MIF, TNF, MAPK14, CYP3A4, and CYP3A5. A novel method, based on next-generation sequencing (NGS) of amplicon libraries, was developed for the purpose of analysis of candidate genes in the current study.
Material and methods
Patients and samples
One hundred and thirty-nine Polish patients with IBD hospitalized in the Department of Gastroenterology, Dietetics and Internal Medicine, Poznan University of Medical Sciences (Poland) were enrolled in this study between May 2013 and February 2018. This group included 77 (55.4%) individuals with Crohn’s disease (CD) and 62 (44.6%) individuals with ulcerative colitis (UC). All of them were of Caucasian ancestry. The characteristics of the patients are shown in Table I [18]. In addition to the response to GC treatment defined in all patients, in over half of the study group (51.1%) side effects were observed, including weakening, osteoporosis/osteopenia, peptic ulcers, stretch marks, acne, difficult wound healing, petechiae, edema, hypertension, thrombosis, infection, headache, glucose metabolism disorder, cataract, glaucoma, mental disorders, and increased weight and appetite.
Table I
Clinical characteristics of patients included in the study
| Parameter | Total patients (n = 139) | GC-sensitive (n = 77)# | GC-dependent (n = 38)# | GC-resistant (n = 24)# |
|---|---|---|---|---|
| Age at study, mean ± SD | 36.07 ±14.08 | 38.2 ±15.63 | 36.5 ±15.61 | 33.5 ±10.29 |
| Age at diagnosis, mean ± SD | 31.3 ±14.31 | 32.5 ±14.94 | 30.5 ±14.02 | 30.5 ±14.02 |
| Sex, n (%): | ||||
| Female | 58 (41.7) | 31 (40.3) | 17 (44.7) | 10 (41.7) |
| Male | 81 (58.3) | 46 (59.7) | 21 (55.3) | 14 (58.3) |
| Diagnosis, n (%): | ||||
| CD | 77 (55.4) | 40 (52.0) | 26 (68.4) | 11 (45.8) |
| UC | 62 (44.6) | 37 (48.0) | 12 (31.6) | 13 (54.2) |
| Disease severity, n (%): | ||||
| Mild | 8 (5.8) | 4 (5.2) | 1 (2.6) | 3 (12.5) |
| Moderate | 72 (51.8) | 42 (54.5) | 25 (65.8) | 5 (20.8) |
| Severe | 59 (42.4) | 31 (40.3) | 12 (31.6) | 16 (66.7) |
| Intestinal location*, n (%): | ||||
| L1, ileal | 24 (17.3) | 13 (16.9) | 8 (21.1) | 3 (12.5) |
| L2, colonic | 9 (6.5) | 4 (5.2) | 5 (13.2) | 0 (0.0) |
| L3, ileocolonic | 44 (31.7) | 24 (31.2) | 13 (34.2) | 7 (29.2) |
| E1, proctitis | 5 (3.6) | 4 (5.2) | 1 (2.6) | 0 (0.0) |
| E2, left-side | 10 (7.1) | 8 (10.4) | 2 (5.2) | 0 (0.0) |
| E3, pancolitis | 47 (33.8) | 24 (31.2) | 9 (23.7) | 14 (58.3) |
| Side effects occurrence of GCs, n (%) | 71 (51.1) | 31 (40.3) | 25 (65.8) | 15 (62.5) |
# According to response classification as detailed in ‘Material and Methods, Patients and samples’ description.
* Disease location was determined according to the Montreal classification [18]. GC – glucocorticoid, SD – standard deviation, CD – Crohn’s disease, UC – ulcerative colitis, n – number.
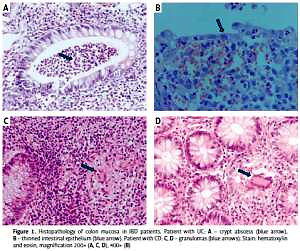
The inclusion criteria were as follows: 1) age over 18 years; 2) diagnosis of IBD based on clinical symptoms, endoscopy with histopathological confirmation (Figure 1), radiological images, and laboratory tests (including complete blood count with smear, hematocrit, erythrocyte sedimentation rate, C-reactive protein, iron, ferritin); 3) disease duration over 6 months and 4) at least one episode of treatment with GCs. All individuals gave their written consent to genetic testing and evaluation of biochemical parameters in serum and colonoscopy. The study was approved by the Bioethical Committee of Poznan University of Medical Sciences under Resolution No. 436/13.
Figure 1
Histopathology of colon mucosa in IBD patients. Patient with UC: A – crypt abscess (blue arrow), B – thinned intestinal epithelium (blue arrow). Patient with CD: C, D – granulomas (blue arrows). Stain: hematoxylin and eosin, magnification 200× (A, C, D), 400× (B)
In all patients, the clinical data were obtained with a minimum of 1 year of continuous follow-up evaluation after the start of GC treatment. Some patients were evaluated retrospectively and the rest prospectively. The disease activity was determined according to the Crohn’s Disease Activity Index (CDAI) for patients with CD and according to the Truelove-Witts score for patients with UC. GC therapy consisted mostly of methylprednisolone and hydrocortisone, and in rare cases, budesonide (Table II). The dose of GCs (methylprednisolone and hydrocortisone) was converted to prednisolone using a corticosteroid conversion calculator (https://clincalc.com/corticosteroids/). According to the existing criteria of the European Crohn’s and Colitis Organization (ECCO), the patients were assigned to one of three groups: 1) GC-sensitive, if after the initiation of treatment within a few days they achieved and maintained clinical remission; 2) GC-dependent, if the symptoms of exacerbation recurred after reducing the dose of GCS below 10 mg/24 h prednisolone or within 3 months after GCs were discontinued, 3) GC-resistant, if symptoms of exacerbation persisted despite 4 weeks of GC therapy in doses corresponding to a minimum of 0.75 mg/kg of prednisolone [1, 2]. The GCs were administered as a monotherapy or in combination therapy with 5-aminosalicylic acid preparations.
Table II
GCs – dosages in the study group
| Drug | Dose [mg/24 h] | Number of patients, n (%) | Response, n (%) | Sex, n (%) | IBD diagnosis, n (%) | ||||||
|---|---|---|---|---|---|---|---|---|---|---|---|
| GC-S | GC-D | GC-R | Female | Male | CD | UC | |||||
| Methylprednisolone (oral) | Medium | 12–24 | 127 (91.4) | 45 (32.4) | 31 (22.3) | 11 (7.9) | 3 (2.2) | 21 (15.1) | 24 (17.27) | 20 (14.4) | 25 (18.0) |
| High | > 24 | 82 (59.0) | 36 (25.9) | 26 (18.7) | 2 (1.4) | 28 (20.1) | 54 (38.9) | 35 (25.2) | 47 (33.8) | ||
| Hydrocortisone (intravenous) | Low | ≤ 150 | 103 (74.1) | 4 (2.9) | 4 (2.9) | 0 (0.0) | 0 (0.0) | 3 (2.2) | 1 (0.7) | 1 (0.7) | 3 (2.2) |
| Medium | > 150–250 | 21 (15.1) | 12 (8.6) | 7 (5.0) | 2 (1.4) | 8 (5.8) | 13 (9.4) | 7 (5.0) | 14 (10.1) | ||
| High | > 250 | 78 (56.1) | 38 (27.4) | 22 (15.8) | 18 (13.0) | 31 (22.3) | 47 (33.8) | 31 (22.3) | 47 (33.8) | ||
| Budesonide (oral) | Standard | 9 | 18 (13.0) | 18 (13.0) | 9 (6.5) | 3 (2.2) | 6 (4.3) | 12 (8.6) | 6 (4.3) | 18 | 0 (0.0) |
| P-value | – | – | 0.072 | 0.469 | < 0.001 (0.861*) | ||||||
Moreover, in total 12 healthy subjects (6 women and 6 men) without drug treatment ranging in age from 21 to 54 years old were used in this study as controls in all molecular, biochemistry and immunohistochemistry methods. Exclusion criteria in the control group included chronic disease or any organ dysfunction, ongoing infections, excessive alcohol consumption, cigarette smoking and receiving any supplementation influencing hepatic and kidney enzymes.
Long-range (LR)-PCR amplification
Genomic DNA from all subjects was isolated from peripheral blood according to standard procedures using the method with guanidine isothiocyanate and stored at 4°C in a TE buffer containing 1.0 mM EDTA and 10 mM Tris-Cl until use. The amplification of the NR3C1, NLRP1, IPO13, FKBP5, HSPA4, ABCB1, STIP1, HSP90AA1, IL-1A, IL-1B, IL-2, IL-4, CXCL8, IL-10, NFKBIA, JUN, MIF, TNF, MAPK14, CYP3A4, and CYP3A5 genes was carried out using primers containing exons, splice junctions and promoters, as well as 5′ and 3′ flanking sequences (Table III). The LR-PCR conditions that were established are presented in Table IV. Primers were designed as part of this work using the NCBI (National Center for Biotechnology Information) Primer-BLAST tool in reference to the human genomic sequence (GRCh37/hg19). The only exceptions were the primers and amplification conditions for the IL-1B, TNF and ABCB1 genes, which originated from our previous studies [19–21]. Due to the limitation of the LR-PCR method in the length of efficiently amplified DNA fragments, the LR-PCR of short genes such as IL-1A (11.48 kb), IL-1B (7.02 kb) and IL-2 (5.25 kb) was performed in one fragment, but the long genes, e.g. NR3C1 (123.76 kb), FKBP5 (115.35 kb) or ABCB1 (210.00 kb), were divided into several fragments (from 2 to 6 parts, Table III). Therefore, the amplification of the DNA sequence of 21 genes generates 54 amplicons. The numbering of the amplified fragments in Tables III and IV is identical (and also corresponds with the lane numbering in Figure 2).
Table III
Characteristics of amplicons and primer sequences for NGS
Table IV
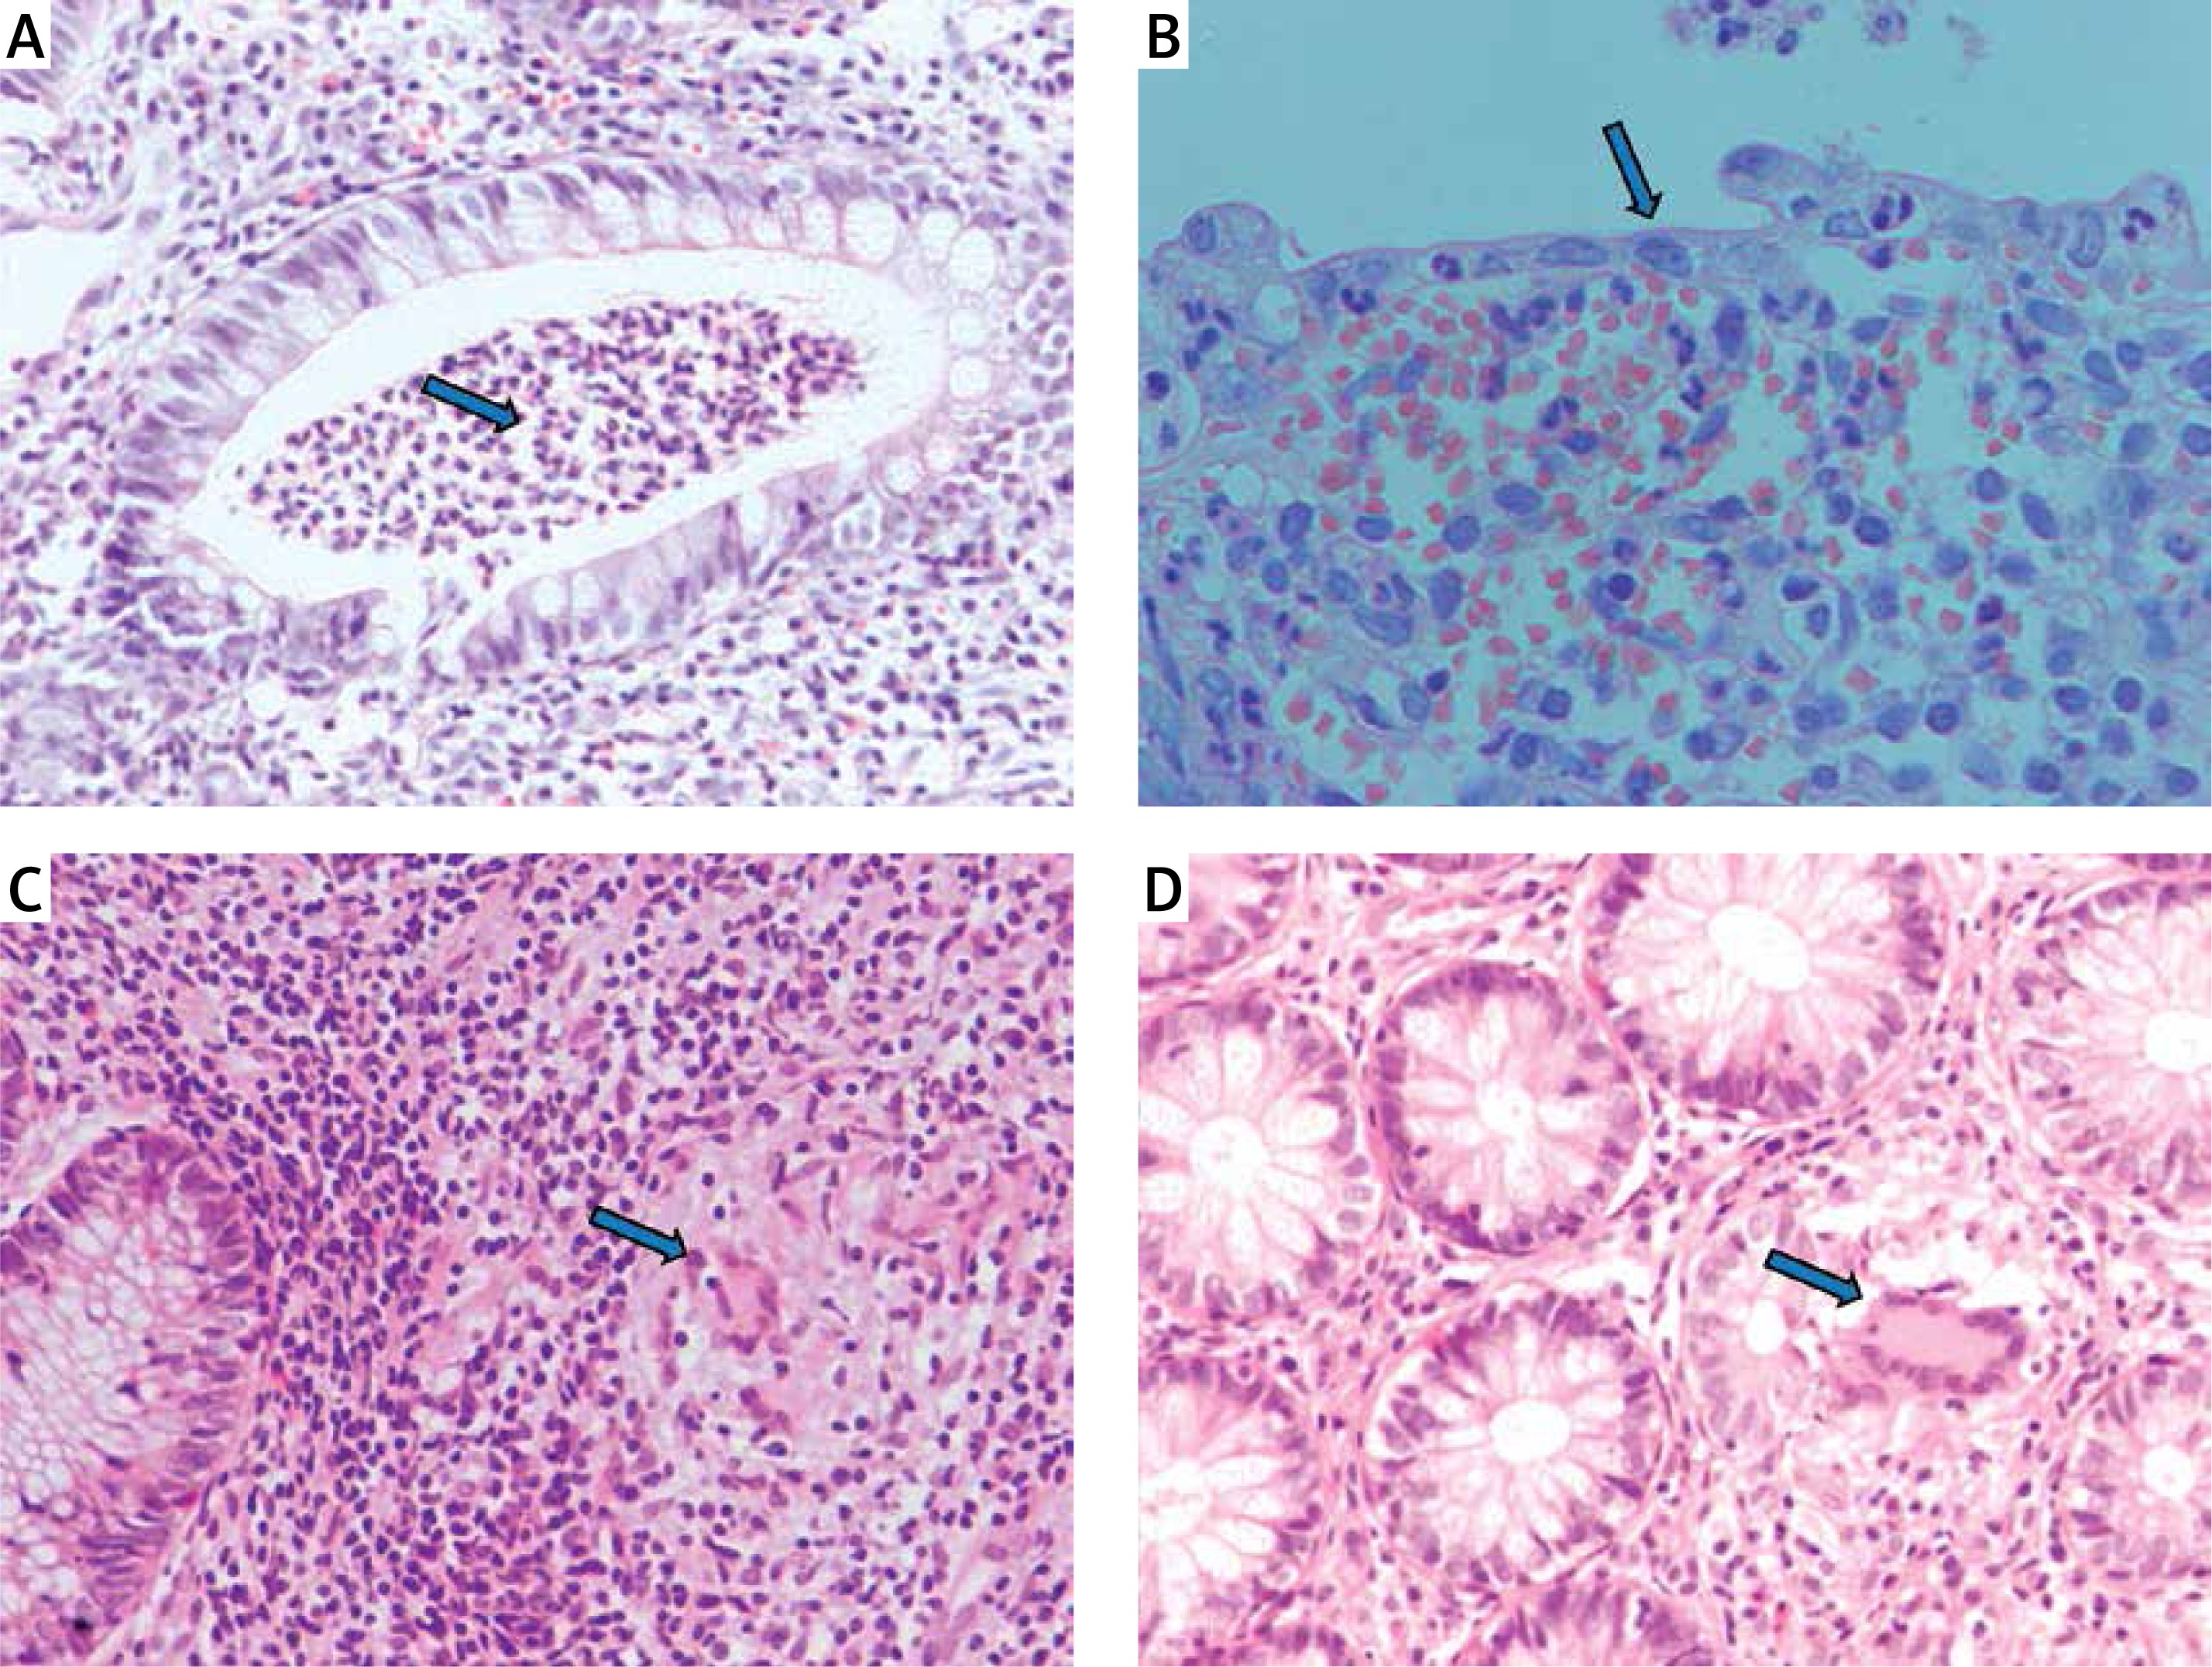
Conditions of LR-PCR reactions
| Amplified fragments* | Reaction mixture | PCR program |
|---|---|---|
| 1, 3–8, 10–13, 16, 17, 20–23, 25–29, 31–41, 45, 47, 48, 52–54 | 38.4 ng template DNA 0.48 μl of 5 μmol/l primers 10 μl of GoTaq Master Mix Water up to 20 μl | 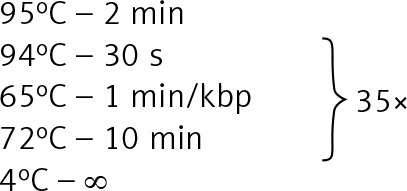 |
| 9, 24, 50-51 | 50 ng template DNA 0.36 μl of a 5 μmol/l primers 15 μl of GoTaq Master Mix Water up to 20 μl | 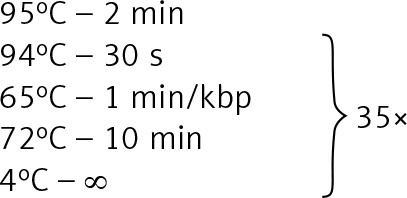 |
| 18, 19 | 20 ng template DNA 0.48 μl of a 5 μmol/l primers, 4 μl of GC Enhancer 10 μl of GoTaq Master Mix Water up to 20 μl | 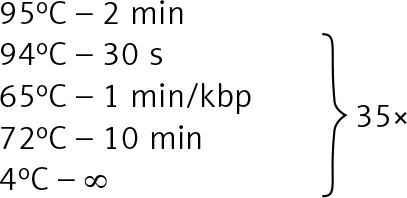 |
| 43, 44 | 38.4 ng template DNA 0.48 μl of 5 μmol/l primers 10 μl of GoTaq Master Mix Water up to 20 μl | 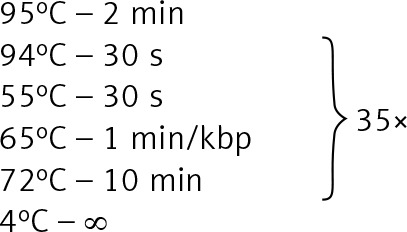 |
| 2, 14, 15, 30, 42, 46, 49 | 20 ng template DNA 0.48 μl of 5 μmol/l primers, 4 μl of GC Enhancer [Jena Bioscience] 10 μl of GoTaq Master, Water up to 20 μl | 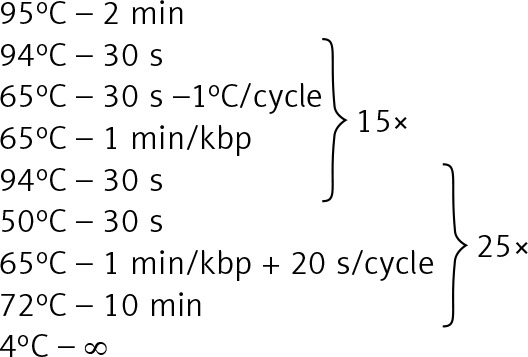 |
Figure 2
Agarose electrophoresis of all 54 LR-PCR products for one DNA sample. Lane: 1–5 NR3C1 (2400 bp, 6301 bp, 5031 bp, 6208 bp, 2261 bp), 6–10 – NLRP1 (5287 bp, 7575 bp, 12504 bp, 5023 bp, 1088 bp), 11–13 – IPO13 (4357 bp, 6294 bp, 4762 bp), 14–19 – FKBP5 (2935 bp, 2534 bp, 6516 bp, 2523 bp, 7518 bp, 12540 bp), 20–23 – HSPA4 (1290 bp, 13489 bp, 7051 bp, 9368 bp), 24–29 – ABCB1 (3518 bp, 15887 bp, 16809 bp, 14483 bp, 17000 bp, 5967 bp), 30–32 – STIP1 (2224 bp, 6456 bp, 5400 bp), 33–35 – HSP90AA1 (1404 bp, 1238 bp, 5157 bp), 36 – IL1A (12577 bp), 37 – IL1B (10196 bp), 38 – IL2 (6505 bp), 39 – IL4 (10003 bp), 40 – CXCL8 (5000 bp), 41 – IL10 (6199 bp), 42 – NFKBI (5016 bp), 43 – JUN (4730 bp), 44 – MIF (2731 bp), 45 – TNF (8831 bp), 46–49 – MAPK14 (1910 bp, 7515 bp, 4900 bp, 13300 bp), 50–51 – CYP3A4 (10626 bp, 15518 bp), 52–54 – CYP3A5 (8829 bp, 7268 bp, 4910 bp), 1 kb – marker ladder 1000 bp. The gel images were obtained by trimming and color adjusting of the full-length gels in the IrfanView 4.44 program. The lanes numbering corresponds with the numbering of the amplified fragments in Tables III and IV
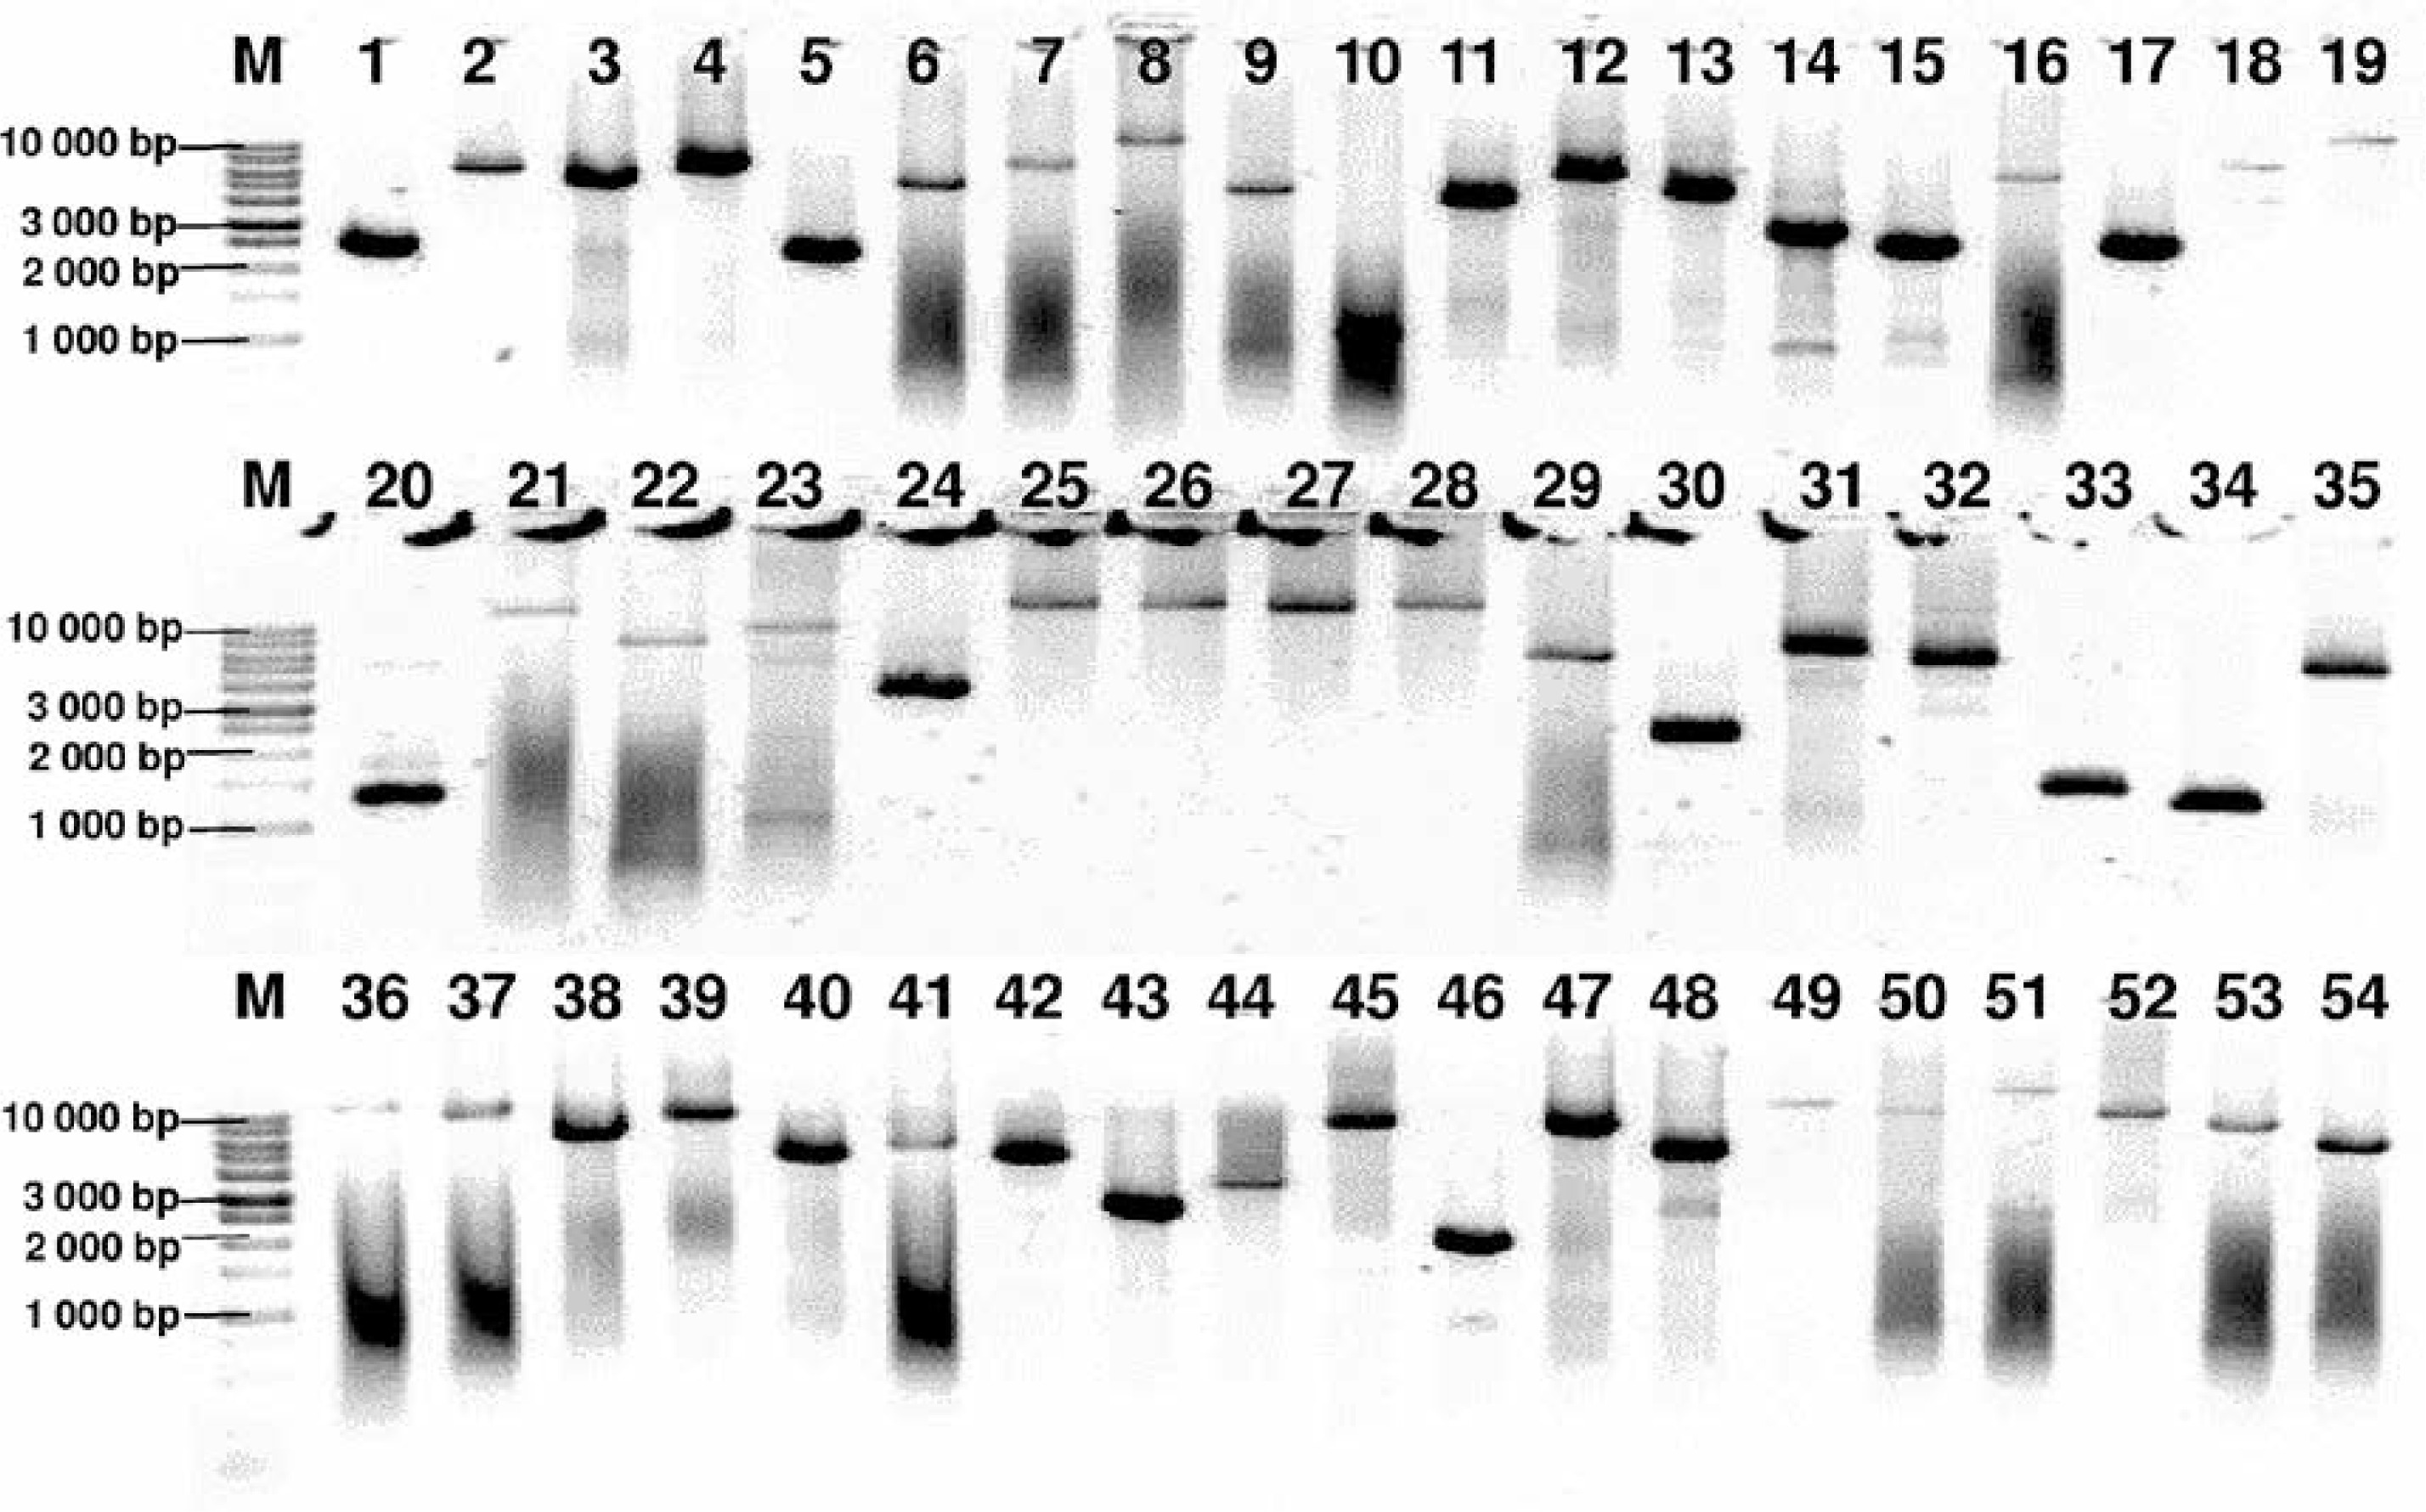
The amplification effect was controlled by electrophoresis in a 0.6% agarose gel (Sigma). To identify the approximate size of amplified fragments, the 1 kb DNA Ladder (Solis Biodyne) was used.
Library preparation, NGS and Sanger sequencing
Fifty-four amplicons of each patient were pooled in equimolar ratios. According to the manufacturer’s protocol, 1 ng of the pooled DNA fragments was subjected to the Nextera XT procedure (Illumina) using the Nextera XT DNA Sample Preparation Kit (Illumina) and Nextera XT Index Kit (96) (Illumina). Finally, we obtained 139 both-side indexed DNA libraries ready for high-throughput sequencing. Normalization of all libraries was carried out with magnetic beads, according to the Nextera XT procedure. Sequencing on an Illumina MiSeq System was performed as paired-end targeted resequencing using MiSeq Reagent Kit v2 (300 cycles) (Illumina). To verify the variants which were detected, Sanger sequencing for random samples was performed on an Applied Biosystems 3500 Genetic Analyzer using the BigDye Terminator v3.1 Cycle Sequencing Kit. The NGS analyses described were performed for the IBD patient group. However, for comparative purposes of the sequencing data, the minor allele frequency for the European population (MAF EU) from the 1000 Genomes Project was also used.
Bioinformatic and statistical analysis
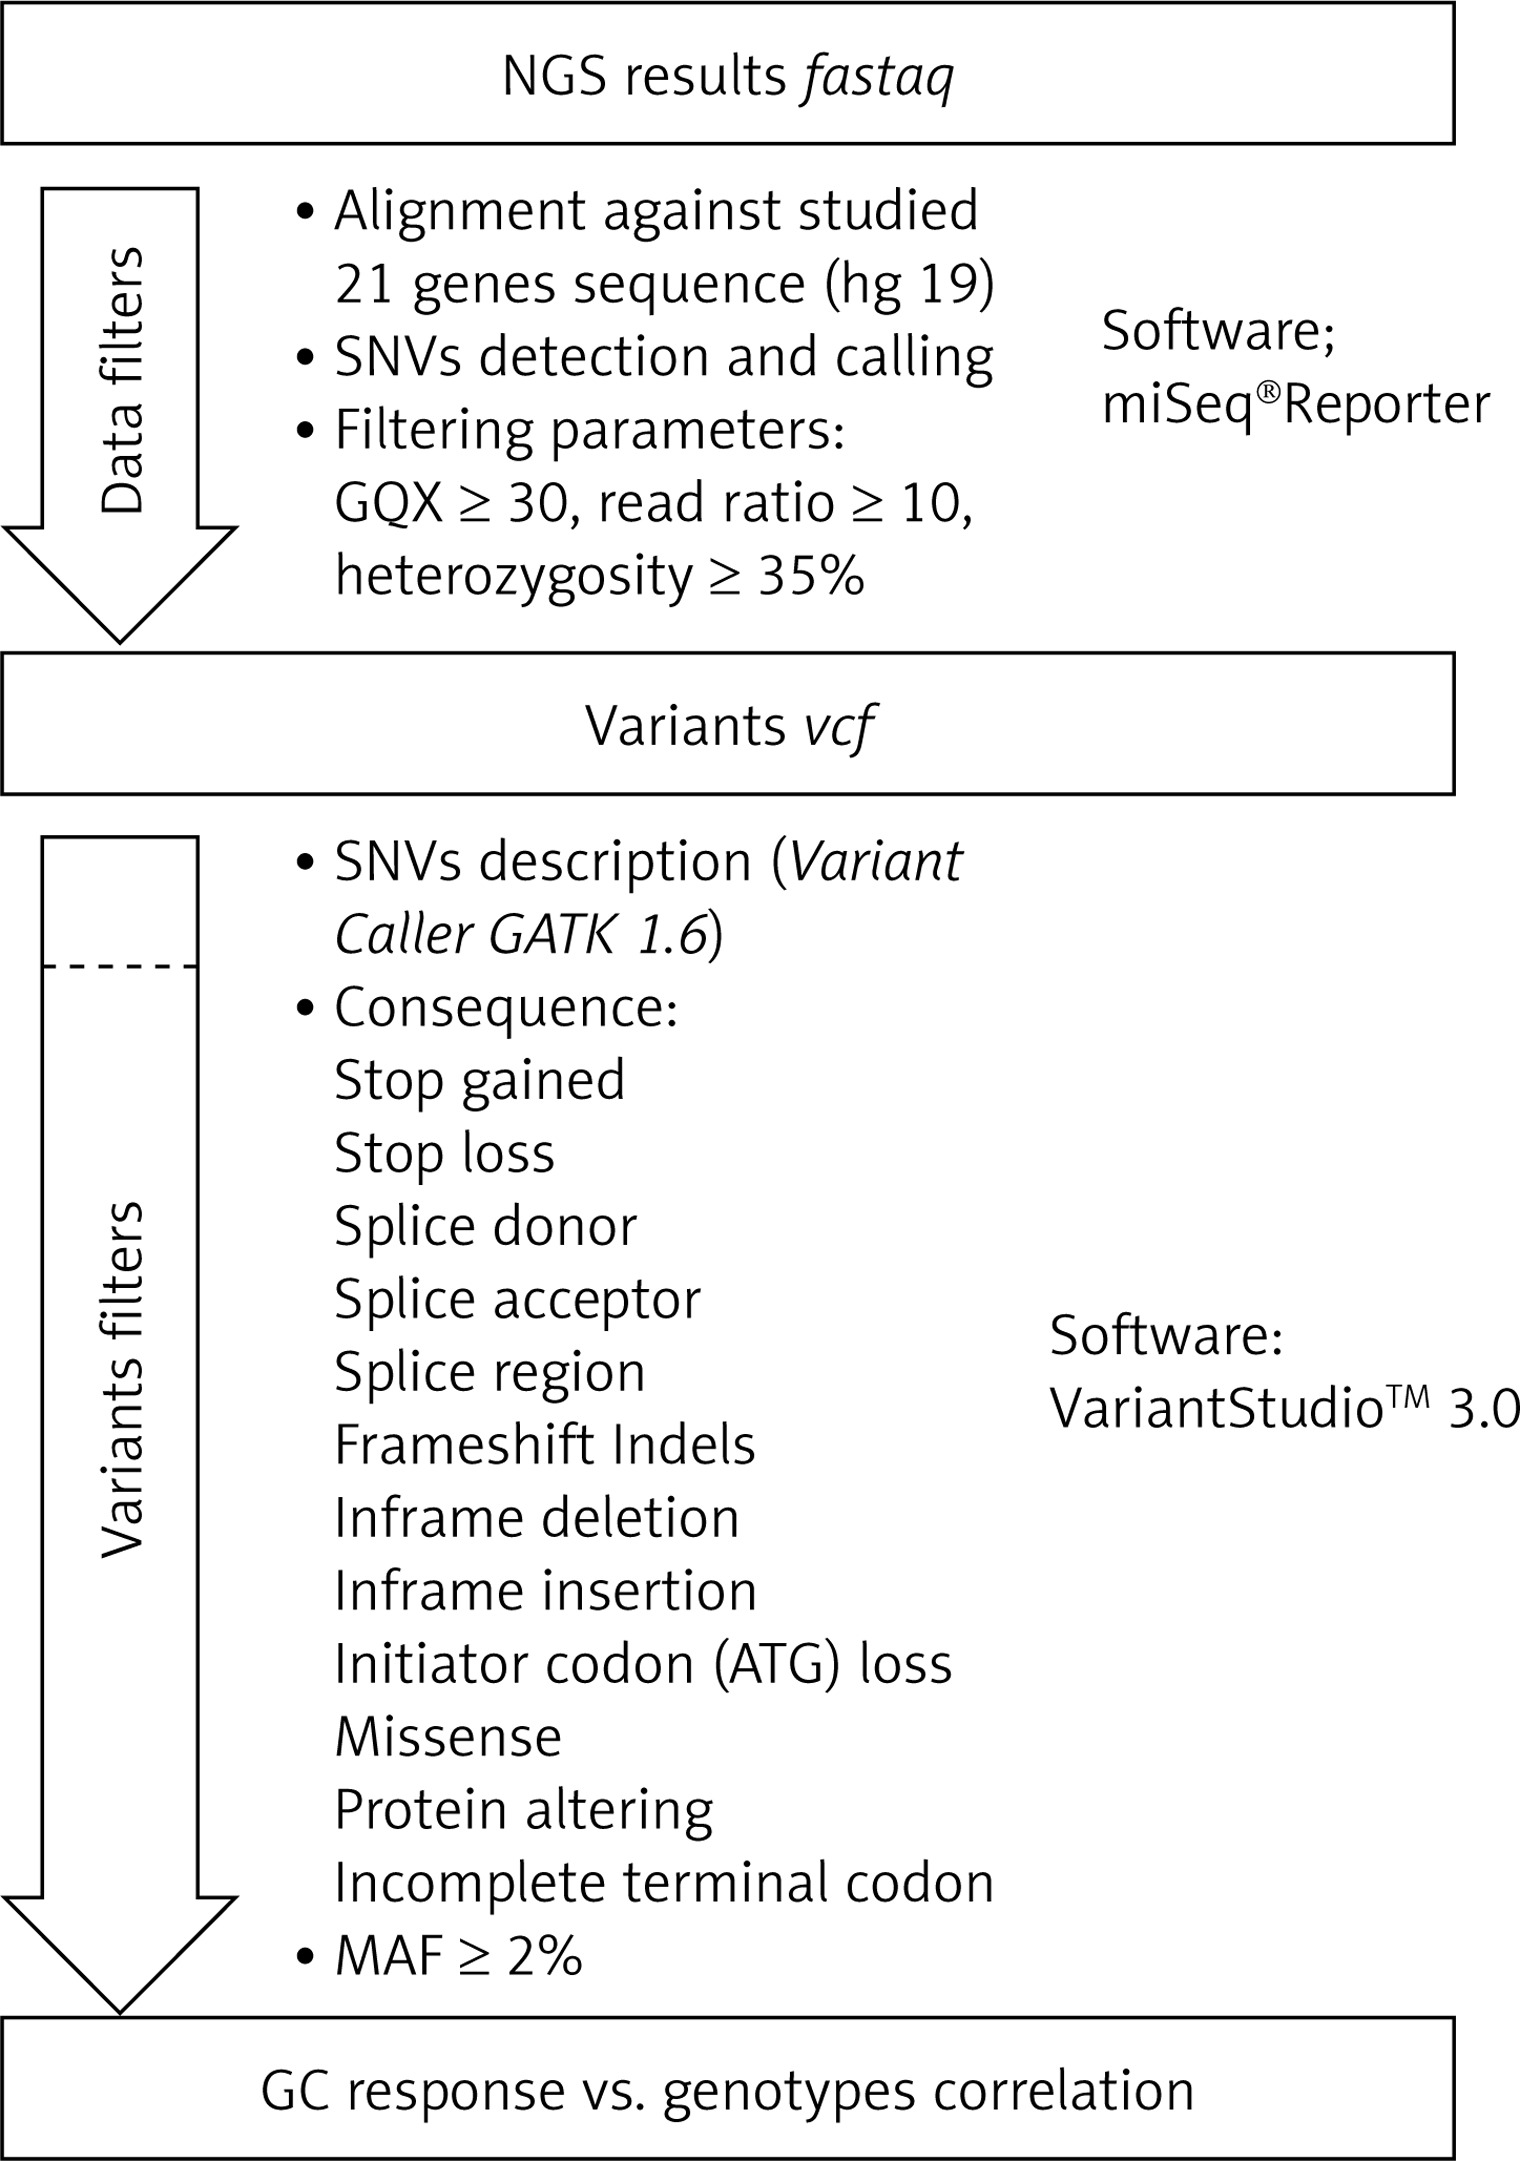
Secondary bioinformatic analysis of NGS reads generated was performed using MiSeq Reporter analysis software (Illumina), and the resulting variants were characterized and filtered using VariantStudio Software v 3.0 (Illumina), according to the pipeline in Figure 3. In the first step, the NGS results concerning the sequences of 21 genes analyzed were aligned to the human reference sequence (version GRCh37/hg19). Next, the SNVs (single nucleotide variants) were detected and named, and we applied filtering parameters (GQX – genotyping quality ≥ 30, read depth ≥ 10 and heterozygous read ratio ≥ 35%) to select high-quality NGS results. The data obtained were filtered according to the potential consequence at the protein level and the frequency of the minor allele ≥ 2%. Thirty-one polymorphic variants were subjected to statistical analysis. We correlated the genetic results with GC response, including the division into three groups – GC-sensitive (S), -dependent (D) and -resistant (R) – for which the abbreviations S, D, and R, respectively, were used. This analysis aimed to compare all three GC-response groups in terms of genotype distribution for each polymorphic variant. Moreover, regarding GC response, the patients were also divided into two groups in two combinations: 1) correct responsive (GC-sensitive) versus poorly responsive subjects (GC-dependent and GC-resistant) abbreviated as S vs. D + R; as well as 2) GC-resistant versus the rest of the patients (GC-sensitive and GC-dependent) abbreviated as S + D vs. R. Those combinations were necessary to determine the genetic factors responsible for GC sensitivity and related to GC resistance. The calculations were carried out for the whole group of 139 patients, and for diagnosis of CD and UC.
Figure 3
The pipeline of NGS results analysis and variant selection
SNVs – single nucleotide variants, GQX – genotyping quality, MAF – minor allele frequency.
The concordance of genotype distribution was verified using the Hardy-Weinberg equilibrium (HWE). All correlation analyses between GC response and genetic variants (Table V), as well as analysis of clinical data in subgroups (Table II), were verified using the Pearson χ2 and Fisher tests with Bonferroni correction.
Table V
Selected variants with potential GC therapy response significance
Statistical significance was set at p ≤ 0.05. Bonferroni correction was applied for the number of study groups, but not for the number of analyzed loci. All calculations were performed using Statistica 12.0 software (Stat Soft, 2016).
Results
Clinical outcome
Our study group included 139 IBD patients, of whom 77 (56%) reacted correctly to GC therapy and were classified as GC-sensitive, 24 (17%) demonstrated resistance to treatment and 38 (27%) were GC-dependent (Table I). The most frequently used GC drug was methylprednisolone in a dose above 24 mg/24 h (Table II). Correlation analysis of the treatment and drug dose with the response and gender did not reveal statistically significant differences (p = 0.072, p = 0.469, respectively). There was a relationship between the treatment method and the diagnosis of CD and UC (p < 0.001). However, if budesonide was omitted, the significance disappeared (p = 0.861, Table II).
LR-PCR and NGS results
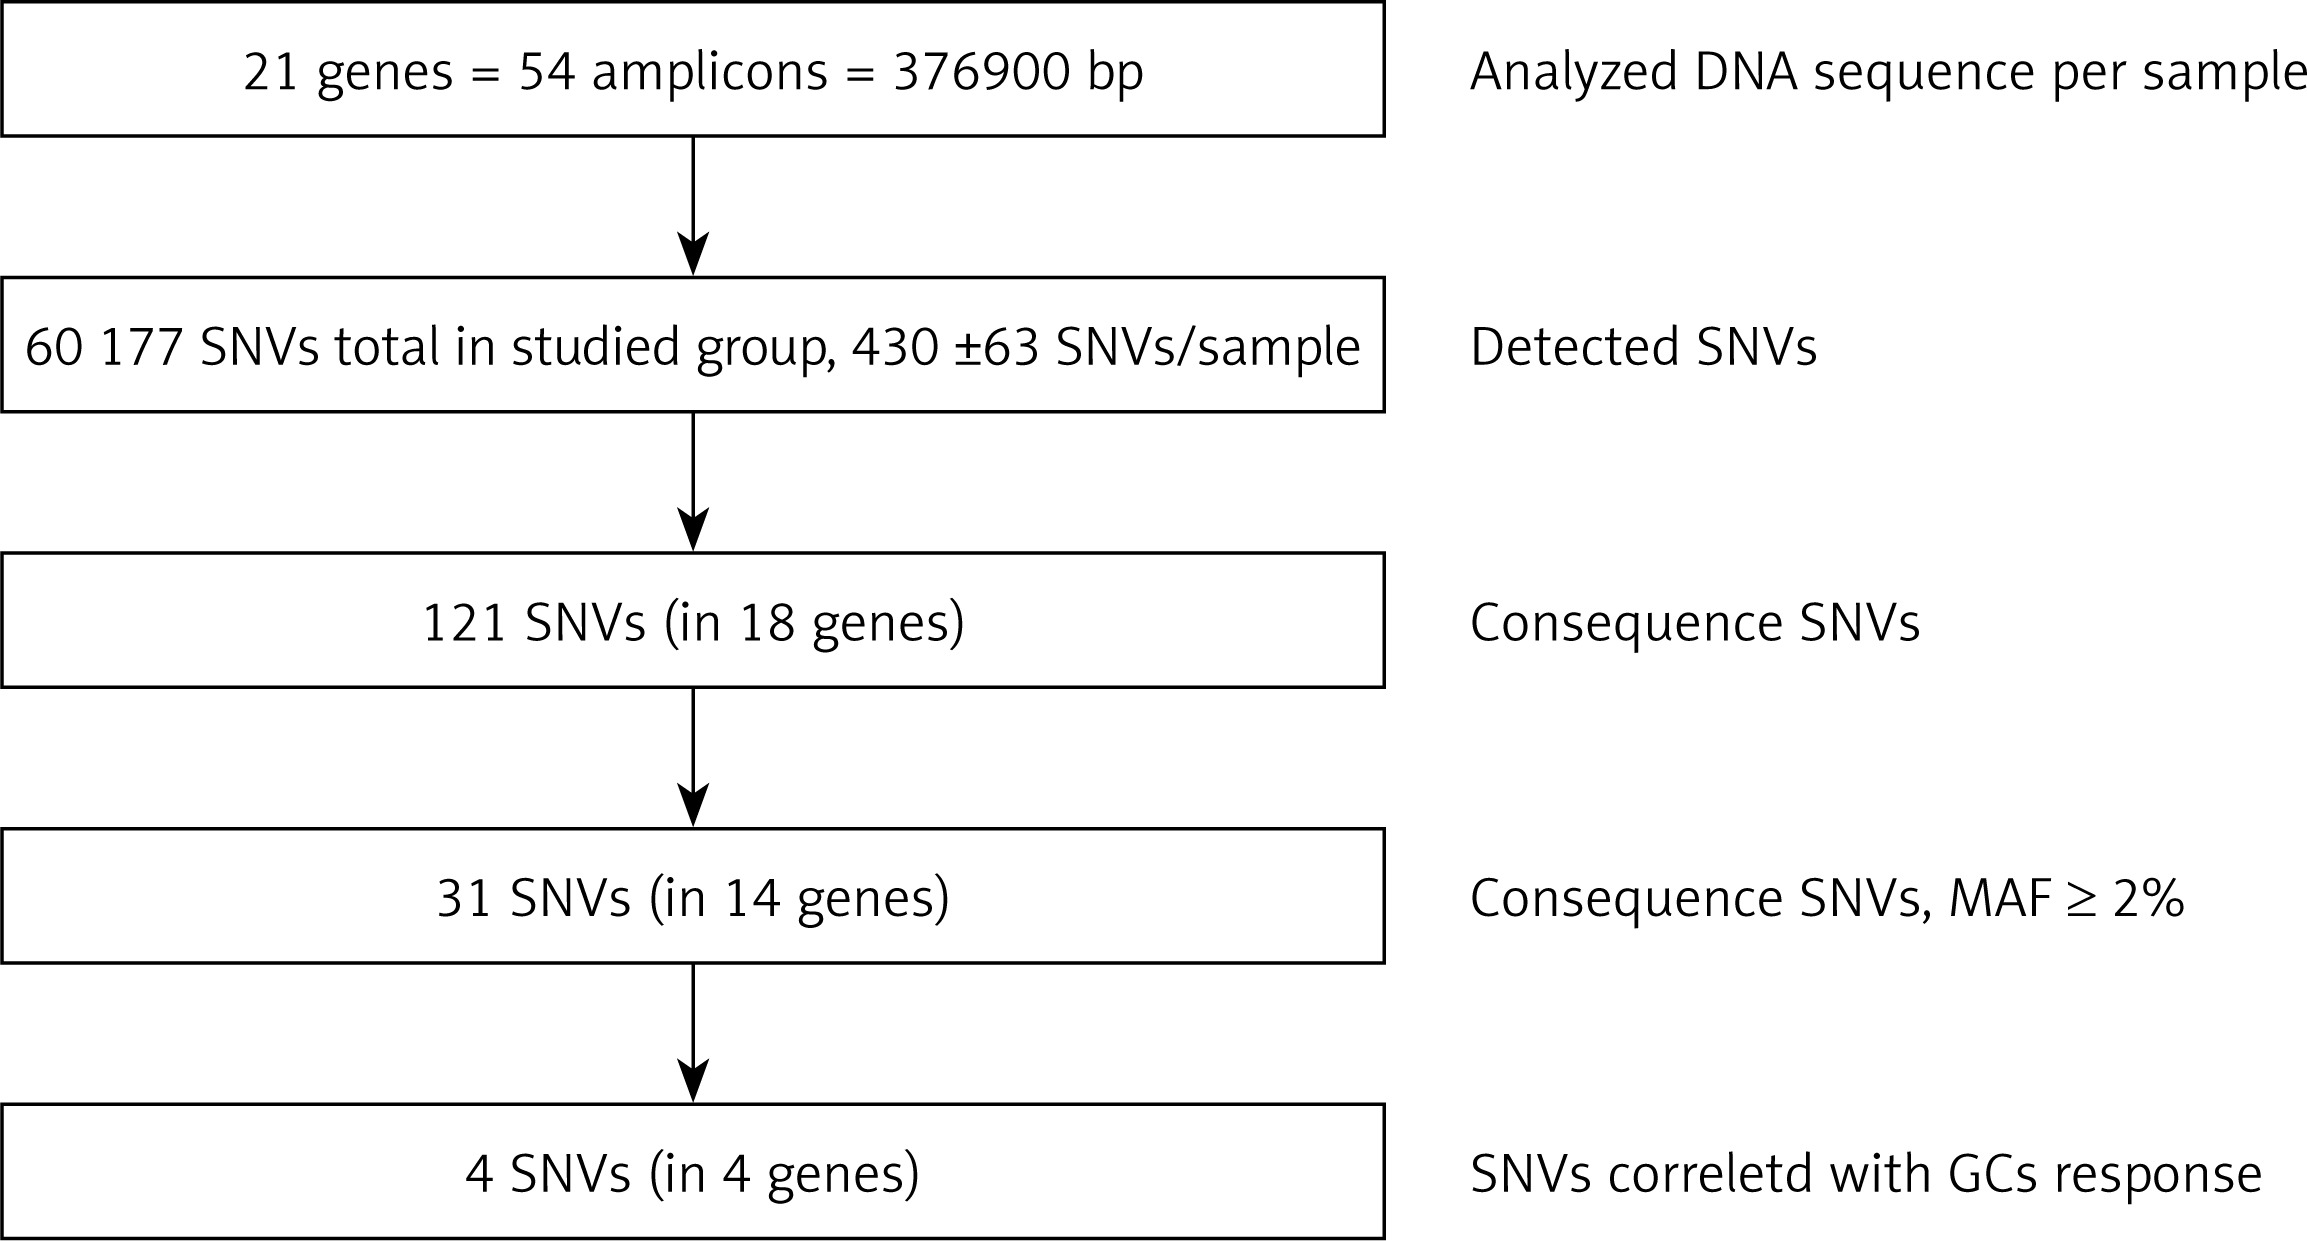
The target region of NR3C1, NLRP1, IPO13, FKBP5, HSPA4, ABCB1, STIP1, HSP90AA1, IL-1A, IL-1B, IL-2, IL-4, CXCL8, IL-10, NFKBIA, JUN, MIF, TNF, MAPK14, CYP3A4, and CYP3A5 genes was amplified for each DNA sample in 54 fragments. The results of LR-PCR for one example DNA sample are presented in Figure 3. The NGS results obtained indicated on average 430 ±63 SNVs per sample. Among 121 different functional DNA variants in the total group, for correlation analysis we selected 31 polymorphic variants in 14 genes (Table V), which occurred at a minor allele frequency (MAF) above 2%. These have consequences for the protein structure and functionality based on VariantStudio 3.0 Software classification (Figures 1 and 4). Variants in the remaining studied 7 genes that were studied (IL-1B, IL-2, IL-10, IL-4, JUN, CYP3A4, IPO13) did not meet these selection criteria and were not qualified for further analysis. Moreover, in the literature described in response to the GCS context, the loci in the NR3C1 (c.1184+646C>G and p.Asn767Asn), ABCB1 (c.2685+49T>C, p.Gly412Gly and p.Ile1145Ile) and TNF (c.-308G>A and c.-238G>A) genes were also included [11]. The highest average number of NGS reads (above 400×) was observed for variants p.Cys13Ser (rs61745470) and p.Met71Leu (rs8005905) of the HSPA4 and HSP90AA genes, respectively. The lowest coverage occurred for the ABCB1 gene changes (22–65×) (Table V). To verify the genotyping results obtained for this gene, we checked all five loci for the whole group of patients using the second method – Sanger sequencing. These data were overlapping. The SNVs were mostly in HWE. The exception concerned changes p.Val1059Met (rs2301582) and p.Met1184Val (rs11651270) in the NLRP1 gene, and p.Ser400Asn (rs2229109) in the ABCB1 gene (p < 0.05, Table V). The allele frequencies identified and presented as MAF generally did not significantly differ from the European data (EU MAF) originating from the 1000 Genomes Project, except for the change p.Glu31Ter (rs188378669) in the CXCL8 gene, in which in contrast to the European population, the minor allele occurred eight times more often in our patient group (Table V).
Correlation data
In the first step, correlation analysis of obtained genotypes with a response to GC was performed in the whole group of 139 IBD patients (jointly all CD and UC cases). Only for the change c.2685+49T>C (rs2032583) in the ABCB1 gene was an association with GC reaction visible (p = 0.046). The presence of a substitution in position c.2685 correlated with the occurrence of resistance to GCs. Subsequently, the correlation analysis for two patient subgroups CD and UC was carried out, which demonstrated a statistically significant relationship in UC between GC response and the occurrence of the variants c.1088G>A (rs56149945) in NR3C1 (p = 0.019), c.241+6A>G (rs2817033) in the FKBP5 gene and c.306-7delT (rs61763106) in the MAPK14 gene (Table V, Figure 5), while in CD, the change c.2685+49T>C (rs2032583) in the ABCB1 gene was relevant.
Figure 5
Distribution of genotypes for significantly correlated variants: A – NR3C1, c.1088A>G, UC patients, B – FKBP5, c.241+6A>G, UC patients, C – MAPK14, c.306-7delT, UC patients, D – ABCB1, c.2685+49T>C, CD patients
ns – non-significant, *relevant genotypes for the GC-response type, p < 0.05, **p < 0.01, ***p < 0.001.
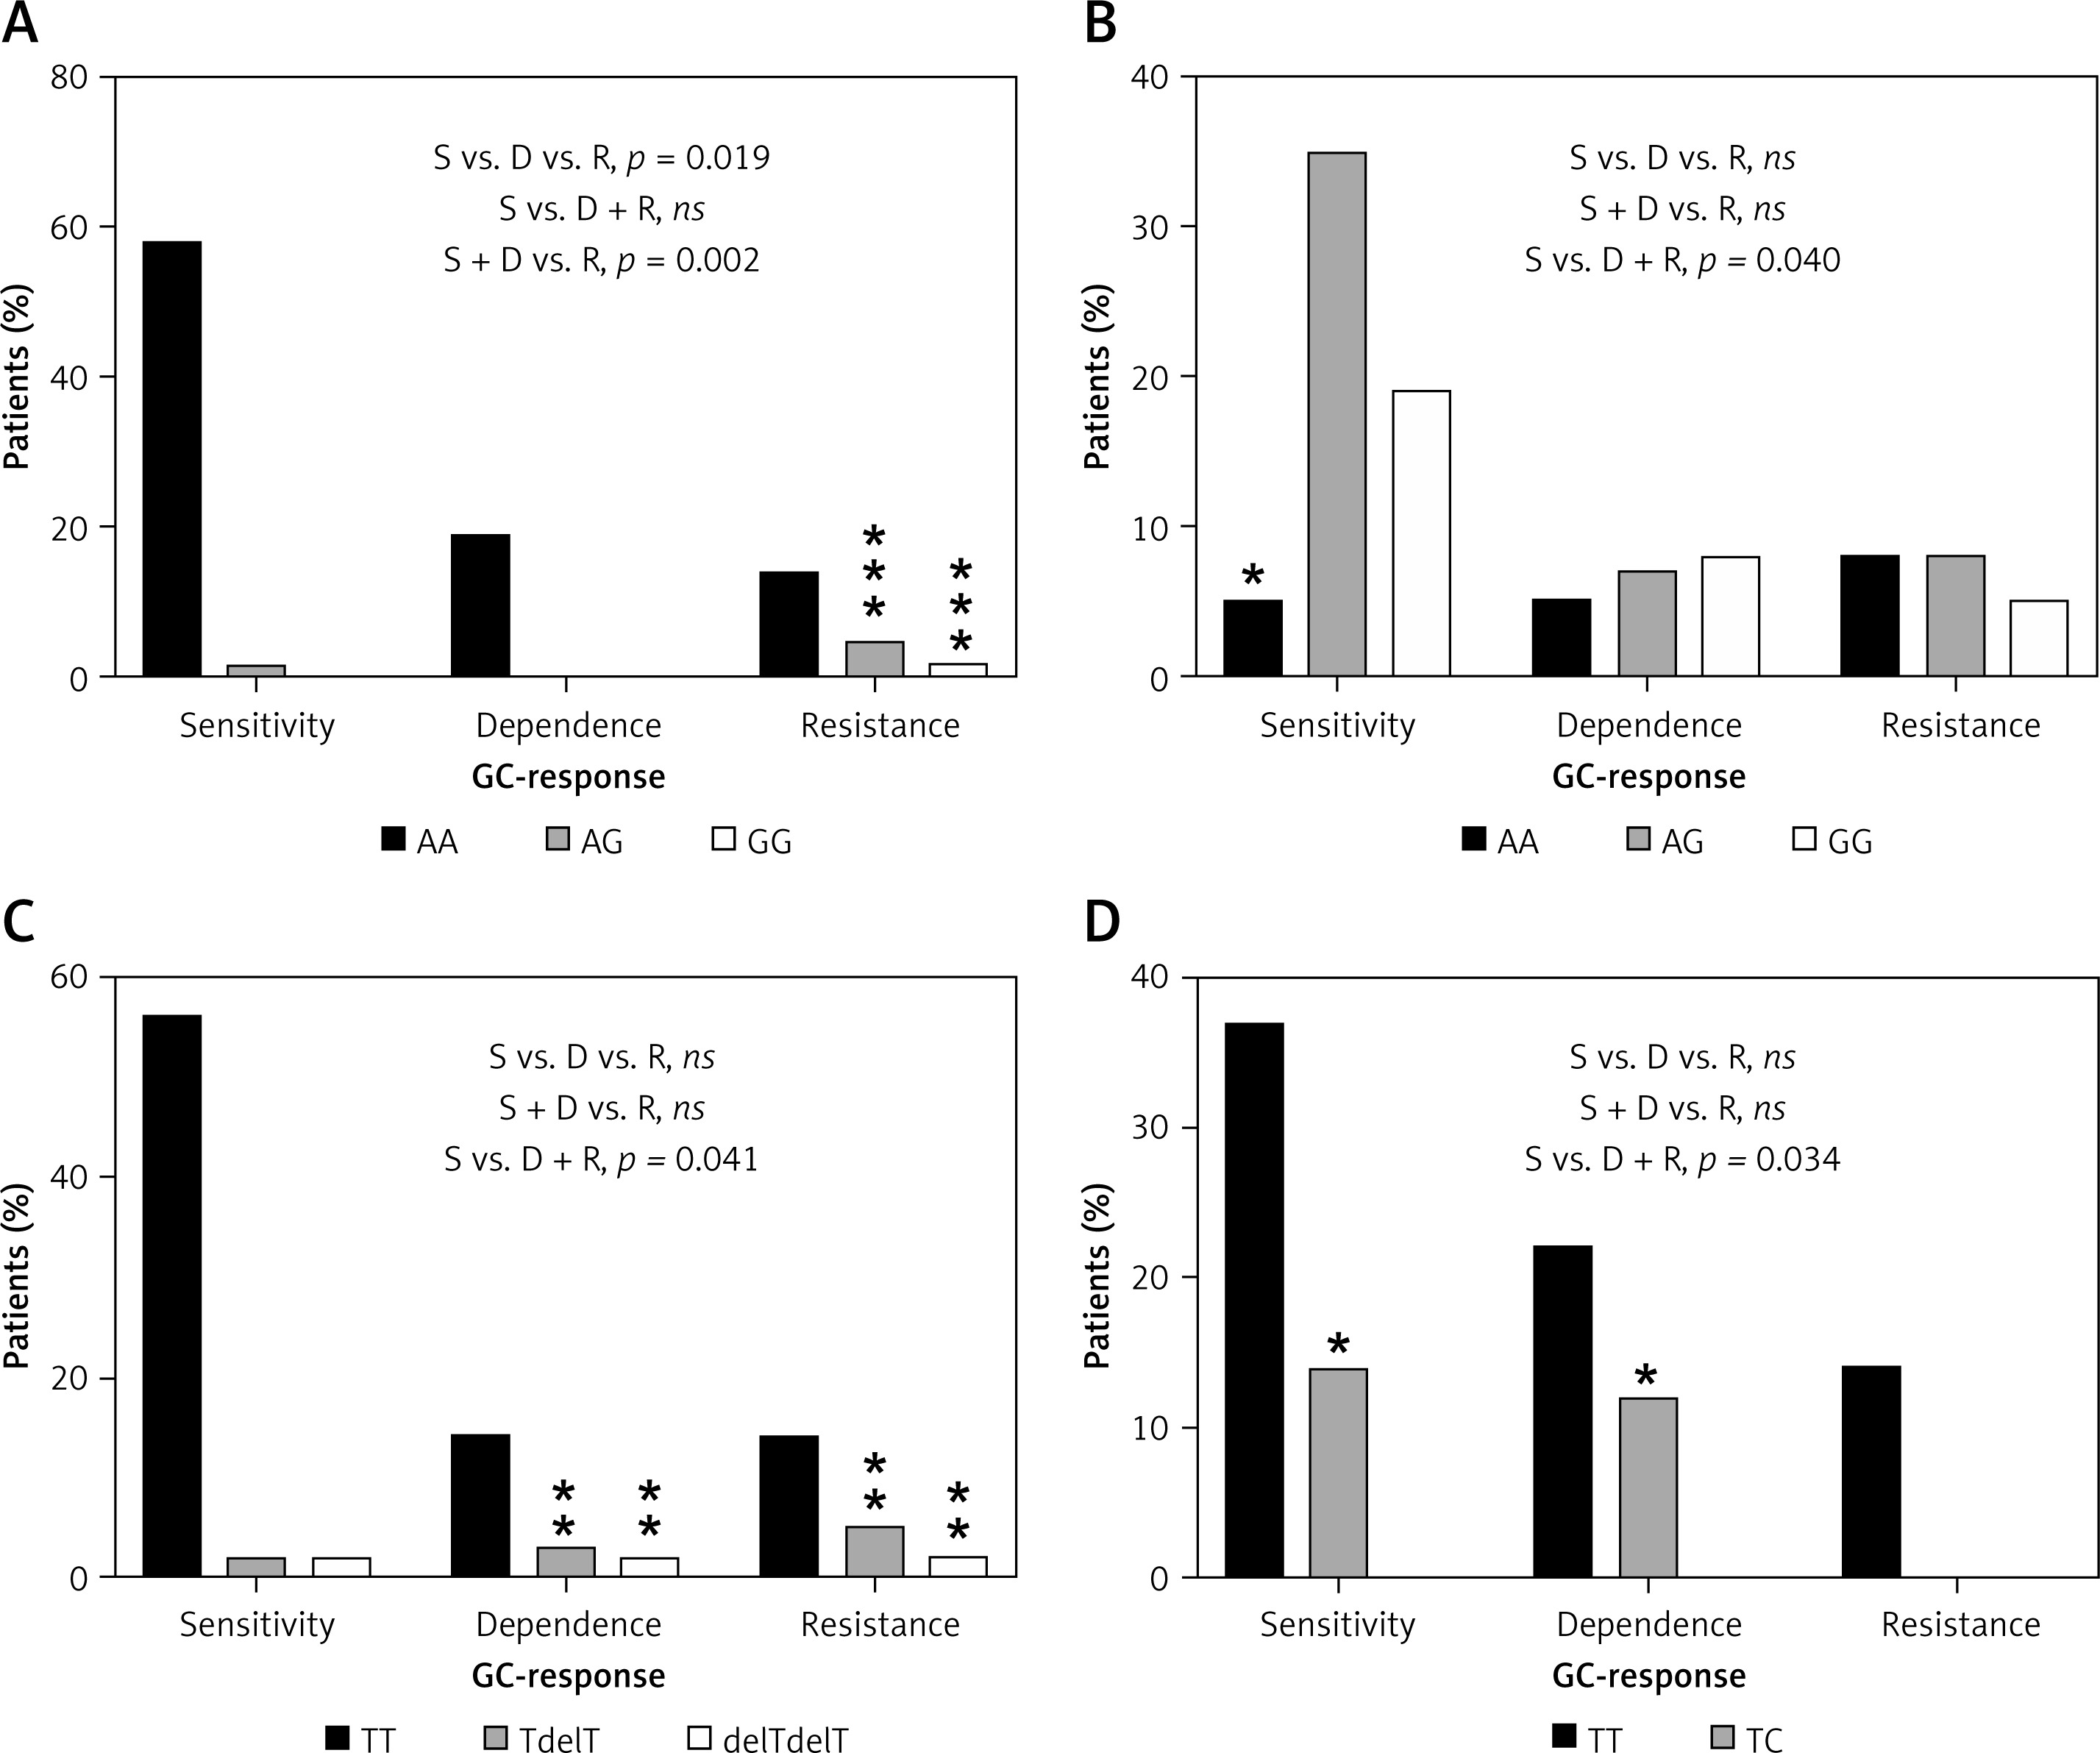
The allele G in position c.1088 (rs56149945) of the NR3C1 gene was identified in UC in 1 patient with GC sensitivity (allele frequency: 1.35%) compared to 3 patients heterozygous and 1 homozygous (allele frequency: 19.2%) in the GC-resistant group. In patients with GC dependency allele G was not found (Figure 5). Consequently, subjects with genotype AG and homozygous GG showed significantly increased resistance to GCs compared to the rest of the patients with UC (OR = 21.333, 95% CI: 2.130–213.648, χ2 = 11.44, p < 0.001). The splicing variant c.241+6A>G (rs2817033) in the FKBP5 gene was relevant to the GC response when comparing the GC-sensitive group versus the rest of UC patients (p = 0.040, Table V). The frequency of the G allele was 62.2% in the GC-sensitive group, 58.3% in -dependent and 42.3% in -resistant. However, the substitution c.241+6A>G inversely correlates with the response to GCs. The homozygous AA is significantly more frequent than AG + GG genotypes in the GC-sensitive group compared to the rest of the UC patients (OR = 0.188, 95% CI: 0.044–0.799, χ2 = 5.84, p = 0.016, Figure 5).
We also observed that the variant c.306-7delT in the MAPK14 gene (p = 0.040) has an effect on GC sensitivity. The allele with deletion T in position c.306-7 was found in UC with a frequency of 4.05% in the GC-sensitive group, 16.7% in the GC-dependent and 19.2% in the GC-resistant group. Deletion T carriers and homozygotes with a mutation showed significant increased dependency or resistance to therapy compared to GC-sensitive patients with UC (OR = 9.722, 95% CI: 1.922–49.183, χ2 = 9.73, p = 0.002).
In CD patients, only one substitution, c.2685+49T>C in the ABCB1 gene, has an impact on resistance to GCs (p = 0.034), which was also visible in the whole group of 139 IBD patients (p = 0.046). The changed allele C was indicated in 11 (17.3%) GC-sensitive and 9 (13.6%) GC-dependent patients. In patients with GC resistance, this allele was absent. The results show that allele C causes a protective effect on GC resistance (Figure 5). The genotype TC demonstrated significantly lower frequency versus TT in GC-resistant patients compared to rest of the CD patients (OR = 0.099, 95% CI: 0.006–1.755, χ2 = 4.50, p = 0.034).
Discussion
Pharmacogenetics in IBD is the subject of a significant amount of research, which consistently concludes that there is a lack of sufficiently strong biomarkers for GC therapy that are useful in clinical practice, thus emphasizing the need for further research [7, 14, 17]. Although the mechanism of GC action involves dozens of genes, so far intensive pharmacogenetic studies of these drugs have focused mainly on single genes, and have produced contradictory results. An example is the NR3C1 gene, of which the c.1184+646C>G polymorphism shows the effect with the GC response [14, 22], although there is a study which does not confirm this observation [16, 23].
Considering the action, transport and metabolism of GCs, in our research we decided to expand significantly the number of genes studied to include both frequently tested NR3C1 for GR and transporter ABCB1 and cytokine genes IL-1A, IL-1B, IL-2, IL-4, CXCL8, IL-10, TNF, chaperones and co-chaperones HSP90AA1, HSPA4, STIP1, FKBP5, inflammasome activator NLRP1, kinase MAPK14, transcription factor genes JUN and NFKBIA, the macrophage migration inhibitory factor MIF gene, metabolism enzyme genes CYP3A4 and CYP3A5, and the importin gene IPO13. The most important purpose of the present study was to determine whether the consequence of genetic variants of the 21 genes selected affect the GC response by studying a cohort of 139 Polish adult IBD patients treated with methylprednisolone, hydrocortisone and slight budesonide (Table II). It was also examined whether the GC treatment depends on gender and diagnosis of CD or UC and whether it affects the GC response in IBD patients because different treatment strategies, i.e. oral methylprednisolone, intravenous hydrocortisone, and oral budesonide, could create a severe limitation (Table II). It is also worth emphasizing that the bioavailability and hepatic activity of budesonide differ from methylprednisolone and hydrocortisone. At the same time, budesonide is dedicated primarily to a specific form of CD. According to ECCO guidelines, it should be effective in patients with ileocaecal localization of CD [1]. We have found no connection between the method of GC therapy and response to it. The GC drugs used in our studies were similar to those investigated in earlier pharmacogenetic research on patients with IBD conducted by Krupoves et al., who evaluated prednisolone and budesonide [24, 25]. Gender also showed no effect on the response to the GCs, but we did identify a significant difference in treatment between patients with CD and UC. However, oral treatment with budesonide during this study was dedicated in Poland only to patients with CD. Therefore, the UC patients could not receive it, which led to differences in GC treatment in our CD and UC patient groups.
High-throughput NGS technology was very helpful in achieving our molecular genetics aim. Therefore, as an additional goal of this work, we developed a rapid, flexible and economical application of NGS by combining it with LR-PCR as target enrichment for pharmacogenetic studies on GC drugs. A similar solution was used successfully in earlier studies [19, 20]. In bioinformatic analysis for our scientific purposes, in contrast to diagnostic standards of minimum coverage 30× [26], we carefully applied a reads cover filter of 10 to avoid omission of any variants at this stage (Figure 2). For most of the loci, the mean coverage for each position analyzed was higher than the cut-off value, i.e. between 22 and 435 (Table V). When it was below 30×, we verified the genotyping data. The weak point of this method turned out to be only the ABCB1 gene. Therefore, for all changes selected for this gene, we performed a full verification for all patients. In the future, the input of the ABCB1 gene amplicons can be increased in the whole library to improve the results. It must be pointed out, however, that the LR-PCR NGS method we applied is easy to modify and relatively cheap. Our calculations including reagents and materials show that LR-PCR NGS would be at least seven times less expensive and laborious than Sanger sequencing [20].
The results of sequence analysis with a total length of 376 894 kb per patient showed the presence of an average of 430 changes per sample, 31 of which were selected for statistical analysis, and finally 4 significantly associated with the response to GCs (Figure 4). These variants include p.Asn363Ser in NR3C1, c.241+6A>G in the FKBP5, c.306-7delT in the MAPK14 and c.2685+49T>C in the ABCB1 gene. Most of the changes investigated in the context of the GC response in IBD refer to the NR3C1 and ABCB1 genes (Table V). The NR3C1 gene variants have been related to both GC sensitivity and resistance [14, 24, 27, 28], while ABCB1 variants, leading to decreased activity of transporter protein, were associated with GC dependence [25, 29]. Previous studies on pediatric IBD patients showed the significance of substitution c.1184+646C>G, leading to increased sensitivity in GC responders versus dependents [14, 22]. Krupoves et al. demonstrated exonic changes p.Arg23Lys and p.Asn767Asn of the NR3C1 gene in pediatric CD in association with GC resistance [24]. Our investigation does not confirm this outcome and is consistent with studies conducted on a group of 200 Caucasians with IBD, where the researchers did not find any association [16]. In our observation, only variant p.Asn363Ser in the NR3C1 gene, which results in the amino acid change from asparagine to serine in codon 363 in the N-terminal trans-activation domain of the GR protein, revealed a significant difference in genotype distribution in the GC-sensitive, -dependent and -resistant groups (p = 0.019). The genotype AG and homozygous GG correlate with increased resistance to GCs compared to the rest of the UC patients, but not CD subjects (Figure 5). In contrast, independent studies have shown no association between the p.Asn363Ser change and the response to GC therapy [14, 16, 23, 24]. There is only evidence that this substitution influences increased sensitivity for exogenous GCs. Huizenga et al. demonstrated stronger inhibition of lymphocyte proliferation by exogenous dexamethasone in heterozygous AG than in wild-type patients. Carriers of the G allele were characterized by a higher BMI index and higher insulin level in blood after the administration of dexamethasone [30].
In previous research on ABCB1 gene variants, Annese et al. found no association between p.Ser893Ala (rs2032582) and p.Ile1145Ile (rs1045642) polymorphisms and for the response to GC treatment. They investigated a group of 594 patients with IBD treated with GCs and a control group of 450 healthy people [31]. The same observation was made by Cucchiara et al. in their research on groups of 200 children with CD and 186 children with UC [15]. However, in contrast to those data, in a Chinese population among three studied variants c.2677T>G, c.1236C>T (p.Gly412Gly, rs1128503), and c.3435C>T of the ABCB1 gene, the CC genotypes in positions c.1236 and c.3435 were more frequent in GC-dependent CD patients than in those responsive to GC, showing that the CC homozygosity of the two SNPs might be the risk factor for GC dependence in CD [29]. Furthermore, Canadian researchers demonstrated a significant association between the polymorphism 2685+49T>C (rs2032583) and the haplotype C-T-C for changes c.3435C>T, c.117+4196T>C (rs3789243) and 2685+49T>C with the occurrence of GC dependence in 260 juvenile patients with CD [25]. They found that in position c.2685+49 in the ABCB1 gene the allele C and genotype CT are protective for dependency on GC treatment, (p = 0.029 and p = 0.035, respectively) [25]. This observation is partly consistent with our results. After correlation analysis of five SNVs – c.3435C>T, c.2677T>G, c.1236C>T, c.2685+49T>C and c.1199G>A (p.Ser400Asn, rs2229109) – in the ABCB1 gene, we found an inverse association of c.2685+49T>C with GC resistance (p = 0.034). We confirm the protective function of the C allele by GC-sensitive and -dependent patients against GC-resistant patients with CD. For the other four ABCB1 variants, we did not observe any significant changes in the frequency of genotypes in particular GC groups.
In these studies, we also identified two associations in loci which were not described earlier in the context of GC treatment and they are not reported in the ClinVar database (https://www.ncbi.nlm.nih.gov/clinvar/). We found that the splicing variants c.241+6A>G in the FKBP5 and c.306-7delT in the MAPK14 gene were relevant in GCs’ response comparing the GC-sensitive group versus the rest of the UC patients (p = 0.040 and p = 0.041, respectively). Until now, only studies by Italian scientists exist in this area, which demonstrated the influence of a putative promoter variant c.-20+18122T>C (rs4713916) in the FKBP5 gene on GC sensitivity in patients with CD but not in UC [16]. The FKBP-51 protein is critical in the correct binding of GCs to GR and in transporting GR to the cell nucleus. Maltese et al. explain that increased expression of FKBP-51 leads to the decreased ability of GR-α to bind GCs, but also to increased translocation of the nonactive GR-β isoform to the cell nucleus [16, 32]. We found that the wildtype homozygous AA in position c.241+6 is significantly rarer than AG + GG genotypes in GC-sensitive patients compared to the rest of the UC patients. Surprisingly, this would indicate that change promotes sensitivity to treatment, which may be related to the maintenance of optimal proportions in the binding of FKBP-51 protein to the active and non-active isoform of the GR. Therefore, we postulate that a splicing variant of the FKBP5 gene observed in our studies could change the level of functional FKBP-51 protein or modify it, and contribute to the emergence of higher GC sensitivity. However, this issue requires further functional research.
The last significant variant in our studies, c.306-7delT, is located in the intron 3 acceptor region of the MAPK14 gene coding for mitogen-activated protein kinase 14, which is also known as MAP kinase p38 α. We found a correlation between carriers of T deletion and homozygous mutants and increased GC dependency or resistance compared to GC sensitivity in patients with UC (OR = 9.722, p = 0.002). MAP kinase p38, which is activated by IL2 and IL-4, phosphorylates GR, resulting in the inhibition of its transcriptional activity [33]. GCs reduce the MAPK signaling pathway via the induction of MAPK phosphatase 1 (MKP1), which consequently inhibits the expression of different inflammatory genes [34]. Furthermore, Bhavsar et al. have proved in severe asthma patients that GC resistance may be improved by inhibitors of p38 MAPK [35]. Accordingly, we suppose that the intronic variant c.306-7delT of the MAPK14 gene relevant in our study could lead to the creation of an altered protein variant, which may not be efficiently inhibited by MKP1 and consequently GC resistance and dependence occurs [12].
In the literature, DNA variants are described, i.e., p.Leu155His (rs12150220) in the NLRP1 gene [14], and c.-308G>A (rs1800629) in the TNF gene [15, 36], related to the response to GCs. We have not confirmed these observations in our studies. Moreover, our results showed apparent differences in the associations of variants between CD and UC that were analyzed. These immunological disorders, although belonging to one group, IBD, are two different diseases with as yet unclear etiology, a different genetic background and probably different pharmacogenetics [16, 37].
It is worth emphasizing that the NGS results obtained seem to have further potential due to the remaining untranslated regions (UTRs), promoters and intron variants which, according to our assumptions, we essentially filtered out. Thus, in the next step, we are planning to correlate these SNVs with clinical data concerning the GC effect. The especially high importance of non-exonic variants was proved by de Iudicibus et al. in recent research, because of binding sites for microRNA [38]. Moreover, it should be taken into account that for personalized glucocorticoid treatment in IBD, a comprehensive approach integrating both genome and transcriptome research, including coding and non-coding RNA, will be necessary [39].
We are aware of the limited subjects of our study group. Therefore, explaining the functional effect of the variants being analyzed will be of particular importance and the present results might become part of the meta-analyses, which will bring us closer to selecting biomarkers for predicting and individualizing GC treatment.
In conclusion, our results demonstrate the critical role of genetic factors of various genes such as FKBP5 and MAPK14 in the response of IBD patients to GC treatment, which indicates the complex contribution of low penetration genes in the GC response. Moreover, we observed that the genetic background differs between CD and UC. Our results should be confirmed in studies on different populations and further functional investigation.