

Introduction
Preeclampsia (PE) is a pregnancy-related hypertensive disorder that typically develops after twenty weeks of gestation, characterized by high blood pressure and damage to multiple organs [1, 2]. This disease poses a serious threat to the health of pregnant women and infants, and may lead to hypertension, cardiovascular damage [3], kidney damage [4], liver damage, multiple organ failure, etc. It may also continue to affect the cardiovascular health of the mother after childbirth. The exact cause of preeclampsia is not yet fully understood, but it is currently believed to be the result of multiple mechanisms such as placental dysfunction, maternal endothelial dysfunction [5], immune abnormalities [6], and genetic factors working together [7, 8]. Its global incidence rate is about 2–8% [9]. In the past 20 years, with the increase of advanced maternal age and the application of assisted reproductive technology [10], the overall incidence rate has increased [11].
In recent years, studies have shown that some preeclampsia patients do not recover normal blood pressure after delivery, but continue to maintain a state of hypertension, and even progress to chronic hypertension (CH) [12]. According to statistics, approximately 15–25% of preeclampsia patients still have postpartum hypertension [13, 14], and these patients have a significantly increased risk of developing cardiovascular diseases in the future, including hypertension, coronary heart disease, stroke, etc. Therefore, identifying the risk factors for postpartum hypertension progression in preeclampsia patients and developing effective predictive models is of great clinical significance for optimizing pregnancy and postpartum follow-up management.
At present, multiple studies have shown that preeclampsia is a risk factor for various cardiovascular diseases [15, 16], but the factors that affect the progression of preeclampsia to cardiovascular diseases such as hypertension have not been fully studied. Factors such as age and body mass index (BMI), as well as the subtypes of preeclampsia, have been shown to be closely related to the development of the disease, but it remains unclear whether these factors will continue to impact patients’ vascular and other organ functions after delivery. Moreover, the incidence of hypertension and cardiovascular diseases is increasing globally year by year, making it of significant clinical and public health importance to identify the factors that contribute to the progression of preeclampsia to postpartum hypertension. The purpose of this study was to address this gap. We aimed to identify significant influencing factors for the progression of hypertension through multiple logistic regression analysis and generalized estimating equations, and further construct a nomogram model to predict the probability of individuals with preeclampsia developing postpartum hypertension.
Material and methods
Research object
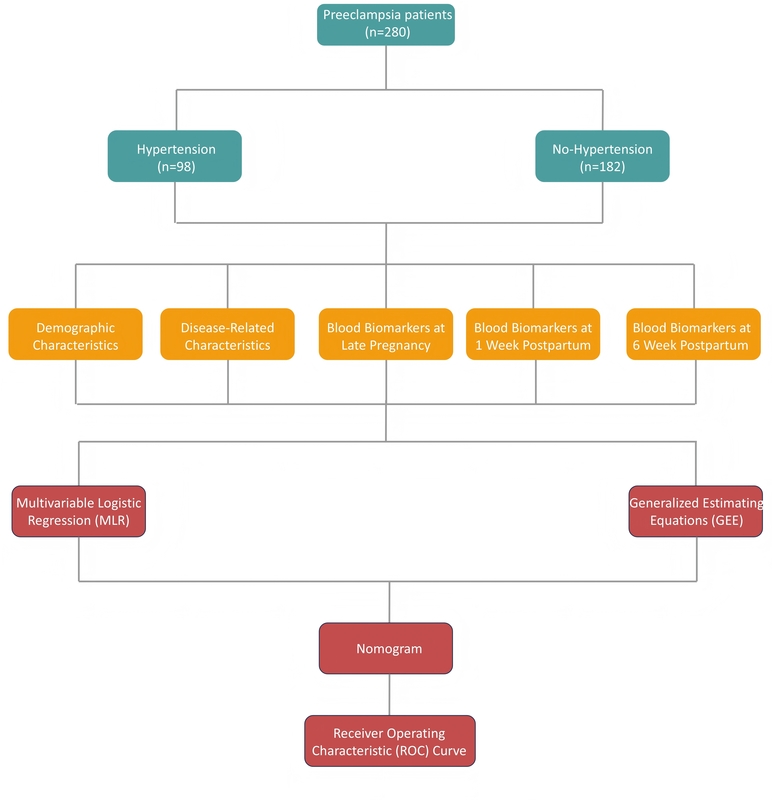
This retrospective study included 280 preeclampsia patients who gave birth in our hospital between January 2017 and January 2019. The inclusion criteria were: 1) age ≥ 18 years; 2) pregnant women over 20 weeks of gestation; 3) diagnosed with preeclampsia according to the American College of Obstetricians and Gynecologists (ACOG) 2013 criteria; 4) complete clinical data. The exclusion criteria were: 1) having hypertension or other cardiovascular diseases that may interfere with the study before pregnancy; 2) major immune system and other coagulation disorders; 3) severe liver and kidney dysfunction; 4) serious mental illness or poor compliance; 5) follow-up not completed.
Data collection
We collected baseline data such as age, pre-pregnancy BMI, postpartum BMI, subtypes of preeclampsia, severity of preeclampsia, family history of cardiovascular disease, and pregnancy related data such as the occurrence of fetal growth restriction and the presence of hemolysis, elevated liver enzymes, and low platelets syndrome (HELLP) syndrome. We collected delivery-related data, such as whether the patient had a premature birth or underwent a cesarean section. We also collected the Edinburgh Postnatal Depression Scale (EPDS) and Generalized Anxiety Disorder-7 (GAD-7) scores, uterine artery pulsatility index (UtA-PI), and umbilical artery pulsatility index (UA-PI) from late pregnancy. Additionally, we collected the levels of platelets (PLT), aspartate aminotransferase (AST), alanine aminotransferase (ALT), 24-hour urinary protein (24-hour UP), uric acid (UA), and C-reactive protein (CRP) in late pregnancy, 1 week postpartum, and 6 weeks postpartum.
Hypertension was defined as an interval of at least 1 day and a systolic blood pressure of ≥ 140 mm Hg or a diastolic blood pressure of ≥ 90 mm Hg. The measurement method was to sit still for at least 5 min, use a suitable cuff to measure upper arm blood pressure, and take the average of 2–3 measurements. The diagnosis of hypertension in all patients within 5 years postpartum was documented.
Statistical analysis
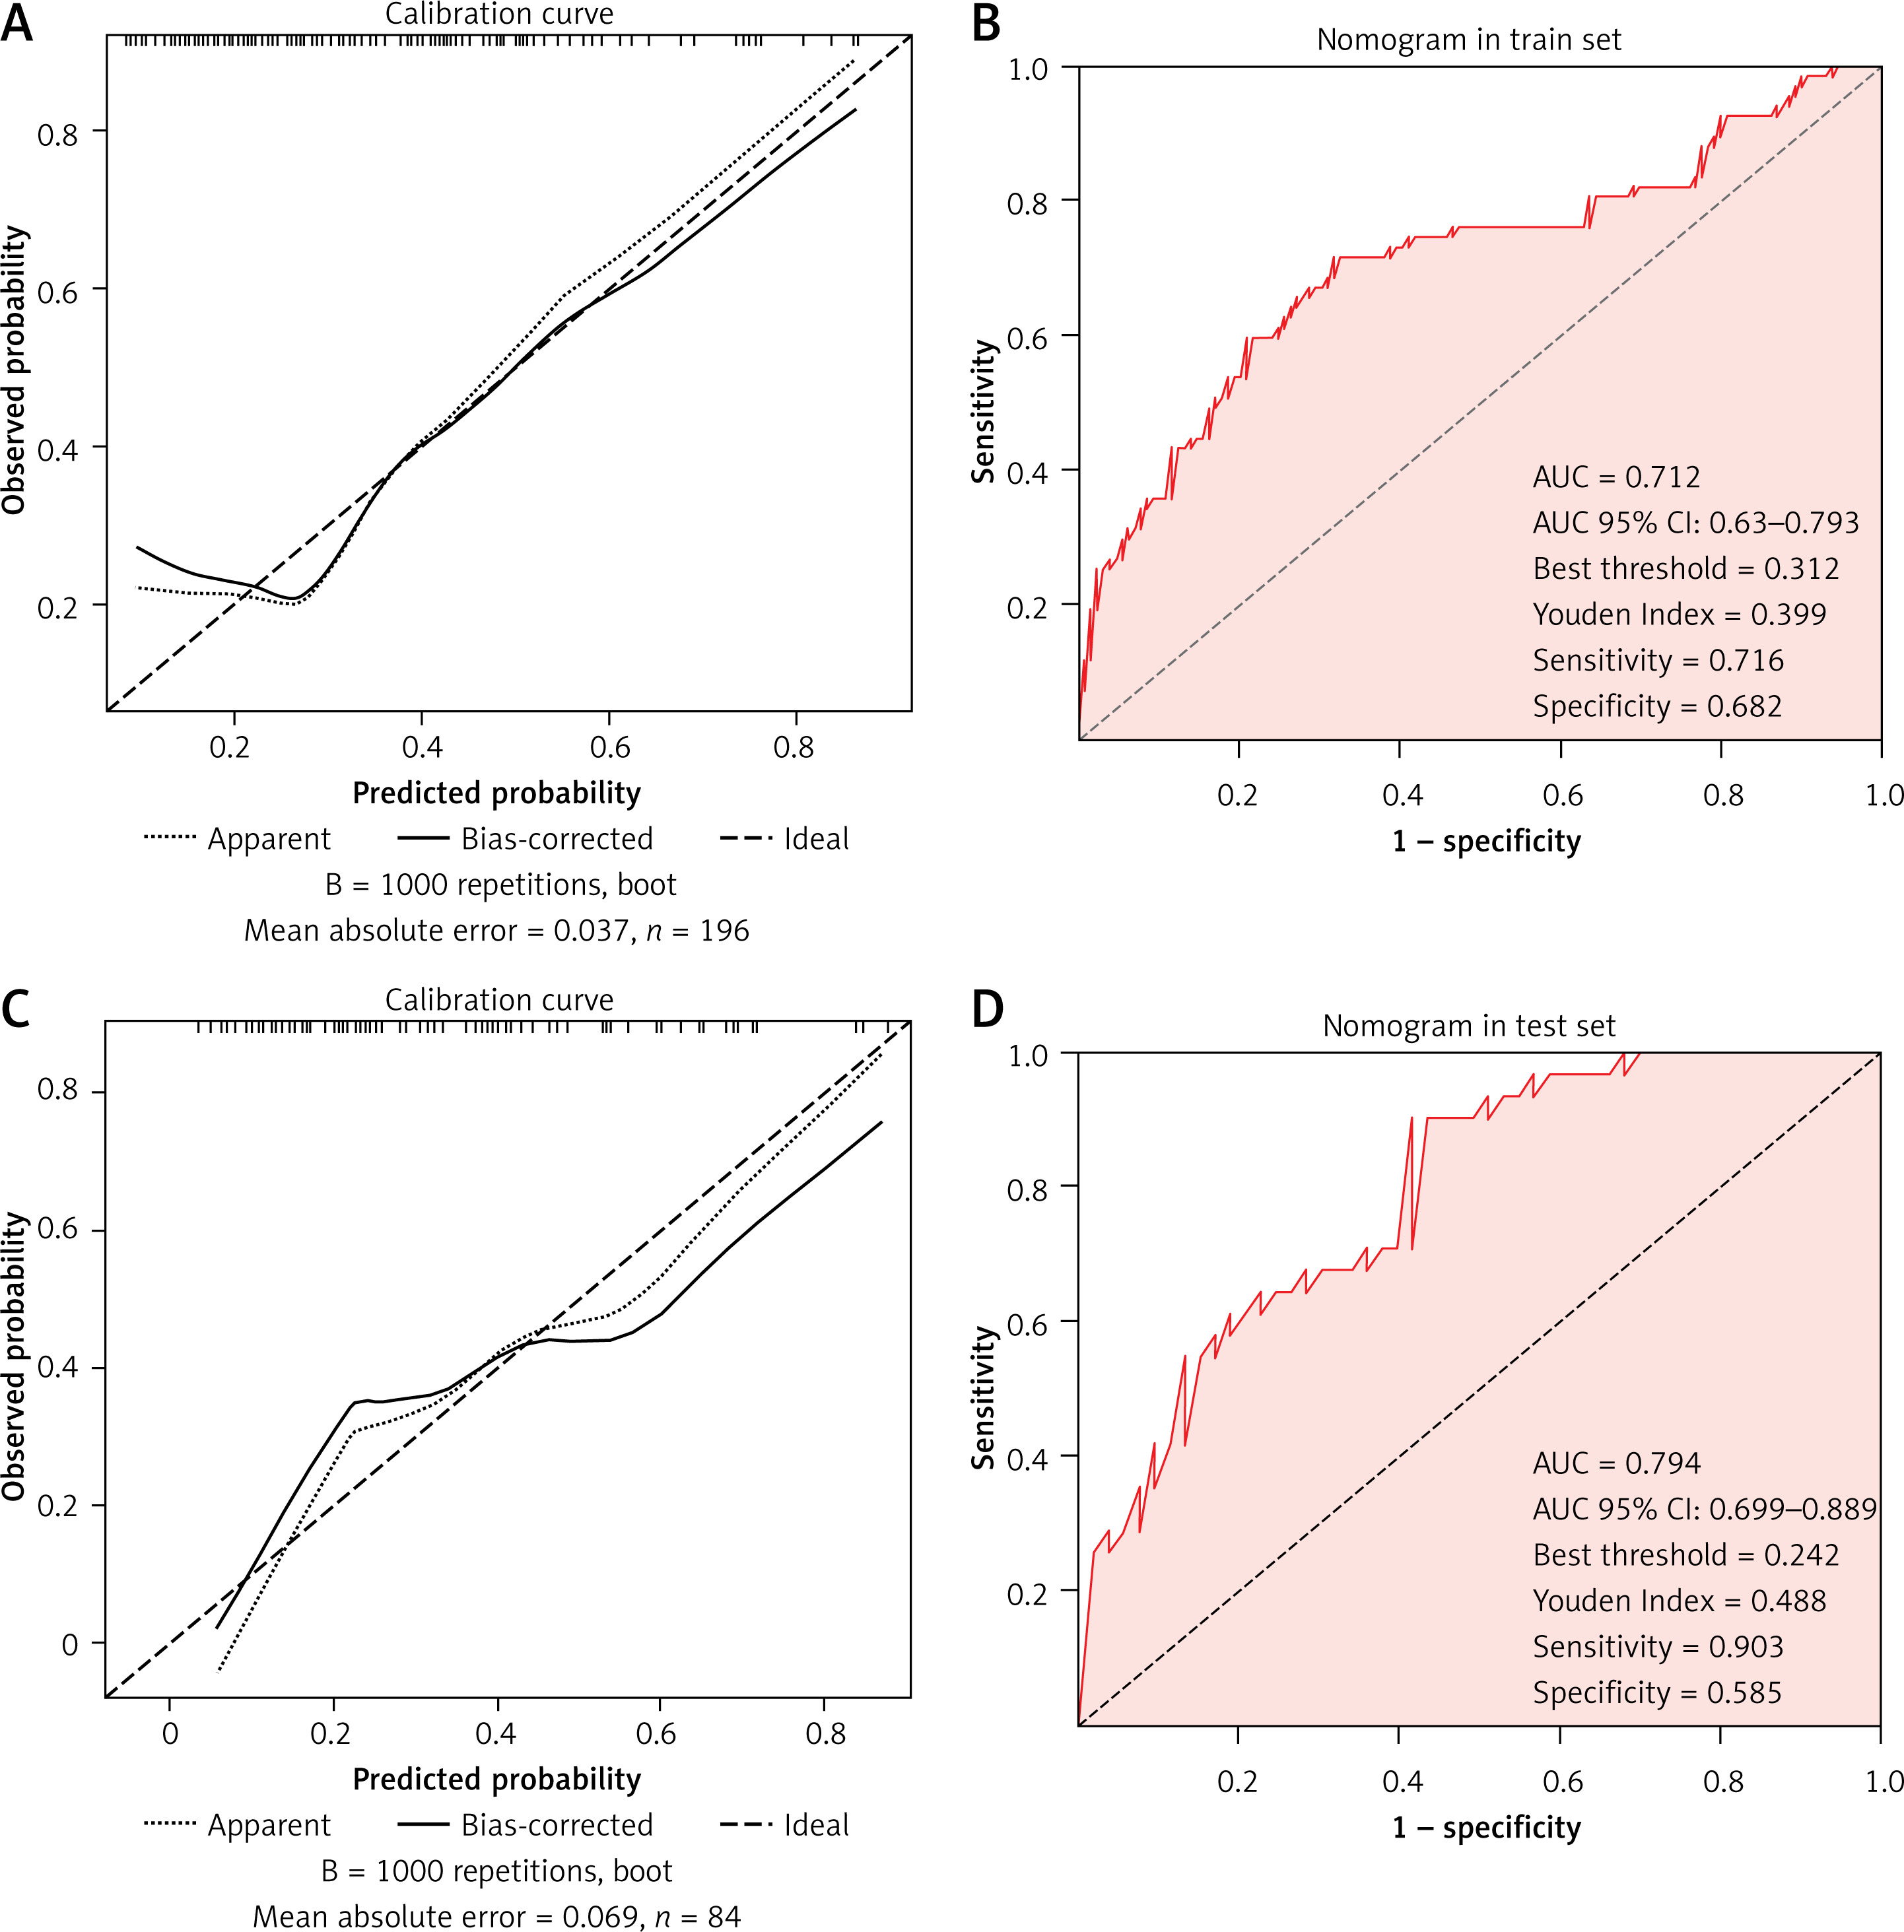
All analyses in this study were conducted using R 4.4.0 software. For continuous data, the Mann-Whit ney U test or t-test was used, with values presented as the median (minimum–maximum). For categorical data, the χ2 test or Fisher’s exact test was used, with values presented as the frequency (percentage). Using multiple logistic regression analysis to calculate the odds ratio (OR) value and 95% confidence interval (CI), the factors influencing hypertension progression were explored. Generalized estimating equations (GEE) were applied to conduct a longitudinal analysis of blood indicators (including platelet count, uric acid, and ALT) measured in the third trimester, 1 week postpartum, and 6 weeks postpartum, in order to explore their dynamic changes and association with the development of postpartum hypertension. Subsequently, a nomogram prediction model was constructed based on significant factors identified by multivariate logistic regression and GEE. The model’s discriminative ability and predictive performance were evaluated in both the training and testing sets using receiver operating characteristic (ROC) curves and the area under the curve (AUC), verifying its clinical utility. All statistical tests were two-sided, and p < 0.05 was considered statistically significant.
Results
Differences in demographic and disease characteristics between preeclampsia patients who have progressed to hypertension and those who have not progressed to hypertension
Patients who progressed to hypertension had significantly higher pre-pregnancy BMI (30.4 vs. 28.7, p = 0.0469) and postpartum BMI (31.4 vs. 29.4, p = 0.0052), as well as a higher proportion of early-onset preeclampsia (30.61% vs. 17.03%, p = 0.0134) and severe preeclampsia (40.82% vs. 21.43%, p = 0.0010).
They also had a significantly higher incidence of fetal growth restriction (33.67% vs. 20.33%, p = 0.0206), placental abruption (15.31% vs. 3.3%, p = 0.0007), preterm birth (27.55% vs. 11.54%, p = 0.0013), and oligohydramnios (25.51% vs. 9.34%, p = 0.0006). Additionally, their EPDS score (11 vs. 9, p = 0.0105), GAD-7 score (12 vs. 10, p = 0.02), UtA-PI (1.9 vs. 1.8, p = 0.0062), and UA-PI (1.9 vs. 1.9, p = 0.0255) were significantly higher than in those who did not progress to hypertension (Table I).
Table I
Differences in demographic and disease-related characteristics between preeclampsia patients who developed hypertension and those who did not
Differences in blood indicators between patients with and without hypertension during late pregnancy, 1 week postpartum, and 6 weeks postpartum
The results showed that in patients who progressed to hypertension in late pregnancy (128 vs. 137 × 109/l, p = 0.0112), the platelet levels at 1 week postpartum (170 vs. 188 × 109/l, p = 0.0251) and 6 weeks postpartum (201 vs. 230 × 109/l, p = 0.00764) were significantly lower than in those in patients who did not progress to hypertension. The AST levels in patients who progressed to hypertension were significantly higher at 1 week postpartum (48.6 vs. 46.0 U/l, p = 0.00495) and 6 weeks postpartum (36.3 vs. 34.1 U/l, p = 0.0267) compared to those who did not. Similarly, ALT levels were significantly higher in the hypertension group at late pregnancy (72.2 vs. 66.3 U/l, p = 0.0161), 1 week postpartum (46.9 vs. 43.6 U/l, p = 0.0297), and 6 weeks postpartum (38.6 vs. 34.1 U/l, p = 0.0023). 24-hour urinary protein levels were also significantly higher in the hypertension group at late pregnancy (710.4 vs. 634.4 mg/day, p = 0.0154), 1 week postpartum (352.1 vs. 325.5 mg/day, p = 0.0383), and 6 weeks postpartum (245.7 vs. 229.2 mg/day, p = 0.0319). Uric acid levels were significantly higher at late pregnancy (6.4 vs. 6.2 mg/dl, p = 0.0132), 1 week postpartum (5.5 vs. 5.4 mg/dl, p = 0.0213), and 6 weeks postpartum (4.4 vs. 4.2 mg/dl, p = 0.00841) in patients who developed hypertension. Similarly, CRP levels were significantly higher in the hypertension group at late pregnancy (22.1 vs. 20.5, p = 0.0191), 1 week postpartum (9.8 vs. 8.7, p = 0.0118), and 6 weeks postpartum (4.2 vs. 3.7, p = 0.0263) (Table II).
Table II
Differences in blood biomarkers at late pregnancy, 1 week postpartum, and 6 weeks postpartum between preeclampsia patients who developed hypertension and those who did not
Multivariate logistic regression screening for independent influencing factors of hypertension
The results showed that postpartum BMI (OR = 1.019, 95% CI: 1.004– 1.035, p = 0.016), pregnancy depression (EPDS) (OR = 1.019, 95% CI: 1.005–1.033, p = 0.007), pregnancy anxiety (OR = 1.016, 95% CI: 1.004–1.028, p = 0.010), uterine artery pulsatility index (UtA-PI) (OR = 1.229, 95% CI: 1.078–1.401, p = 0.002), and the umbilical artery pulsatility index (UA-PI) (OR = 1.239, 95% CI: 1.023–1.500, p = 0.029) were all significantly positively correlated with the progression of hypertension. There was also a significant positive correlation between placental abruption (OR = 1.438, 95% CI: 1.196–1.728, p = 0.000), premature birth (OR = 1.200, 95% CI: 1.052–1.368, p = 0.007), oligohydramnios (OR = 1.255, 95% CI: 1.092–1.442, p = 0.002), and the development of hypertension. Additionally, the severity of the disease (OR = 1.180, 95% CI: 1.057–1.317, p = 0.003) was significantly positively correlated with the development of hypertension, and the subtypes of preeclampsia (OR = 0.866, 95% CI: 0.770–0.973, p = 0.017) were significantly negatively correlated with the development of hypertension, indicating a lower likelihood of late-onset preeclampsia progressing to hypertension (Table III). The top three most significant factors are placental abruption, oligohydramnios, and umbilical artery pulsatility index.
Table III
Multivariate logistic regression to identify independent risk factors for progression to hypertension
Screening progress of generalized estimating equations for factors influencing hypertension
The results showed that PLT was significantly negatively correlated with the progression of hypertension (β = –0.008, p < 0.001). ALT was significantly positively correlated with the progression of hypertension (β = 0.034, p < 0.001). UA was significantly positively correlated with the progression of hypertension (β = 0.671, p < 0.001). CRP was significantly positively correlated with the progression of hypertension (β = 0.110, p < 0.001). One week postpartum was significantly positively correlated with the progression of hypertension (β = 4.194, p < 0.001). Six weeks postpartum was significantly positively correlated with the progression of hypertension (β = 6.517, p < 0.001). The interaction analysis with time showed that AST (β = 0.060, p = 0.043) at 1 week postpartum (T2), ALT (β = 0.040, p = 0.086) and CRP (β = 0.226, p = 0.093) at 6 weeks postpartum (T3) were significantly positively correlated or nearly significantly positively correlated with the progression of hypertension (Table IV). Among them, the top three factors with the highest significance (ranked by Wald size) are UA, PLT, and ALT.
Table IV
Screening for risk factors of progression to hypertension based on generalized estimating equations (GEE)
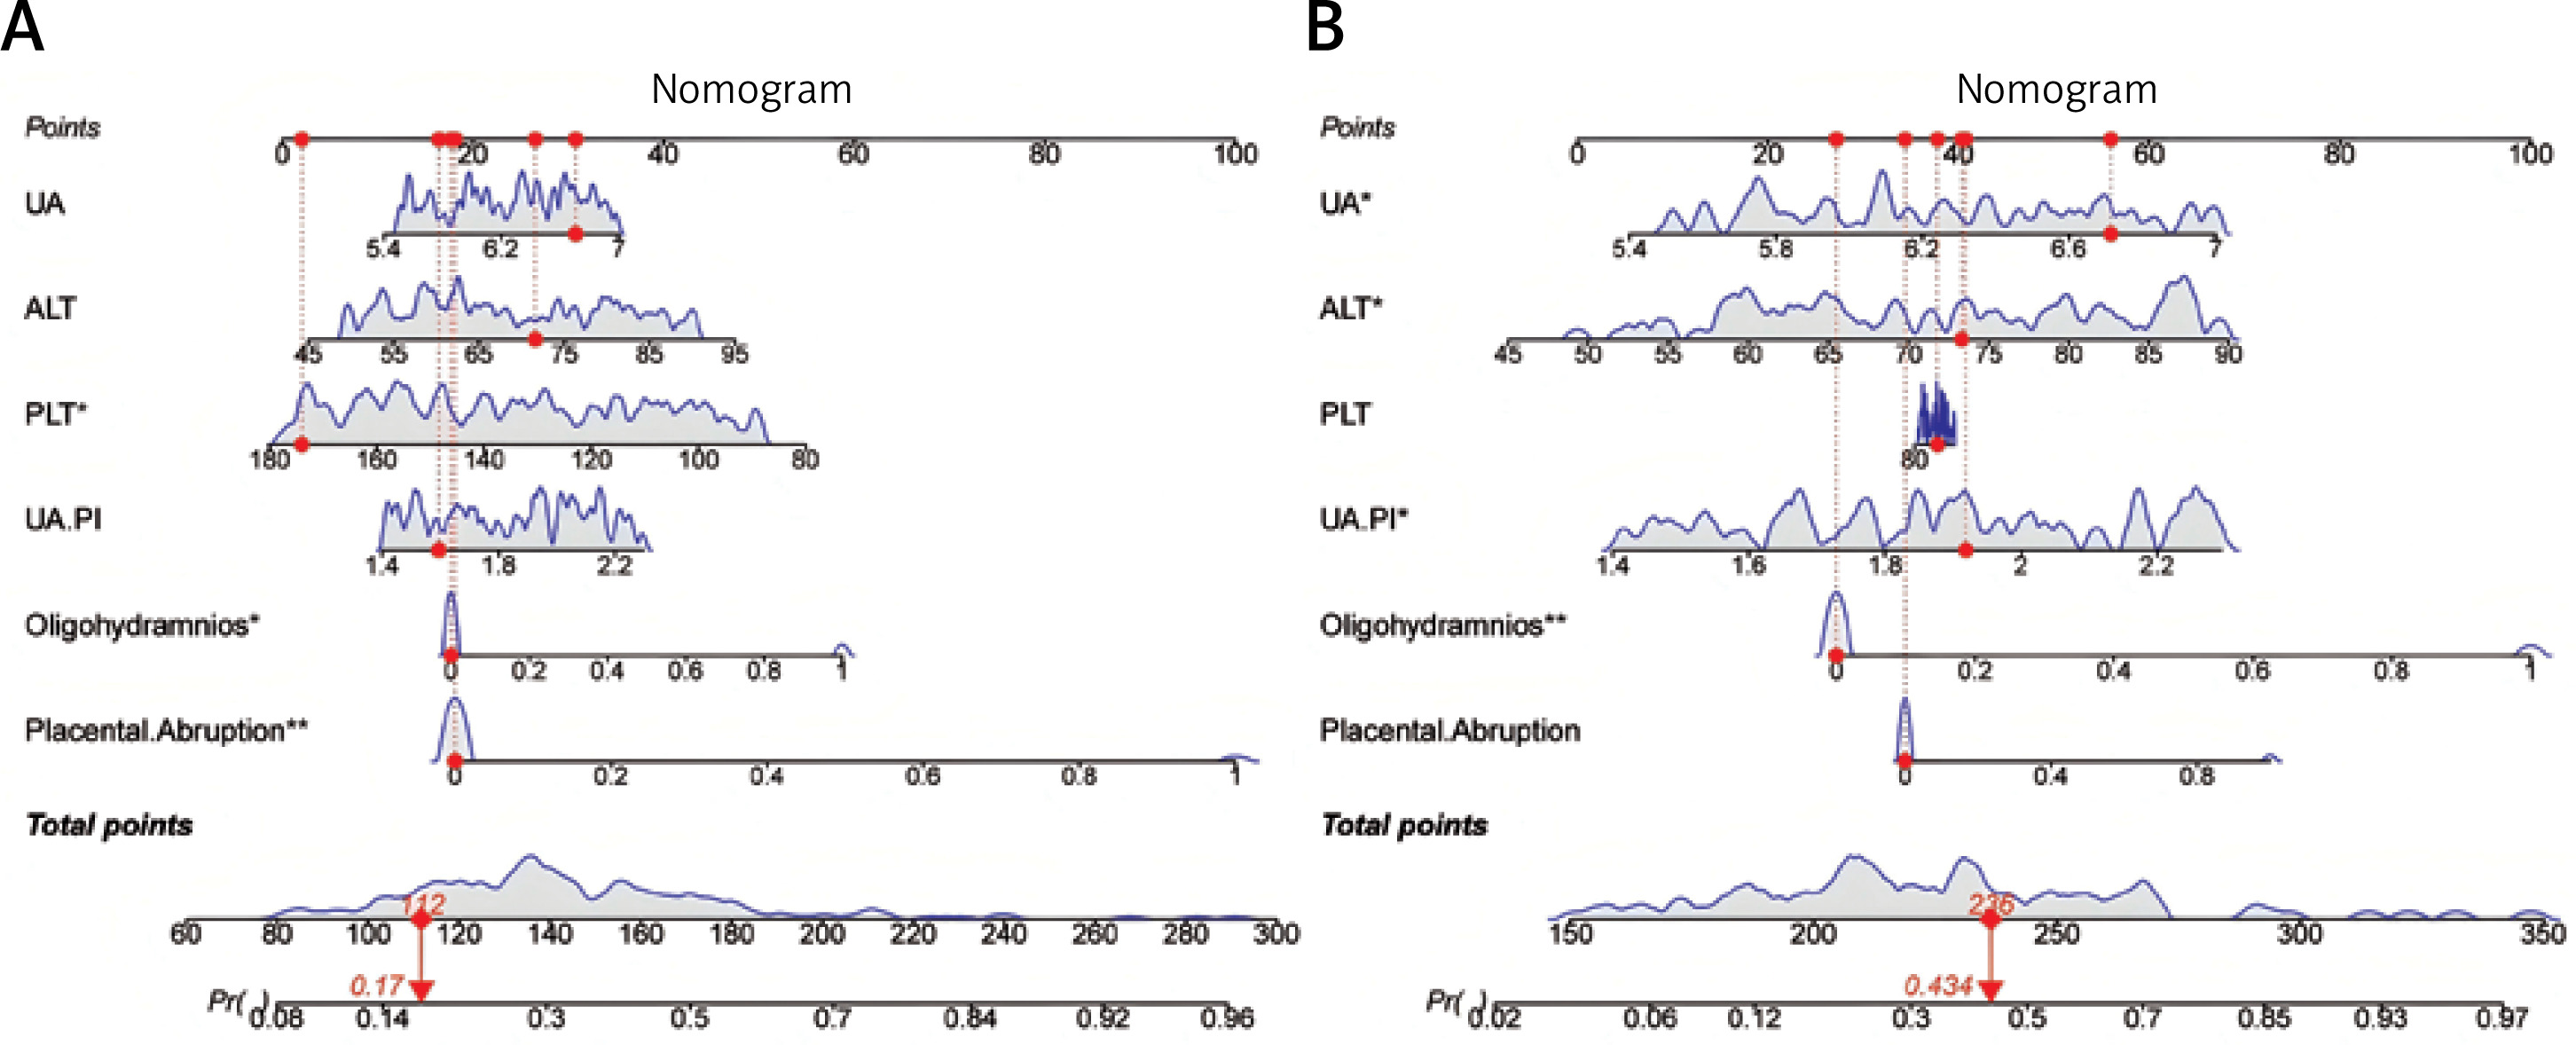
Construction of nomogram
We selected factors with high significance in both multivariate logistic regression and generalized estimating equations. These included placental abruption, oligohydramnios, UA-PI, UA, PLT, and ALT. Based on these factors, we constructed a nomogram using the training and test sets to predict the probability of developing hypertension. Each of the six indicators is assigned a scores on the nomogram. By calculating the total score of these six indicators, the total score and corresponding risk probability can be obtained. For example, in the training set, a patient’s total score is 112, and the probability of developing hypertension is 17%. In the test set, a patient’s total score is 236, and the probability of developing hypertension is 43.4% (Figures 1 A, B). The calibration curve and ROC curve indicate that the nomogram has good predictive ability in both the training set and test set (Figures 2 A–D).
Discussion
Through univariate and multivariate analysis, we identified six factors – namely placental abruption, oligohydramnios, umbilical artery pulsatility index, UA, PLT, and ALT – that were significantly associated with the development of hypertension. Placental abruption is a pregnancy complication that can endanger the lives of both the mother and the fetus, commonly occurring after 20 weeks of pregnancy. Preeclampsia patients are prone to vascular spasm or endothelial damage, leading to insufficient blood supply to the placenta, ischemia or hematoma formation, resulting in placental separation [17]. The risk of preeclampsia patients with placental abruption progressing to hypertension within 5 years postpartum was significantly increased. This may be due to placental abruption causing vascular damage and endothelial dysfunction in the mother, which exacerbates oxidative stress and inhibits endothelial nitric oxide synthase (eNOS) activity. If not fully repaired postpartum, this may result in a sustained reduction in nitric oxide (NO) levels and an increase in inflammatory cytokines, and potentially lead to long-term progression to hypertension [18].
Preeclampsia patients are also prone to oligohydramnios [19], which may be due to placental ischemia leading to fetal hypoxia. This triggers neuroprotective mechanisms that prioritize blood supply to the brain and heart, reduce renal perfusion, decrease fetal urine output, and ultimately result in oligohydramnios. When the fetus suffers from chronic hypoxia, it secretes more antidiuretic hormone (ADH), further reducing urine output and leading to oligohydramnios. Pathological analysis of placenta with oligohydramnios may reveal widespread infarction, thrombosis, and ischemic necrosis of villi, indicating that preeclampsia patients also face endothelial damage and imbalance of active substances. Prolonged postpartum vascular damage can easily progress to hypertension.
The umbilical artery pulsatility index is commonly used to monitor fetal blood flow and oxygen supply in utero [20]. Preeclampsia patients may experience impaired remodeling of the spiral arteries, leading to increased placental vascular resistance. Therefore, the umbilical artery pulsatility index is usually higher. Placental hypoxia releases anti-angiogenic factors (such as sFlt-1) and inflammatory mediators (TNF-α, IL-6) into the maternal circulation, leading to vascular damage. Even after delivery, the damage may persist, leading to an increase in vasoconstrictors (such as endothelin-1) and causing hypertension. Placental ischemia can also lead to overactivity of the renin-angiotensin system and elevated levels of angiotensin II, and trigger hypertension.
Uric acid is crucial in the pathogenesis of preeclampsia, as it can exacerbate oxidative stress by activating NADPH oxidase, increase inflammation levels by activating the NLRP3 inflammasome, and stimulate placental vascular smooth muscle to cause vasoconstriction, thereby exacerbating disease progression [21]. Persistent high uric acid levels after childbirth can crystallize and deposit in the renal tubules, increasing the burden on the kidneys and thus increasing the risk of postpartum hypertension. Thrombocytopenia is a common complication in preeclampsia patients [22, 23], and endothelial injury promotes platelet adhesion to exposed collagen, forming microthrombi and consuming large amounts of platelets. The excessive activation of the coagulation system caused by placental ischemia can also form microthrombi, consume platelets, and lead to a structural reduction in the capillary network. The decrease in postpartum platelet levels reflects the persistence of symptoms such as vascular damage, imbalance of the coagulation fibrinolysis system, and microvascular rarefaction, thereby increasing the risk of hypertension. Alanine aminotransferase is a hallmark of liver injury [24], and sFlt-1, along with the release of inflammatory factors (TNF-α) and angiotensin II, leads to systemic small artery vasospasm and liver microcirculation disorders. Overactivation of the coagulation system can lead to blockage of sinusoidal blood flow and damage to liver cells. The intensified oxidative stress response produces reactive oxygen species (ROS) and other peroxides, which enter the liver through the portal vein circulation, exacerbating liver cell damage and increasing ALT levels. The continuous increase in postpartum ALT levels suggests that liver inflammation and oxidative stress progressively worsen vascular damage. Abnormal liver metabolism may lead to excessive triglyceride deposition in the vascular wall, promoting atherosclerosis. Metabolic disorders can also cause insulin resistance, activate the sympathetic nervous system, promote vascular contraction, and increase the risk of development of hypertension.
The innovation of this study lies in the analysis of the interaction between blood markers and time. The results showed that AST levels 1 week after delivery were significantly correlated with the progression of hypertension. This suggests the importance of postpartum monitoring. Early postpartum intervention may be an important time point for hypertension intervention. Monitoring AST levels during this period and early intervention for patients with high AST can reduce the risk of developing hypertension in preeclampsia patients. This also indicates that preeclampsia not only affects pregnancy, but also plays an important role in postpartum vascular damage and oxidative stress, providing early identification strategies for predicting the risk of hypertension in preeclampsia patients within 5 years postpartum.
In order to help clinical doctors more accurately determine the risk of hypertension, we have constructed a nomogram. Based on this, clinical doctors can calculate the comprehensive risk score of patients by assigning values according to the significant influencing factors we have screened, and quickly assess the possibility of patients developing hypertension after childbirth. Our nomogram shows good discrimination and calibration, which can provide some reference for clinical decision-making.
This study also has certain limitations. As a retrospective study with a small sample size and limited factors included, the generalizability and applicability of the results are restricted. We have only identified factors influencing the progression of preeclampsia to hypertension but have not conducted specific mechanistic investigations to explore the underlying biological mechanisms. Future studies should include more influencing factors and conduct larger-scale randomized controlled trials to further validate our conclusions, as well as mechanistic studies to better elucidate the biological basis.
In conclusion, the incidence of placental abruption and oligohydramnios, umbilical artery pulsatility index, UA, PLT, and ALT in preeclampsia patients who progress to hypertension are significantly higher than in those preeclampsia patients who do not progress to hypertension. Placental ischemia and persistent vascular damage postpartum may be important mechanisms for the progression of hypertension. The AST index 1 week postpartum is closely related to the progression of hypertension. The nomogram performs well in predicting the risk of developing hypertension. However, due to the nature of this retrospective study, the conclusions should be cautiously validated in future prospective studies to eliminate potential biases and further confirm their clinical applicability. This study provides a predictive basis for the occurrence of postpartum hypertension in preeclampsia patients, which is helpful for clinical doctors to identify high-risk populations early.

